Review
. 2023 Feb 28;158(8):081001.
doi: 10.1063/5.0138175.

The "violin model": Looking at community networks for dynamic allostery

Affiliations
Review

The "violin model": Looking at community networks for dynamic allostery

Lalima K Madan et al. J Chem Phys. .

Abstract

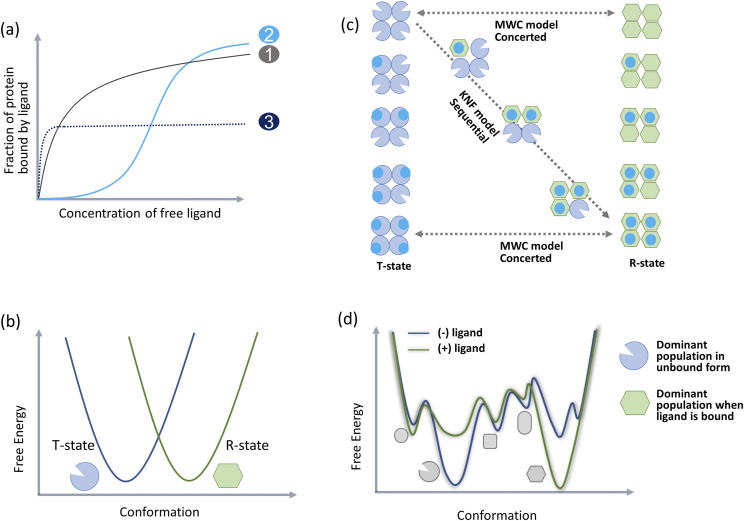
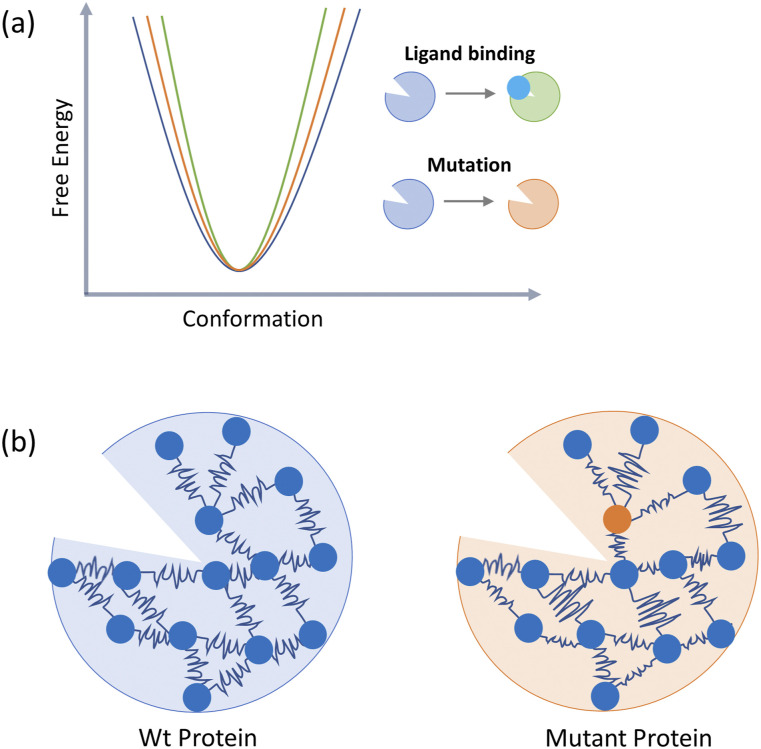
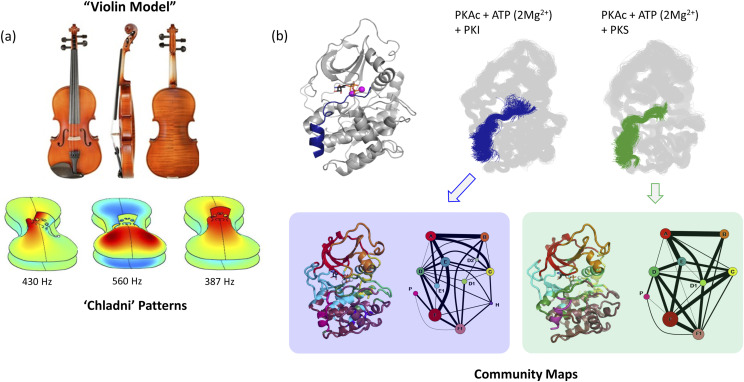
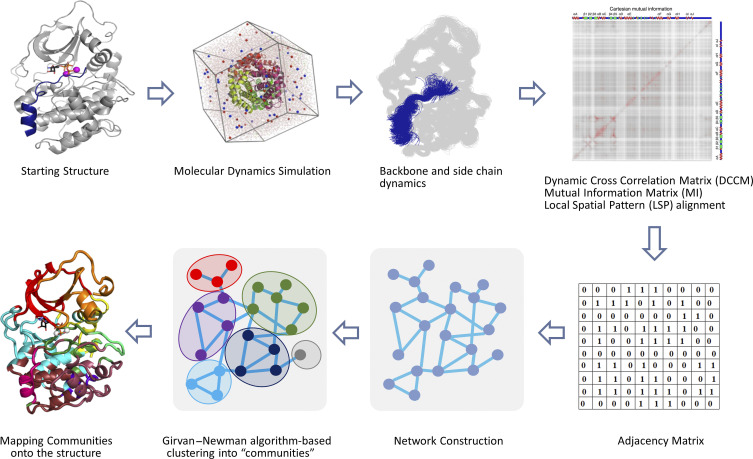
Allosteric regulation of proteins continues to be an engaging research topic for the scientific community. Models describing allosteric communication have evolved from focusing on conformation-based descriptors of protein structural changes to appreciating the role of internal protein dynamics as a mediator of allostery. Here, we explain a "violin model" for allostery as a contemporary method for approaching the Cooper-Dryden model based on redistribution of protein thermal fluctuations. Based on graph theory, the violin model makes use of community network analysis to functionally cluster correlated protein motions obtained from molecular dynamics simulations. This Review provides the theory and workflow of the methodology and explains the application of violin model to unravel the workings of protein kinase A.


Figures

FIG. 1.
FIG. 1.
Conformation-based description of allostery (a) canonical descriptors of allostery is based on cooperativity seen in multimeric proteins (like hemoglobin) when they bind their ligands. If the active sites of the monomers are independent, ligand binding curves have a hyperbolic shape like those of Michaelis Menten plots (curve 1). In positive cooperativity, the plot flattens at first and then quickly increases to attain maximal signal (curve 2). The MWC formula is an expression for this S-shaped binding function. Negative cooperativity is seen as a steep rise in binding with early flattening of the curve before optimal binding saturation (curve 3). (b) MWC and KNF models of allostery are based on descriptors of two distinct protein conformations that occupy distinct basins in the free energy landscape. Conformation that has low affinity for the ligand is called the tense state (T-state) and the conformation with high affinity for the ligand is the relaxed state (R-state). (c) The MWC model postulates that the two protein conformations coexist in an equilibrium while the KNF model postulates that ligand binding induces conformational switching and converts one conformation to another. (d) The population shift theory postulates that a protein’s free energy landscape includes an ensemble of varying populations of all probable conformations. Allosteric signals (like ligand binding) choose compatible populations to shift the ensemble to a new averaged conformation.
FIG. 2.
FIG. 2.
Dynamics-based description of allostery (a) The Cooper–Dryden model postulates that reorganization of internal protein motions allows for allosteric communications in proteins in the absence of any major conformational change. (b) The Elastic Network Model reduces a protein into an elastic mass-and-spring network. Allosteric stimuli (like mutations and ligand binding) alter the mass density and moduli of connecting springs.
FIG. 3.
FIG. 3.
Violin model of allostery. (a) Harmonic nodes create a vibrational resonance pattern on the plates of a violin called “Chladni patterns.” At different node frequencies, different parts of the plates are synchronized to vibrate together or against each other. Elastic properties of the plate affect Chladni patterns. Chladni pattern pictures obtained from Ref. . (b) If the kinase bi-lobal structure is thought of as a violin, Chladni patterns are reflective of the resonance patterns of internal vibrations/amino acid motions of the protein. Different effectors (like binding of PKI and PKS) generate distinct “community maps” when analyzing dynamics-based amino acid networks.
FIG. 4.
FIG. 4.
Schematic workflow of community map analysis. Amino acid dynamics is obtained by microsecond MD simulations and is assessed for entropic correlations by computing DCCM, MI, or LSP matrices. These matrices, in turn, are used to create an adjacency matrix to reveal a residue network. Girvan–Newman algorithm is used to hierarchically cluster the network into communities based on the property of Edge-Betweenness. Deduced communities are mapped onto the structure to gain a visual assessment of amino acid dynamics.
FIG. 5.
FIG. 5.
The conserved kinase domain. The catalytic domain of protein kinase A (PKA) includes a kinase core flanked by two tails: the N-terminal tail and the C-terminal tail. The kinase core is a signature of the eukaryotic kinase superfamily and has a characteristic bi-lobal structure. ATP binds in the cleft between the two lobes while the substrate peptide binding region is localized to the C-lobe. Two lobes of the kinase core are connected by a network of hydrophobic residues assembled into two “spines.”
FIG. 6.
FIG. 6.
Community map analysis explains the dynamics-based role of inactivating mutations and substrate recognition in PKA. (a) Functional roles assigned to PKA communities based on biochemical/biophysical experiments. (b) Distinct community networks obtained for the Y204A mutation when compared with WT PKA reveals the changing of communities in the C-lobe. Specifically, changes in community E and F explain the loss of synchronization of ATP and peptide at the PKA active site. (b) Community-based segregation of dynamics in the active site of PKA is distinct for an inhibitor peptide (PKI) when compared with a substrate (PKS). PKI tightly binds the kinase (as known by experiments) by engaging with its D and F communities. PKS only engages with community F with all catalytic residues including in the same community. Figure adapted from our earlier manuscripts.
FIG. 7.
FIG. 7.
Community map analysis of the ternary complex of PKA:ATP(Mg2+):Inhibitor peptide reveals distinct dynamic footprints. Peptides derived from the inhibitory segments of three PKA interacting proteins (PKI, Riα, and RIIβ) break connections between the catalytic residue supporting communities D and E. Community H is strengthened by information flow from associated community C. Figure adapted from our earlier manuscript.

Similar articles

Cited by

References

    1. Taylor S. S., Keshwani M. M., Steichen J. M., and Kornev A. P., “Evolution of the eukaryotic protein kinases as dynamic molecular switches,” Philos. Trans. R. Soc., B 367(1602), 2517–2528 (2012).10.1098/rstb.2012.0054 - DOI - PMC - PubMed
    1. Nussinov R. and Tsai C.-J., “Allostery in disease and in drug discovery,” Cell 153(2), 293–305 (2013).10.1016/j.cell.2013.03.034 - DOI - PubMed
    1. Ahuja L. G., Kornev A. P., McClendon C. L., Veglia G., and Taylor S. S., “Mutation of a kinase allosteric node uncouples dynamics linked to phosphotransfer,” Proc. Natl. Acad. Sci. U. S. A. 114(6), E931–E940 (2017).10.1073/pnas.1620667114 - DOI - PMC - PubMed
    1. Jura N., Zhang X., Endres N. F., Seeliger M. A., Schindler T., and Kuriyan J., “Catalytic control in the EGF receptor and its connection to general kinase regulatory mechanisms,” Mol. Cell 42(1), 9–22 (2011).10.1016/j.molcel.2011.03.004 - DOI - PMC - PubMed
    1. Schamel W. W. A., Alarcon B., Höfer T., and Minguet S., “The allostery model of TCR regulation,” J. Immunol. 198(1), 47–52 (2017).10.4049/jimmunol.1601661 - DOI - PubMed