. 2023 Mar 1;8(1):92.
doi: 10.1038/s41392-023-01347-1.

Targeting p53 pathways: mechanisms, structures, and advances in therapy

Affiliations

Targeting p53 pathways: mechanisms, structures, and advances in therapy

Haolan Wang et al. Signal Transduct Target Ther. .

Abstract

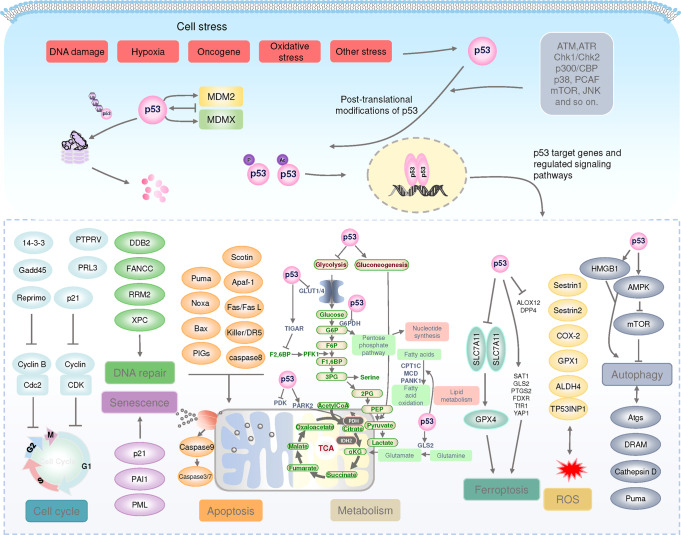
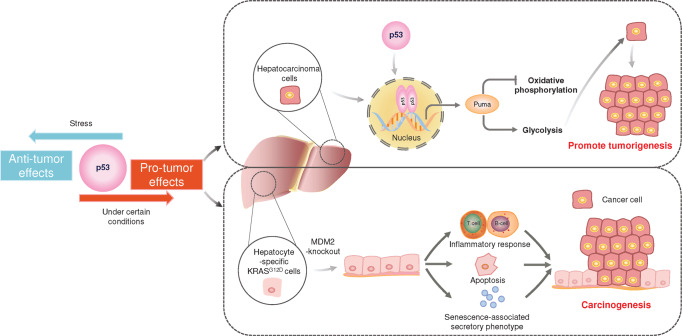
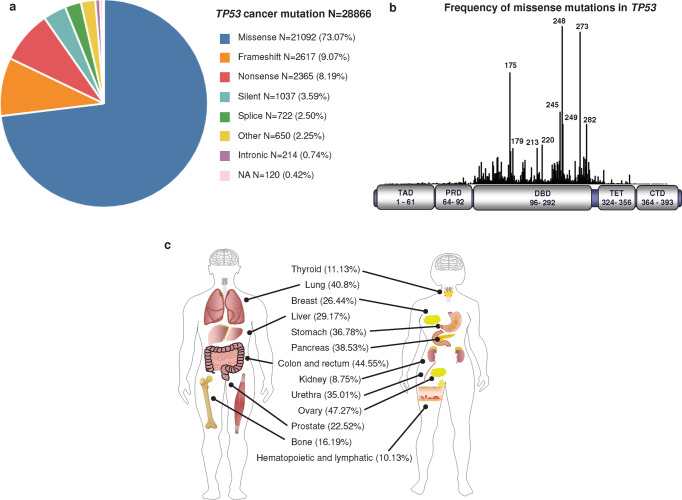
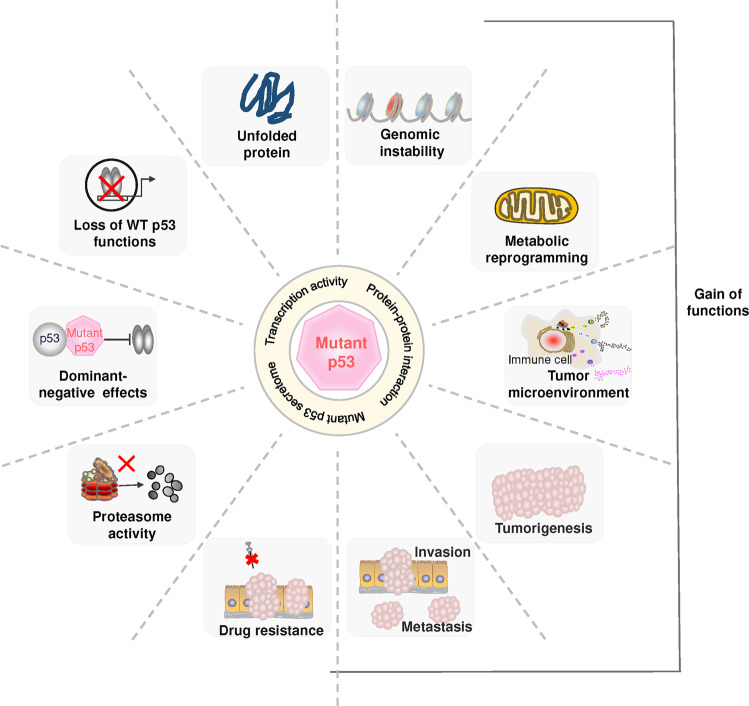
The TP53 tumor suppressor is the most frequently altered gene in human cancers, and has been a major focus of oncology research. The p53 protein is a transcription factor that can activate the expression of multiple target genes and plays critical roles in regulating cell cycle, apoptosis, and genomic stability, and is widely regarded as the "guardian of the genome". Accumulating evidence has shown that p53 also regulates cell metabolism, ferroptosis, tumor microenvironment, autophagy and so on, all of which contribute to tumor suppression. Mutations in TP53 not only impair its tumor suppressor function, but also confer oncogenic properties to p53 mutants. Since p53 is mutated and inactivated in most malignant tumors, it has been a very attractive target for developing new anti-cancer drugs. However, until recently, p53 was considered an "undruggable" target and little progress has been made with p53-targeted therapies. Here, we provide a systematic review of the diverse molecular mechanisms of the p53 signaling pathway and how TP53 mutations impact tumor progression. We also discuss key structural features of the p53 protein and its inactivation by oncogenic mutations. In addition, we review the efforts that have been made in p53-targeted therapies, and discuss the challenges that have been encountered in clinical development.


Conflict of interest statement

The authors declare no competing interests.

Figures

Fig. 1
Fig. 1
Timeline of some major advances in p53 research
Fig. 2
Fig. 2
The p53 pathway. Under normal conditions, p53 protein levels are tightly regulated by MDM2/X, which together ubiquitinate p53, leading to proteasomal degradation of p53. Under stress conditions, p53 is activated and stabilized by post-translational modifications. Stabilized p53 forms tetramers in the nucleus, binds to target DNA, regulates gene transcription, and controls many different biological processes. ALDH4 aldehyde dehydrogenase family 4 member A1, ALOX12 arachidonate-12-lipoxygenase, AMPK 5′-AMP-activated protein kinase, APAF1 apoptotic protease-activating factor 1, Atgs autophagy-related genes, ATM ataxia-telangiectasia mutated proteins, ATR ataxia telangiectasia and Rad3-related, BAX apoptosis regulator BAX, CDC cell division cycle, CDK cyclin-dependent kinase, COX-2 cyclooxygenase-2 (also known as PTGS2), CPT1C carnitine palmitoyltransferase 1C, Cyt C Cytochrome C, DDB2 damage specific DNA binding protein 1, DPP4 dipeptidyl peptidase-4, DRAM damage regulated autophagy modulator 2, FANCC fanconi anemia group C protein, FDXR ferredoxin reductase, GADD45 growth arrest and DNA damage-inducible 45, GLS2 glutaminase 2, GLUT glucose transporter type, GPX glutathione peroxidase, G6PDH glucose‑6‑phosphate (G-6‑P) dehydrogenase, HMGB1 high-mobility group box-1, MCD malonyl-coenzyme A decarboxylase, mTOR mammalian target of rapamycin, NOXA superoxide-generating NADPH oxidase, PAI1 plasminogen activator inhibitor 1, PANK1 pantothenate kinase 1, PDK PDH kinase, PIGs p53-induced gene, PML promyelocytic leukemia protein, PRL3 phosphatase of regenerating liver-3, PTPRV protein tyrosine phosphatase receptor type V, PUMA Bcl-2-binding component 3, ROS reactive oxygen species, RRM2 ribonucleoside-diphosphate reductase subunit M2, SAT1 spermine N1-acetyltransferase 1, SLC7A11 solute carrier family7 member11, TFR1 transferrin receptor 1, TIGAR TP53-induced glycolysis and apoptosis regulator, TP53INP1 tumor protein p53 inducible nuclear protein 1, XPC xeroderma pigmentosum group C protein, YAP1 yes-associated protein 1
Fig. 3
Fig. 3
Pro-tumor effect of p53. In general, p53 is thought to have tumor suppressive effects, but in some cases, p53 promotes tumor growth. In hepatocellular carcinoma cells, p53 transcription activates the expression of Puma, which causes shift in mitochondrial energy metabolism from oxidative phosphorylation to glycolysis, thereby promoting tumorigenesis. In hepatocyte-specific KRASG12D cells knockout of MDM2 to activate p53. Accumulated p53 increased inflammatory responses, hepatocyte apoptosis, and senescence-associated secretory phenotypes that promote carcinogenesis
Fig. 4
Fig. 4
TP53 mutations in cancer. a Frequency of somatic TP53 mutations associated with different types of cancer. b Frequency of missense mutations in TP53 (https://tp53.isb-cgc.org/). c Mutation frequency of TP53 in different tissues and organs
Fig. 5
Fig. 5
The role of mutant p53 in cancer. Mutant p53 can result in loss-of-function of wild-type p53, dominant-negative repression of wild-type p53 by mutant p53, and gain-of-function with oncogenic properties. Mutant p53 affects various cellular responses, such as genomic instability, metabolic reprogramming, and tumor microenvironment, and promotes cancer cell proliferation, invasion, metastasis and drug resistance. WT wild-type
Fig. 6
Fig. 6
TAD binds to partner proteins and regulates transcription. a MDM2/MDMX is the major negative regulator of p53, and the C-terminus of MDM2 has E3 ubiquitin ligase activity (Ub) that promotes p53 degradation. b Under cellular stress conditions, the acetyl group (Ac) is added to the lysine residue of p53-CTD, and p53 binds to the target DNA sequence and interacts with the coactivator CBP or p300 to jointly promote gene transcription. c DNA damage and other stresses induce p53 phosphorylation (P) and binding to TFIIH, which stabilizes p53 and promotes DNA binding and transcription. p53-TAD shown as cartoon. Partner proteins are shown as surfaces
Fig. 7
Fig. 7
Structures of DBD, TET, CTD and full-length p53. a The structure of DBD in complex with a sequence-specific DNA (PDB: 1TSR). p53-DBD is shown as a cartoon, and the secondary structures are labeled. The interfacial residues are shown as sticks. DNA is shown as sticks and surfaces. b DNA recognition by the p53 tetramer (PDB: 3KMD). c ASPP2 (colored aquamarine). d iASPP (colored pale green). e 53BP1 (colored pink). f NMR structural model of the p53-DBD/BCL-xL complex. g Crystal structure of the p53-DBD/BCL-xL complex. BCL-xL is colored marine. h LTag (colored light blue). i E6/E6AP. E6 is colored light pink. E6AP is colored pale yellow. All p53-DBD molecules are shown as the surface. j Assembly of the p53 tetramerization domain (PDB: 1C26). k CTD sequence. The posttranscriptional modifications are shown as indicated. l A CTD peptide (colored light magenta) became a helical conformation when bound to Ca2+-loaded S100B(ββ) (colored pale cyan and pale green). m A CTD peptide dimethylated at K382 (p53K382me2) binds the tandem Tudor domain (TTD) of 53BP1 (colored yellow) in a U-shape conformation. n A p53 peptide acetylated at K381 and dimethylated at K382 (p53K381acK382me2) forms a helical conformation when interacting with 53BP1-TTD. o A p53K382ac peptide forms β sheet-like contacts with deacetylase Sir2-Af2 (colored light blue). p Structure of the p53/RNA polymerase II assembly. RNA polymerase II assembly is shown as surface. p53 is shown as cartoon. q Full-length p53 structure predicted by AlphaFold2. TAD colored pink, PRD colored green, DBD colored marine, Loop colored yellow, TET colored warm pink, and CTD colored cyan
Fig. 8
Fig. 8
Structure of MDM2/X with small molecules. a Overlay of the crystal structures of MDM2/p53-TAD (white, sky blue), MDMX/p53-TAD (greencyan, pink) and the three residues of p53-TAD (F19, W23, L26) are shown as sticks. b MDM2 is shown as a surface. c MDMX is shown as surface. d MDM2/RG7112 (PDB: 4IPF). e MDM2/RG7388 (PDB: 4JRG). f MDM2/AMG 232 (PDB: 4OAS). g MDM2/MI-77301 (PDB: 5TRF). h MDM2/NVP-CGM097 (PDB: 4ZYF). Water molecules are red spheres, and hydrogen bonds are black lines. The interacting amino acid residues are shown as sticks (colored gray)
Fig. 9
Fig. 9
Compounds targeting cysteine in p53-DBD. a The amino acid sequence and structure of p53-DBD, cysteine is highlighted and labeled, p53 tetramers are labeled as (ad), respectively and cysteines are shown as sticks. b MQ bound to C124, C229 and C277 in p53-R282W-DNA tetramers. The MQ conjugates are in stick representation (green). c Structure of p53-bound arsenic and zinc ions. d Structure of p53-bound antimony and zinc ions. The interacting amino acid residues are shown as sticks
Fig. 10
Fig. 10
Structure of the p53 mutant Y220C with small molecules. a p53-WT surface (PDB: 3KMD). b p53-Y220C surface (PDB: 2VUK). c p53-Y220C/Phikan083 (PDB: 2VUK). d p53-Y220C/Phikan5196 (PDB: 4AGQ). e p53-Y220C/PK7242 (PDB: 3ZME). f p53-Y220C/Compound9 (PDB: 5AOJ). g p53-Y220C/Compound6 (PDB: 5G4O). h p53-Y220C/MB710 (PDB: 5O1I). i p53-Y220C/PK9318 (PDB: 6GGB). Water molecules are red spheres, and hydrogen bonds are black lines. The interacting amino acid residues are shown as sticks (colored greencyan)
Fig. 11
Fig. 11
Targeting p53 aggregation. p53-DBD has an amyloid-forming segment, LTIITLE, that forms Mutant p53 aggregates. ReAcp53, ADH-6 and LI inhibit p53 aggregation and restore the conformation and function of p53
Fig. 12
Fig. 12
Antibody drugs against p53. a Structure of the Nb139/p53-DBD complex. p53-DBD shown as cartoon/surface (colored pink). Nb139 shown as cartoon (colored marine). b Mechanism of action and structure of the bispecific antibody H2-scDb. H2-scDb is a bispecific antibody that recognizes the p53R175H mutant peptide presented on the cell surface by HLA-A and binds to the T-cell receptor, activating T cells and releasing cytokines to kill tumor cells. The interacting amino acid residues are shown as sticks. Hydrogen bonds as black lines

References

    1. Kastenhuber, E. R. & Lowe, S. W. Putting p53 in context. Cell170, 1062–1078 (2017). 10.1016/j.cell.2017.08.028 - DOI - PMC - PubMed
    1. Levine, A. J. p53: 800 million years of evolution and 40 years of discovery. Nat. Rev. Cancer20, 471–480 (2020). 10.1038/s41568-020-0262-1 - DOI - PubMed
    1. ICGC/TCGA Pan-Cancer Analysis of Whole Genomes Consortium. Pan-cancer analysis of whole genomes. Nature. 578, 82–93 (2020).
    1. Lawrence, M. S. et al. Discovery and saturation analysis of cancer genes across 21 tumour types. Nature505, 495–501 (2014). 10.1038/nature12912 - DOI - PMC - PubMed
    1. Bykov, V. J. N., Eriksson, S. E., Bianchi, J. & Wiman, K. G. Targeting mutant p53 for efficient cancer therapy. Nat. Rev. Cancer.18, 89–102 (2018). 10.1038/nrc.2017.109 - DOI - PubMed

Publication types

Substances