. 2023 Mar 2;17(1):17.
doi: 10.1186/s40246-023-00454-y.

Computational network analysis of host genetic risk variants of severe COVID-19

Affiliations

Computational network analysis of host genetic risk variants of severe COVID-19

Sakhaa B Alsaedi et al. Hum Genomics. .

Abstract

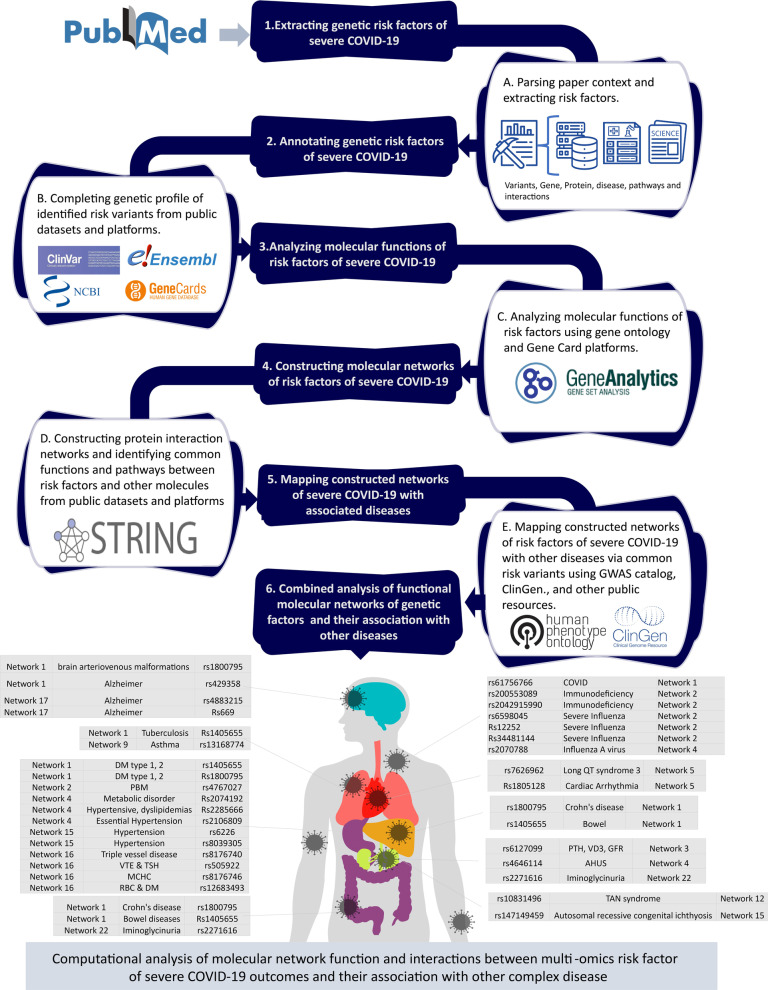
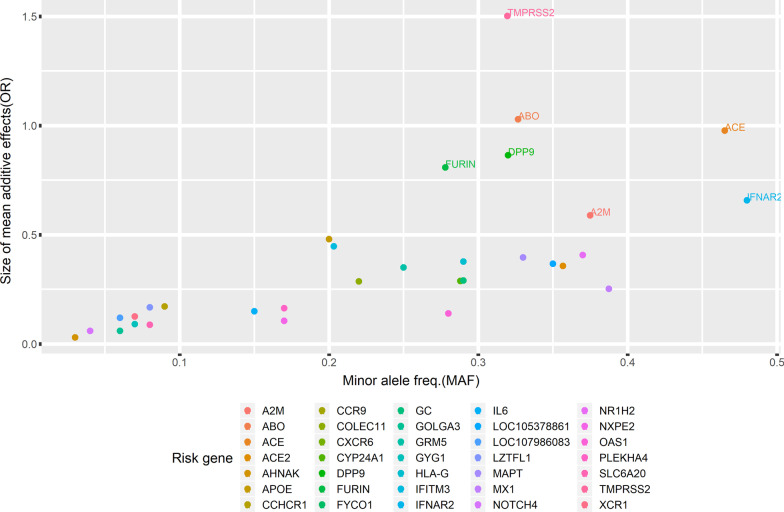
Background: Genome-wide association studies have identified numerous human host genetic risk variants that play a substantial role in the host immune response to SARS-CoV-2. Although these genetic risk variants significantly increase the severity of COVID-19, their influence on body systems is poorly understood. Therefore, we aim to interpret the biological mechanisms and pathways associated with the genetic risk factors and immune responses in severe COVID-19. We perform a deep analysis of previously identified risk variants and infer the hidden interactions between their molecular networks through disease mapping and the similarity of the molecular functions between constructed networks.

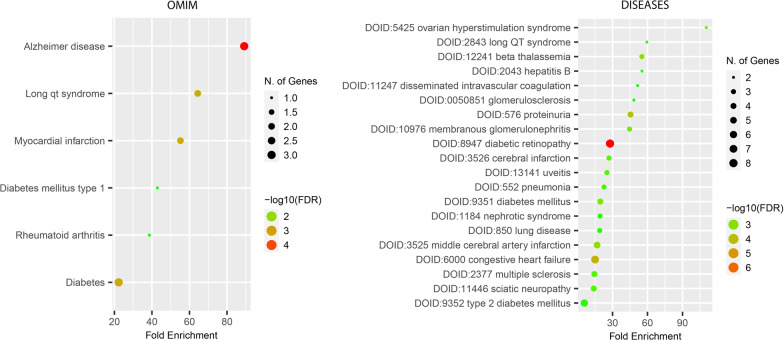
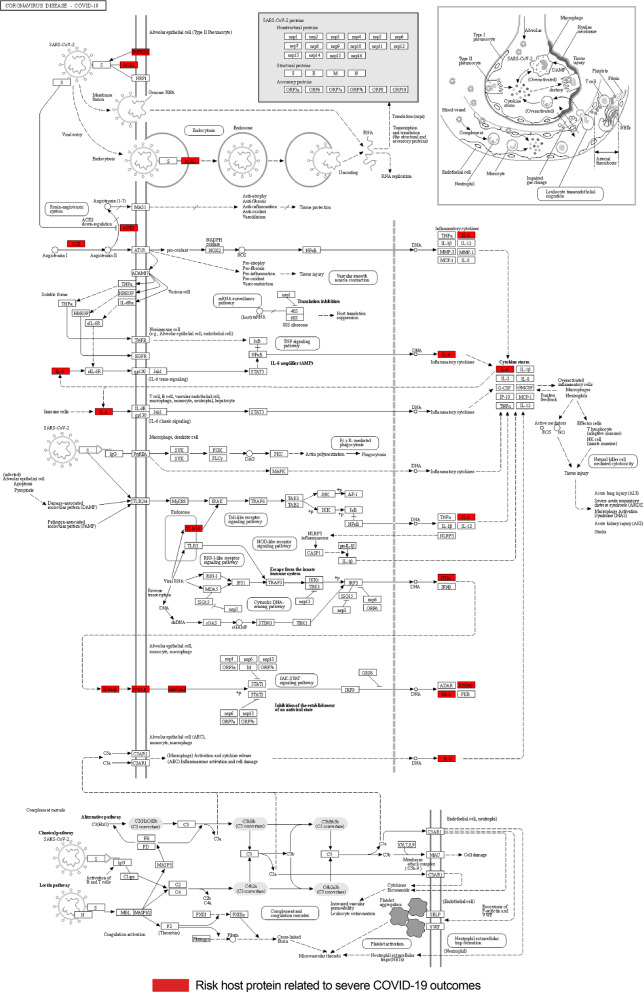
Results: We designed a four-stage computational workflow for systematic genetic analysis of the risk variants. We integrated the molecular profiles of the risk factors with associated diseases, then constructed protein-protein interaction networks. We identified 24 protein-protein interaction networks with 939 interactions derived from 109 filtered risk variants in 60 risk genes and 56 proteins. The majority of molecular functions, interactions and pathways are involved in immune responses; several interactions and pathways are related to the metabolic and cardiovascular systems, which could lead to multi-organ complications and dysfunction.

Conclusions: This study highlights the importance of analyzing molecular interactions and pathways to understand the heterogeneous susceptibility of the host immune response to SARS-CoV-2. We propose new insights into pathogenicity analysis of infections by including genetic risk information as essential factors to predict future complications during and after infection. This approach may assist more precise clinical decisions and accurate treatment plans to reduce COVID-19 complications.

Keywords: Disease mapping; GWAS; Genetic risk factor analysis; Host risk variants; Molecular networks analysis; Severe COVID-19; Statistical analysis.


Conflict of interest statement

The authors declare that they have no competing interests.

Figures

Fig. 1
Fig. 1
Flow diagram of the study overview. (A) The first step: extracting genetic risk factors of severe COVID-19, by parsing articles and extracting risk factors. such as Variants, Genes, proteins, related diseases, pathways, and interactions. (B) The second step: annotating the genetic risk factors of severe COVID-19 to complete the genetic profiles of identified risk variants from public datasets and platforms. (C) The third step: analyzing molecular functions of risk factors of severe COVID-19 using gene ontology and Gene Card platforms. (D) The fourth step: constructing molecular networks and identifying functions and pathways between risk factors and other molecules from public datasets and platforms. (E) The fifth step: mapping constructed networks of severe COVID-19 with other diseases via shared risk variants using GWAS catalog, ClinGen., and other public resources
Fig. 2
Fig. 2
Chromosomal loci and functional consequences of the 109 genetic risk variants. Autosomal loci of the 60 risk genes associated with severe COVID-19: each dot represents a risk variant, and the dots in the same horizontal line represent the same risk variant but in different genes. The colors of the dots represent risk genes
Fig. 3
Fig. 3
The additive effects of common risk variants on severe COVID-19 outcome per genes. The scatter plot shows the additive effects of common risk variants on severe COVID-19 outcomes per gene. Each point corresponds to the additive effect of the risk gene that has been calculated based on cumulative values of reported ORs and MAF. Each gene hosts at least one reported risk variant
Fig. 4
Fig. 4
Distribution of functional consequences of the 109 genetic risk variants in the human genome. The height of each bar represents the total number of risk variants in genetic regions, and the light gray color illustrates the number of risk variants associated with other diseases
Fig. 5
Fig. 5
Risk gene set enrichment analysis of the 60 risk genes related to severe COVID-19. A The top ten ranked gene expression scores in human normal tissues and systems: the vertical axes represent the top ten systems based on ranked scores. Each bar represents a system, and the slots inside the bar represent the percentage of the risk genes expressed in various human tissues or cells based on the ranked gene expression scores. The horizontal axes represent the ranked score from 0 to 5. B The top ten human compartments and tissues with the highest numbers of enriched risk genes based on gene ontology analysis
Fig. 6
Fig. 6
Gene set and disease analysis of the 60 risk genes related to the severity of COVID-19 outcomes. The top diseases were mapped to the risk genes based on the OMIM and Alliance-DISEASES databases. The circle size represents the number of genes associated with the disease, and the range of colors (high-significant level: red, low-significant level: green) represents the FDR scores for the disease associations
Fig. 7
Fig. 7
GO enrichment analyses of the 56 risk proteins related to severe COVID-19 outcomes. A The top ten significant biological processes and hierarchical correlation clustering trees of the biological processes enriched with the risk proteins. B The top ten significant molecular functions and hierarchical correlation clustering trees of the molecular functions enriched with the risk proteins. C The top ten significant cellular components and hierarchical correlation clustering trees of the cellular components enriched with the risk proteins
Fig. 8
Fig. 8
Molecular networks of the 56 risk proteins mapped with the 109 risk variant-disease associations. The red nodes represent COVID-19 risk proteins. The gray nodes represent human proteins that interact with risk proteins. A Twenty-four connected networks. Each connected network has at least one interaction with another protein. Networks 1 to 3 contain more than one risk protein, and Networks 4 to 22 are isolated networks has one risk protein. B Seven orphan risk proteins did not have any protein interaction with other human proteins. The dashed lines link risk variants with linked networks. The different colors of squares illustrate the disease mapping based on the risk variant-disease mapping and the similarity of the molecular functions between the constructed networks
Fig. 9
Fig. 9
Molecular pathways between the 16 genetic risk proteins of severe COVID-19 in Network 1. The top ten significant molecular pathways between the genetic risk proteins and other host proteins are mainly connected to the host immune system. Network 1 is the largest network and contains the highest number of risk proteins compared to other networks
Fig. 10
Fig. 10
Overview of the molecular pathways of the risk proteins in the constructed networks related to the host metabolic, cardiovascular, and other systems. The figure demonstrates the significant pathways related to severe COVID-19 outcomes. More details of the remaining constructed networks are provided in Additional file 4
Fig. 11
Fig. 11
Host-SARS-CoV-2 pathogen interaction pathway in COVID-19. The location of the 56 genetic risk proteins in the main molecular pathway involved in the host response to SARS-CoV-2 derived from KEEG database. The proteins involved in this pathway are components of different constructed molecular networks, such as Network 1, 3, and 20
Fig. 12
Fig. 12
Computational network analysis workflow. The four-stage implemented workflow: (A) data curation and annotation, (B) functional enrichment analysis of risk factors, (C) molecular network construction and integration of risk factors, and (D) molecular network analysis and mapping

References

    1. Wang H, Li X, Li T, Zhang S, Wang L, Wu X, Liu J. The genetic sequence, origin, and diagnosis of SARS-CoV-2. Eur J Clin Microbiol Infect Dis. 2020;39(9):1629–1635. doi: 10.1007/s10096-020-03899-4. - DOI - PMC - PubMed
    1. Shi Y, Wang G, Cai X-P, Deng J-W, Zheng L, Zhu H-H, Zheng M, Yang B, Chen Z. An overview of COVID-19. J Zhejiang Univ Sci B. 2020;21(5):343–360. doi: 10.1631/jzus.B2000083. - DOI - PMC - PubMed
    1. Hu J, Li C, Wang S, Li T, Zhang H. Genetic variants are identified to increase risk of COVID-19 related mortality from UK biobank data. Hum Genomics. 2021;15(1):1–10. doi: 10.1186/s40246-021-00306-7. - DOI - PMC - PubMed
    1. Ramos-Lopez O, Daimiel L, Ramírez de Molina A, Martínez-Urbistondo D, Vargas JA, Martínez JA. Exploring host genetic polymorphisms involved in SARS-CoV infection outcomes: Implications for personalized medicine in COVID-19. Int J Genomics 2020;2020. - PMC - PubMed
    1. Butler-Laporte G, Nakanishi T, Mooser V, Morrison DR, Abdullah T, Adeleye O, Mamlouk N, Kimchi N, Afrasiabi Z, Rezk N, et al. Vitamin D and COVID-19 susceptibility and severity in the COVID-19 host genetics initiative: a mendelian randomization study. PLoS Med. 2021;18(6):1003605. doi: 10.1371/journal.pmed.1003605. - DOI - PMC - PubMed

Publication types