. 2023 Mar 1;14(1):1167.
doi: 10.1038/s41467-023-36818-0.

Linoleic acid improves PIEZO2 dysfunction in a mouse model of Angelman Syndrome

Affiliations

Linoleic acid improves PIEZO2 dysfunction in a mouse model of Angelman Syndrome

Luis O Romero et al. Nat Commun. .

Abstract

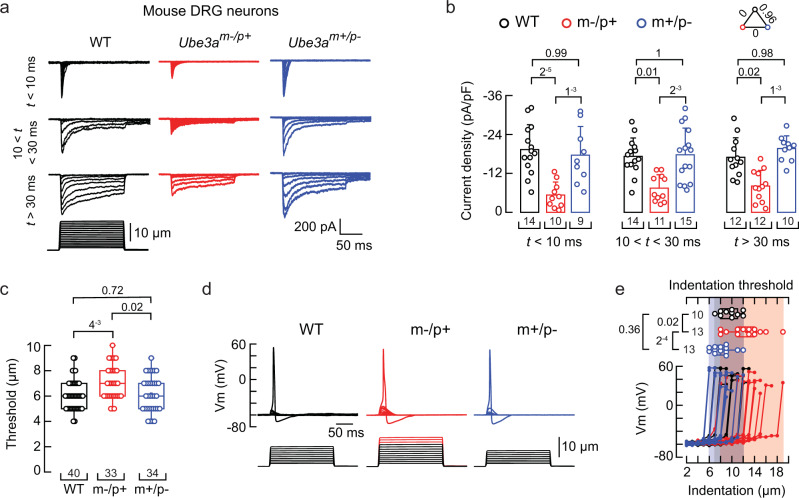
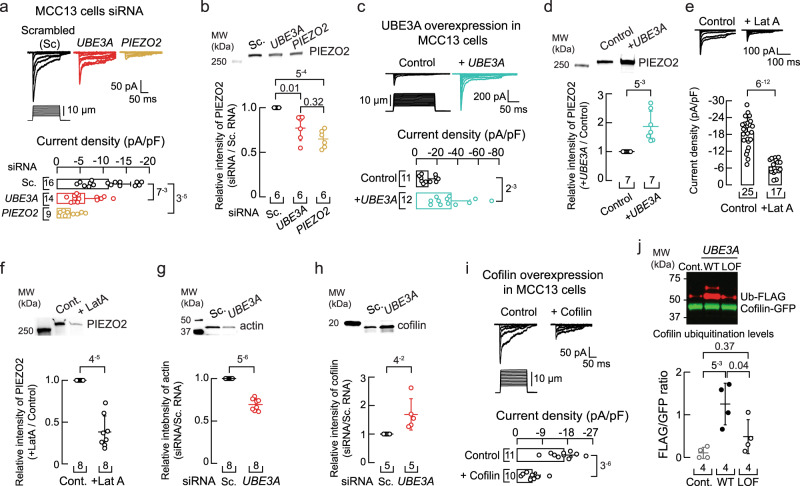
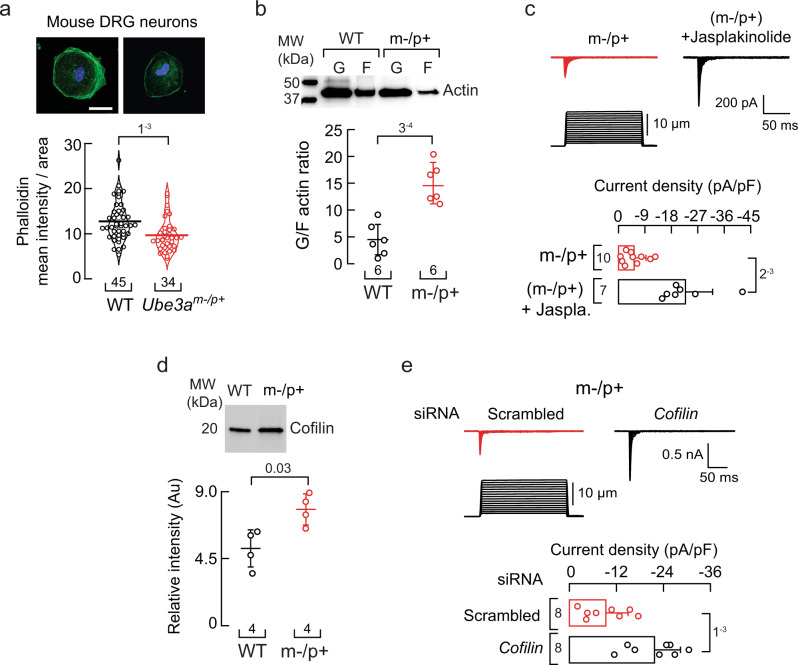
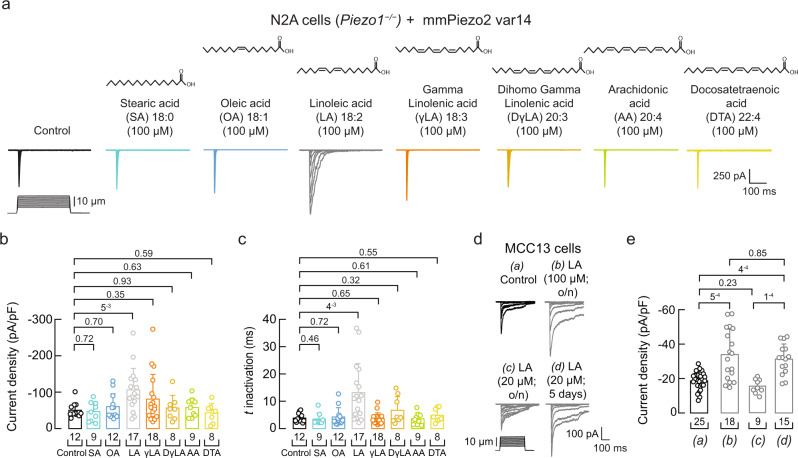
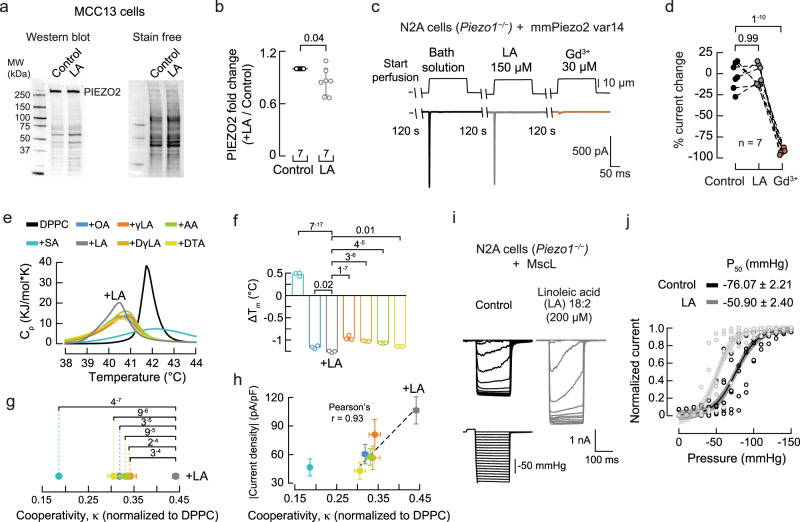
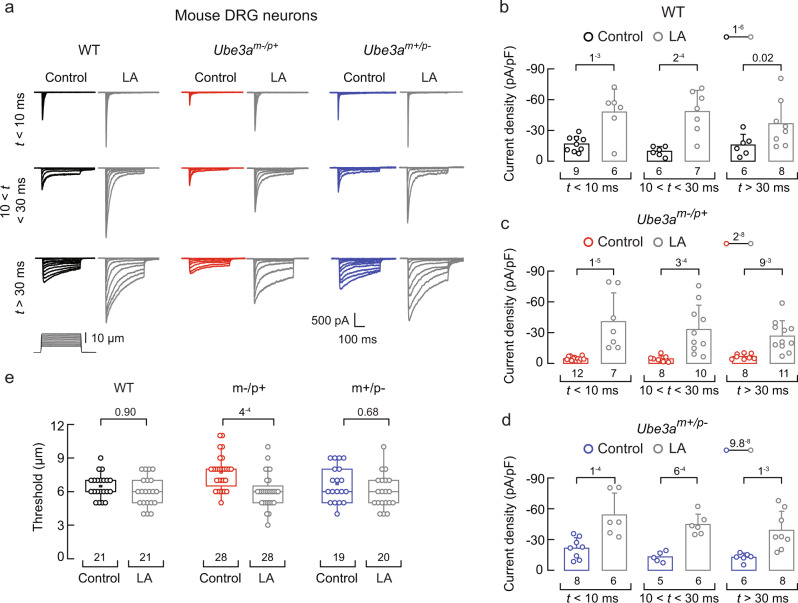
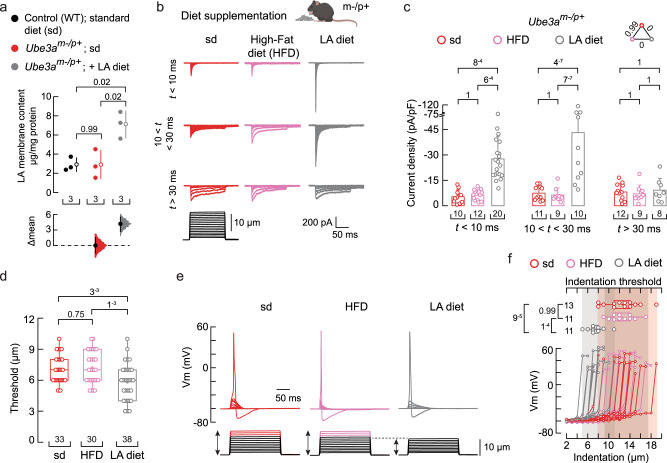
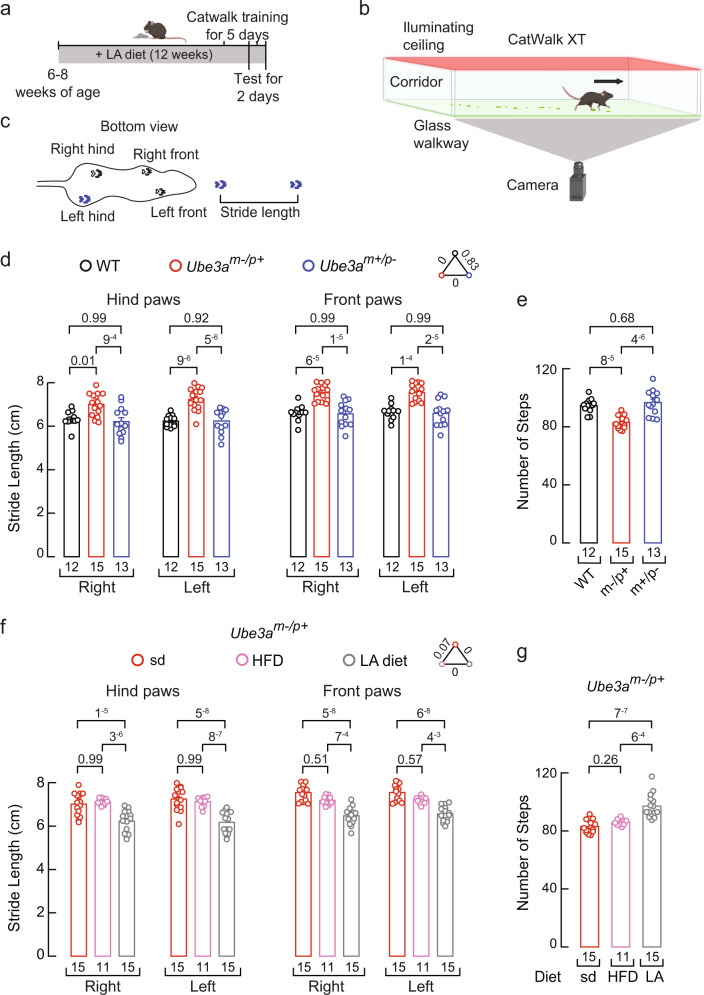
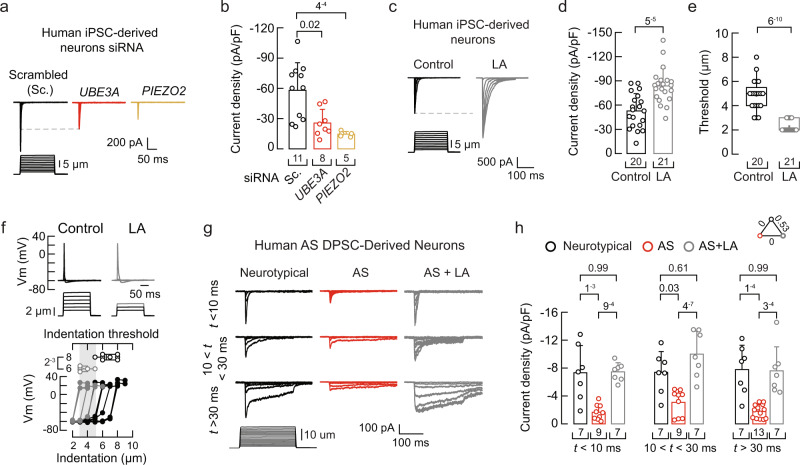
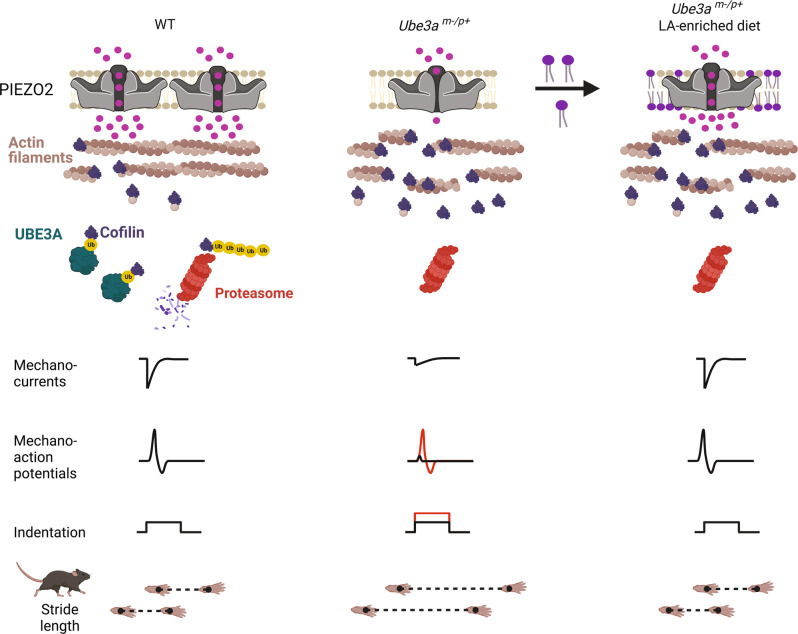
Angelman syndrome (AS) is a neurogenetic disorder characterized by intellectual disability and atypical behaviors. AS results from loss of expression of the E3 ubiquitin-protein ligase UBE3A from the maternal allele in neurons. Individuals with AS display impaired coordination, poor balance, and gait ataxia. PIEZO2 is a mechanosensitive ion channel essential for coordination and balance. Here, we report that PIEZO2 activity is reduced in Ube3a deficient male and female mouse sensory neurons, a human Merkel cell carcinoma cell line and female human iPSC-derived sensory neurons with UBE3A knock-down, and de-identified stem cell-derived neurons from individuals with AS. We find that loss of UBE3A decreases actin filaments and reduces PIEZO2 expression and function. A linoleic acid (LA)-enriched diet increases PIEZO2 activity, mechano-excitability, and improves gait in male AS mice. Finally, LA supplementation increases PIEZO2 function in stem cell-derived neurons from individuals with AS. We propose a mechanism whereby loss of UBE3A expression reduces PIEZO2 function and identified a fatty acid that enhances channel activity and ameliorates AS-associated mechano-sensory deficits.


Conflict of interest statement

P.W. and V.T. are employees and shareholders of Anatomic Incorporated. There are no other competing interests.

Figures

Fig. 1
Fig. 1. Ube3am–/p+ DRG neurons display reduced mechano-currents and -excitability.
a Representative whole-cell patch-clamp recording elicited by mechanical stimulation (−60 mV) of rapidly, intermediate, and slowly inactivating currents of WT, Ube3am–/p+, and Ube3am+/p– DRG neurons. b Current densities elicited by maximum displacement of DRG neurons classified by their time constant of inactivation. Bars are mean ± SD. Two-way ANOVA (F = 35.44, p = 2.63−12) and Tukey multiple-comparisons test. c Boxplots show the displacement thresholds required to elicit mechanocurrents of DRG neurons. Boxplots show mean (square), median (bisecting line), bounds of box (75th to 25th percentiles), outlier range with 1.5 coefficient (whiskers), and minimum and maximum data points. Kruskal-Wallis (H = 9.51; p = 0.0086) and Dunn’s multiple comparisons test. d Representative current-clamp recordings of membrane potential changes elicited by mechanical stimulation in DRG neurons. e Membrane potential peak vs. mechanical indentation of independent mouse DRG neurons. At the top, boxplots show the displacement threshold required to elicit an action potential in these neurons. Boxplots show mean (square), median (bisecting line), bounds of box (75th to 25th percentiles), outlier range with 1.5 coefficient (whiskers), and minimum and maximum data points. One-way ANOVA (F = 10.54; p = 2.89−4) and Tukey multiple-comparisons test. n is denoted in each panel. Post hoc p values are denoted in the corresponding panels. Source data are provided as a Source Data file.
Fig. 2
Fig. 2. UBE3A knockdown increases cofilin and decreases F-actin content and PIEZO2 function.
a Top, representative whole-cell patch-clamp recordings of currents elicited by mechanical stimulation (−60 mV) in MCC13 cells transfected with scrambled, UBE3A, or PIEZO2 siRNAs. Bottom, current densities elicited by maximum displacement of siRNA-transfected cells. Bars are mean ± SD. Kruskal-Wallis (H = 18.76; p = 8.4−5) and Dunn’s multiple comparisons test. b Top, western blot (anti-PIEZO2) of the membrane fractions of MCC13 cells transfected as in (a). Bottom, mean/scatter-dot plot showing relative intensities of PIEZO2 protein normalized to PIEZO2 in the Sc. group. Lines are mean ± SD. Kruskal-Wallis (H = 12.78; p = 0.0017) and Dunn’s multiple comparisons test. c Top, currents elicited by mechanical stimulation (−60 mV) in cells transfected with UBE3A plasmid. Bottom, current densities elicited by maximum displacement of UBE3A transfected cells. Bars are mean ± SD. Two-tailed unpaired t-test with Welch’s correction (t = 3.9). d Top, western blot (anti-PIEZO2) of the membrane fractions of MCC13 cells transfected with UBE3A plasmid. Bottom, mean/scatter-dot plot showing relative intensities of PIEZO2 protein in UBE3A transfected cells normalized to PIEZO2 in the control group. Lines are mean ± SD. Two-tailed one-sample t-test (t = 4.4). e Top, currents elicited by mechanical stimulation (−60 mV) of latrunculin A (1 µM; 24 h)-treated MCC13 cells. Bottom, current densities elicited by maximum displacement. Bars are mean ± SD. Two-tailed unpaired t-test with Welch’s correction (t = 9.9). f Top, western blot (anti-PIEZO2) of the membrane fractions of MCC13 cells treated as in (e). Bottom, mean/scatter-dot plot showing relative intensities of PIEZO2 protein normalized to PIEZO2 in the control group. Lines are mean ± SD. Two-tailed one-sample t-test (t = −9.1). g Top, western blot (anti-actin) of the cytoskeletal fractions of MCC13 transfected with scrambled (Sc.) or UBE3A siRNAs. Bottom, mean/scatter-dot plot showing relative intensities of actin protein normalized to actin in the Sc. group. Lines are mean ± SD. Two-tailed one-sample t-test (t = −12.5). h Top, western blot (anti-cofilin) of the cytosolic fractions of MCC13 transfected as in (g). Bottom, mean/scatter-dot plot showing relative intensities of cofilin protein normalized to cofilin in the Sc. group. Lines are mean ± SD. Two-tailed one-sample t-test (t = 2.8). i Top, currents elicited by mechanical stimulation (−60 mV) in MCC13 cells transfected with cofilin plasmid. Bottom, current densities elicited by maximum displacement of cofilin transfected cells. Bars are mean ± SD. Two-tailed unpaired t-test with Welch’s correction (t = 6.8). j Top, western blot of pulldown GFP-tagged cofilin from HEK293T cells transfected with a control vector (Ctrl), wild-type UBE3A (WT), or a catalytically inactive UBE3A (LOF). The ubiquitinated (Ub) fraction (red) was monitored with an anti-FLAG antibody. Bottom, mean/scatter-dot plot showing Ub-FLAG/Cofilin-GFP ratios. Lines are mean ± SD. One-way ANOVA (F = 9.86; p = 0.0054) and Tukey multiple-comparisons test. n is denoted in each panel. Post hoc p-values are denoted in the corresponding panels. Source data are provided as a Source Data file.
Fig. 3
Fig. 3. Ube3am–/p+ DRG neurons display reduced F-actin and jasplakinolide treatment increases PIEZO2 currents.
a Top, representative micrographs of cultured WT and Ube3am–/p+ DRG neurons fixed and stained with phalloidin (green) and DAPI (blue). Scale bar 20 µm. Bottom, phalloidin mean intensity normalized by the neuron’s area is depicted as a violin plot with the means shown as horizontal bars. Two-tailed unpaired t-test (t = 3.41). b Top, western blot of soluble and insoluble actin (G and F, respectively) of WT and Ube3am–/p+ DRGs. Bottom, mean/scatter-dot plot showing G/F actin ratios. Lines are mean ± SD. Two-tailed unpaired t-test (t = 5.43). c Top, representative whole-cell patch-clamp recordings of PIEZO2 currents elicited by mechanical stimulation (−60 mV) of control and jasplakinolide (0.5 µM; 18 h)-treated Ube3am–/p+ DRG neurons. Bottom, current densities elicited by maximum displacement. Bars are mean ± SD. Two-tailed unpaired t-test with Welch’s correction (t = 4.68). d Top, representative western blot (anti-cofilin) of the cytosolic fractions of WT and Ube3am–/p+ DRGs. Bottom, mean/scatter-dot plot showing relative intensities of cofilin content. Lines are mean ± SD. Two-tailed Mann-Whitney test (U = 0). e Top, representative whole-cell patch-clamp recordings of currents elicited by mechanical stimulation (−60 mV) of Ube3am–/p+ DRG neurons transfected with scrambled or cofilin siRNAs. Bottom, current densities elicited by maximum displacement of siRNA-transfected Ube3am–/p+ DRGs. Bars are mean ± SD. Two-tailed unpaired t-test (t = 4.02). n is denoted in each panel. Post-hoc p-values are denoted in the corresponding panels. Source data are provided as a Source Data file.
Fig. 4
Fig. 4. LA increases PIEZO2 activity in Piezo1–/– N2A and MCC13 cells.
a Representative whole-cell patch-clamp recordings of currents elicited by mechanical stimulation (−60 mV) in control, SA, OA, LA, γLA, DγLA, AA, and DTA (100 µM; 24 h)-treated Piezo1–/– N2A cells transfected with Piezo2 variant 14 (var14). b Current densities elicited by maximum displacement of control or fatty acid-treated Piezo1–/– N2A cells transfected with Piezo2 var14. Bars are mean ± SD. Kruskal-Wallis (H = 15.7; p = 0.028) and Dunn’s multiple comparisons test. c Time constants of inactivation elicited by maximum displacement of control or fatty acid-treated Piezo1–/– N2A cells transfected with Piezo2 var14. Bars are mean ± SD. Kruskal-Wallis (H = 22.41; p = 0.0022) and Dunn’s multiple comparisons test. d Representative whole-cell patch-clamp recordings elicited by mechanical stimulation (−60 mV) of (a) control, (b) LA (100 µM; o/n), (c) LA (20 μM; o/n), and (d) LA (20 μM each day for five days)-treated MCC13 cells. e Current densities elicited by maximum displacement of control and LA-treated MCC13 cells. Bars are mean ± SD. Kruskal-Wallis (H = 27.03; p = 5.8−6) and Dunn’s multiple comparisons test. n is denoted in each panel. Post hoc p-values are denoted above the bars. Source data are provided as a Source Data file.
Fig. 5
Fig. 5. LA does not increase PIEZO2 expression but alters the physical properties of the membranes.
a Western (anti-PIEZO2) and stain-free blots of the membrane fractions of control and LA-treated MCC13 cells. b Mean/scatter-dot plot showing relative intensities of PIEZO2 protein normalized to the level of PIEZO2 in the control group. Lines are mean ± SD. Two-tailed one-sample t-test (t = −2.5). c Representative currents elicited by 10 µm displacement of Piezo2 var14 transfected cells after perfusing bath solution with LA and Gd3+. d Percent current change from independent cells recorded with the protocol shown in (c). Paired data points represent individual cells. One-sided repeated measures ANOVA (F = 186.94; p = 9.51−6) and Tukey test. e Thermotropic characterization of the DPPC/fatty acid systems using DSC: control (Tm = 41.75 ±0.05 °C; mean ± sd), SA (42.23±0.04 °C), OA (40.59±0.03 °C), LA (40.53±0.06 °C), γLA (40.80±0.05 °C), DγLA (40.73±0.01 °C), AA (40.79±0.01 °C), and DTA (40.61±0 °C). f Effects of DPPC/fatty acids on melting temperatures (ΔTm) with respect to DPPC membranes. n = 3. Bars are mean ± SD. One-way ANOVA (F = 1,177; p = 0) and Bonferroni test. g Cooperative unit (κ) of the main transition of DPPC/fatty acid systems extracted from the thermotropic curves shown in (e), normalized to DPPC. Circles are mean ± SD. n = 3. Two-way ANOVA (F = 45.76896; p = 2.09−8) and Tukey multiple-comparisons test. h Mean current densities of control or fatty acid-treated Piezo1–/– N2A cells transfected with Piezo2 var14 vs. the cooperative unit (κ) of the main transition of DPPC/fatty acid systems. Circles are mean ± SEM. n = 3. A Pearson correlation was fitted to the unsaturated fatty acids data. i Inside-out recordings of currents elicited by negative pressure (at −10 mV) in LA (200 µM; 24 h)-treated cells transfected with MscL. j Normalized current responses to pressure changes of control (n = 7) and LA (200 µM; 24 h; n = 6)-treated cells transfected with MscL. A Boltzmann function was fitted to the data (continuous lines). The shadows indicate the 95% confidence bands. n is denoted in each panel. Post-hoc p-values are denoted in the corresponding panels. Source data are provided as a Source Data file.
Fig. 6
Fig. 6. LA increases mechanocurrents in Ube3am–/p+ DRG neurons.
a Representative whole-cell patch-clamp recording elicited by mechanical stimulation (−60 mV) of rapidly, intermediate, and slowly inactivating currents of control and LA-treated WT, Ube3am–/p+, and Ube3am+/p- DRG neurons. We used a two-day LA supplementation protocol (50 µM for 24 h and 100 µM for another 24 h). b Current densities elicited by maximum displacement of control and LA-treated WT DRG neurons classified by their time constant of inactivation. Bars are mean ± SD. Two-way ANOVA (F = 34.4; p = 1.05−6) and Sidak–Holm multiple-comparisons test. c Current densities elicited by maximum displacement of control and LA-treated Ube3am–/p+ DRG neurons classified by their time constant of inactivation. Bars are mean ± SD. Two-way ANOVA (F = 43.8; p = 2.36−8) and Sidak–Holm multiple-comparisons test. d Current densities elicited by maximum displacement of control and LA-treated Ube3am+/p– DRG neurons classified by their time constant of inactivation. Bars are mean ± SD. Two-way ANOVA (F = 45.9; p = 9.84−8) and Sidak–Holm multiple-comparisons test. e Boxplots show the displacement thresholds required to elicit mechanocurrents in control and LA-treated DRG neurons. Boxplots show mean (square), median (bisecting line), bounds of box (75th to 25th percentiles), outlier range with 1.5 coefficient (whiskers), and minimum and maximum data points. Two-way ANOVA (F = 14.2; p = 2.59−4) and Tukey multiple-comparisons test. n is denoted in each panel. Post hoc p-values are denoted above the boxes and bars. Source data are provided as a Source Data file.
Fig. 7
Fig. 7. A LA-enriched diet increases Ube3am–/p+ mouse mechano-currents and -excitability.
a Cumming estimation plot showing the mean differences in the LA membrane content of DRG neurons from WT, Ube3am–/p+, and Ube3am–/p+ mice fed with a LA-enriched diet, as determined by LC-MS. The raw data are plotted on the upper axes; each mean difference is plotted on the lower axes as a bootstrap sampling distribution. The mean differences are depicted as open circles; 95% confidence intervals are indicated by the ends of the vertical error bars. One-way ANOVA (F = 11.09; p = 0.0096) and Tukey multiple-comparisons test. b Representative whole-cell patch-clamp recordings elicited by mechanical stimulation (−60 mV) of rapidly, intermediate, and slowly-inactivating DRG neuron currents from Ube3am–/p+ mice fed with a standard (sd), high-fat (HFD), or LA-enriched (LA diet) diet. Top, mouse cartoon was created with BioRender.com. c Current densities elicited by maximum displacement of DRG neurons from Ube3am–/p+ mice fed with sd, HFD, or LA-enriched diets classified by their time constant of inactivation. Bars are mean ± SD. Two-way ANOVA (F = 25.36; p = 1.69−9) and Tukey multiple-comparisons test. d Boxplots show the displacement thresholds required to elicit DRG mechanocurrents from Ube3am–/p+ mice fed with sd, HFD, or LA-enriched diet. Kruskal-Wallis (H = 13.53; p = 0.0012) and Dunn’s multiple comparisons test. e Representative current-clamp recordings of membrane potential changes elicited by mechanical stimulation from DRG neurons of Ube3am–/p+ mice fed with sd, HFD, or LA-enriched diet. f Membrane potential peak vs. mechanical indentation of independent DRG neurons from Ube3am–/p+ mice fed with sd, HFD, or LA-enriched diet. At the top, boxplots show the displacement threshold required to elicit an action potential in these neurons. One-way ANOVA (F = 14.86; p = 2.72−5) and Tukey multiple-comparisons test. Boxplots show mean (square), median (bisecting line), bounds of box (75th to 25th percentiles), outlier range with 1.5 coefficient (whiskers), and minimum and maximum data points. n is denoted in each panel. Post-hoc p-values are denoted in the corresponding panels. Source data are provided as a Source Data file.
Fig. 8
Fig. 8. A LA-enriched diet ameliorates gait ataxia in the Ube3am–/p+ mouse.
a Timeline depicting the experimental design for gait analyses. Top, mouse cartoon was created with BioRender.com. b Cartoon describing gait behavioral assay was created with BioRender.com. c Mouse silhouette depicting the distance defined as stride length. d Stride length from WT, Ube3am–/p+, and Ube3am+/p– mice fed with a standard diet. Bars are mean ± SEM. Two-way ANOVA (F = 70.2; p = 0) and Tukey multiple-comparisons test. e Number of steps from WT, Ube3am–/p+, and Ube3am+/p– mice fed with a standard diet. Bars are mean ± SEM. One-way ANOVA (F = 19.75; p = 1.46−6) and Tukey multiple-comparisons test. f Stride length from Ube3am–/p+ mice fed with a standard, high-fat diet, or LA-enriched diet. Bars are mean ± SEM. Two-way ANOVA (F = 100.9; p = 0) and Tukey multiple-comparisons test. g Number of steps from Ube3am–/p+ mice fed with a standard, high-fat diet, or LA-enriched diet. Bars are mean ± SEM. Kruskal-Wallis (H = 26.25; p = 1.9−6) and Dunn’s multiple comparisons test. n is denoted in each panel. Post-hoc p-values are denoted in the corresponding panels. Source data are provided as a Source Data file.
Fig. 9
Fig. 9. Loss of UBE3A expression decreases PIEZO2 function in human-derived neurons.
a Representative whole-cell patch-clamp recordings of currents elicited by mechanical stimulation (−60 mV) in human iPSC-derived sensory neurons transfected with scrambled, UBE3A, or PIEZO2 siRNAs. b Current densities elicited by maximum displacement of siRNA-transfected iPSC-derived neurons. Bars are mean ± SD. Kruskal-Wallis (H = 13.9; p = 9.6−4) and Dunn’s multiple comparisons test. c Representative whole-cell patch-clamp recordings of currents elicited by mechanical stimulation (−60 mV) of control and LA-treated iPSC-derived sensory neurons (two-day LA supplementation; 50 µM for 24 h and 100 µM for another 24 h). d Current densities elicited by maximum displacement of control and LA-treated iPSC-derived neurons. Bars are mean ± SD. Two-tailed unpaired t-test (t = 4.57). e Boxplots show the displacement thresholds required to elicit mechanocurrents in of control and LA-treated iPSC-derived neurons. Two-tailed Mann-Whitney test (U = 9). f Top, current-clamp recordings of membrane potential changes elicited by indentation of control and LA-treated iPSC-derived neurons. Bottom, membrane potential peak vs. mechanical indentation of independent iPSC-derived neurons. At the top, boxplots show the displacement threshold required to elicit an action potential in these neurons. Two-tailed Mann-Whitney test (U = 0.5). g Representative whole-cell patch-clamp recordings elicited by mechanical stimulation (−60 mV) of rapidly, intermediate, and slowly inactivating currents of neurotypical and AS DPSC-derived neurons, with or without LA supplementation (two-day LA supplementation; 50 µM for 24 h and 100 µM for another 24 h). h Current densities elicited by maximum displacement from neurotypical and AS DPSC-derived neurons, ± LA supplementation, classified by their time constant of inactivation. Bars are mean ± SD. Two-way ANOVA (F = 45.23; p = 5.69−13) and Tukey multiple-comparisons test. Neurotypical (three individuals), AS (five individuals), and AS + LA (three individuals). Boxplots show mean (square), median (bisecting line), bounds of box (75th to 25th percentiles), outlier range with 1.5 coefficient (whiskers), and minimum and maximum data points. n is denoted in each panel. Post-hoc p-values are denoted in the corresponding panels. Source data are provided as a Source Data file.
Fig. 10
Fig. 10. Proposed mechanism whereby lack of UBE3A decreases mechanosensation in AS.
Loss of Ube3a expression increases cofilin leading to a decrease in actin filaments. Reduced actin filaments decrease PIEZO2 function as well as neuron mechano-excitability. LA increases PIEZO2 function and ameliorates gait deficits. Created with BioRender.com.

References

    1. Buiting K, Williams C, Horsthemke B. Angelman syndrome - insights into a rare neurogenetic disorder. Nat. Rev Neurol. 2016;12:584–593. doi: 10.1038/nrneurol.2016.133. - DOI - PubMed
    1. Larson AM, Shinnick JE, Shaaya EA, Thiele EA, Thibert RL. Angelman syndrome in adulthood. Am. J. Med. Genet. A. 2015;167A:331–344. doi: 10.1002/ajmg.a.36864. - DOI - PMC - PubMed
    1. Wheeler AC, Sacco P, Cabo R. Unmet clinical needs and burden in Angelman syndrome: a review of the literature. Orphanet. J. Rare Dis. 2017;12:164. doi: 10.1186/s13023-017-0716-z. - DOI - PMC - PubMed
    1. Tan WH, et al. Angelman syndrome: Mutations influence features in early childhood. Am. J. Med. Genet. A. 2011;155A:81–90. doi: 10.1002/ajmg.a.33775. - DOI - PMC - PubMed
    1. Jiang YH, et al. Mutation of the Angelman ubiquitin ligase in mice causes increased cytoplasmic p53 and deficits of contextual learning and long-term potentiation. Neuron. 1998;21:799–811. doi: 10.1016/S0896-6273(00)80596-6. - DOI - PubMed

Publication types