. 2023 Mar 1;14(1):1151.
doi: 10.1038/s41467-023-36797-2.

Structural details of a Class B GPCR-arrestin complex revealed by genetically encoded crosslinkers in living cells

Affiliations

Structural details of a Class B GPCR-arrestin complex revealed by genetically encoded crosslinkers in living cells

Yasmin Aydin et al. Nat Commun. .

Abstract

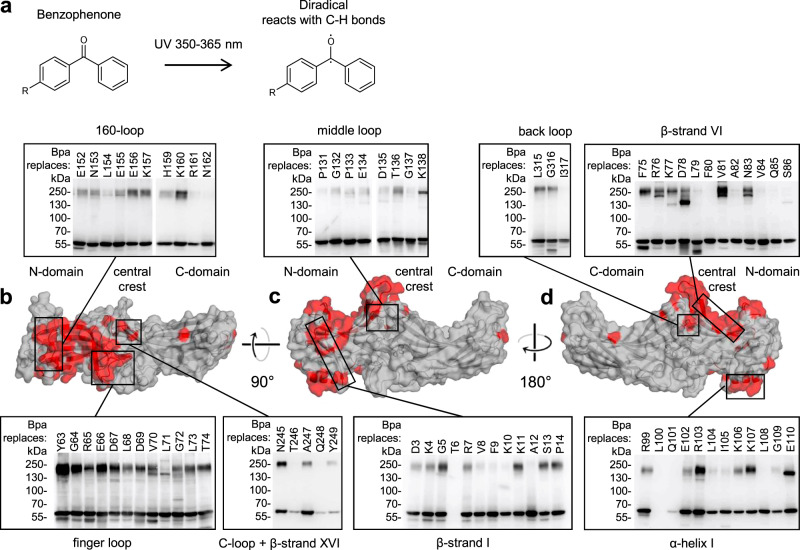
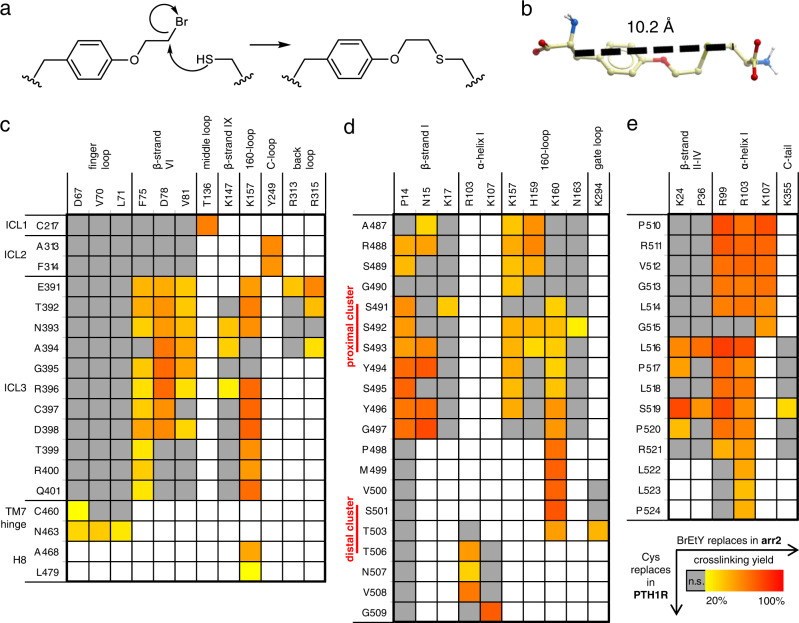
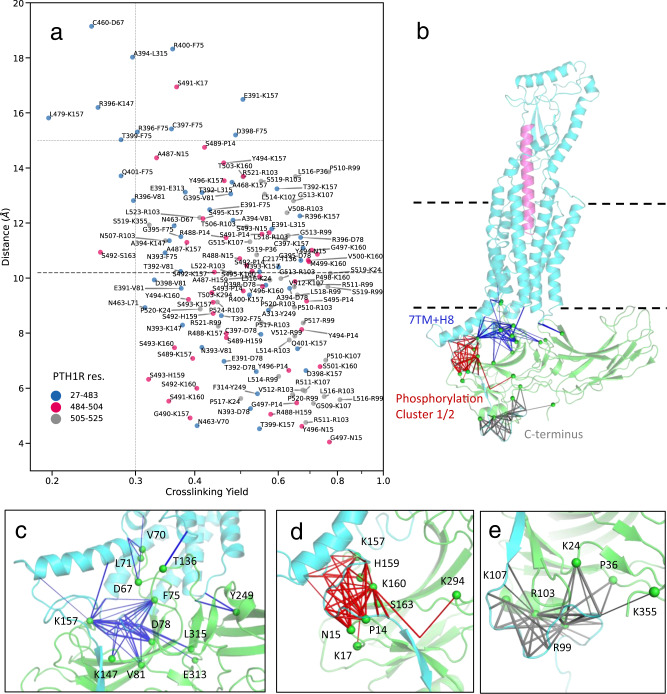
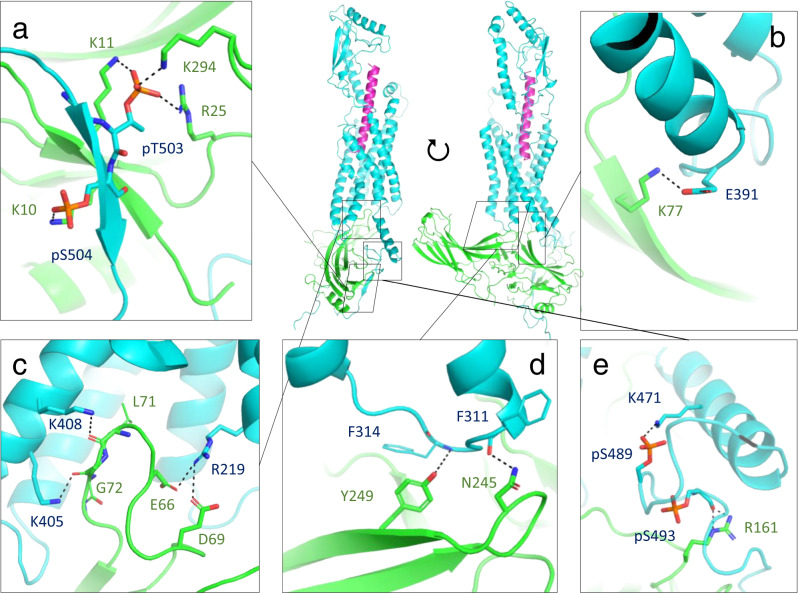
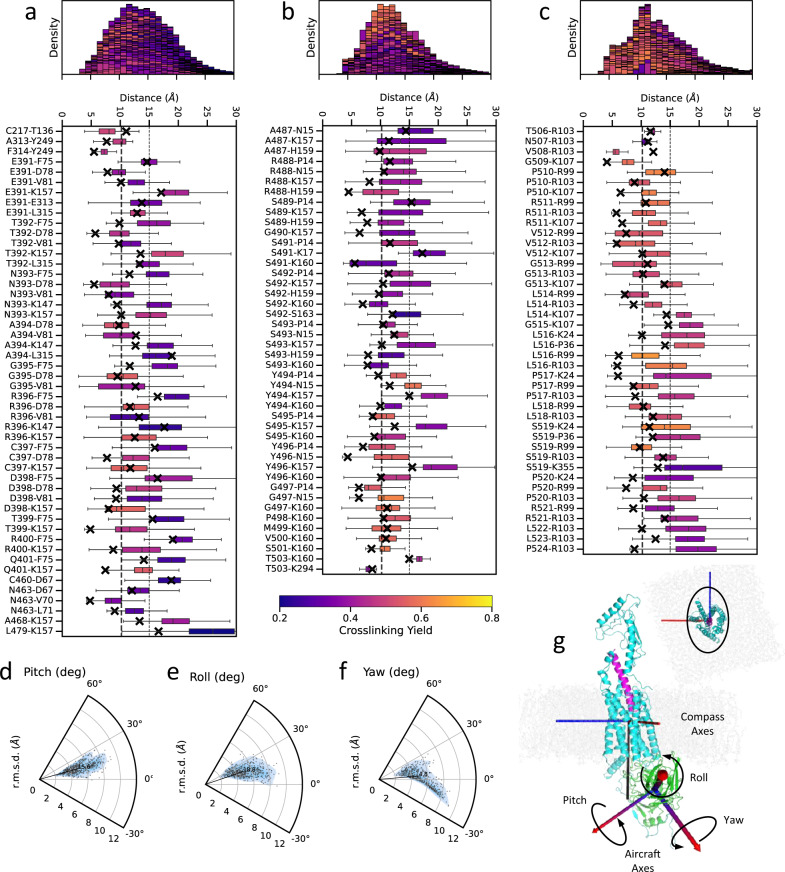
Understanding the molecular basis of arrestin-mediated regulation of GPCRs is critical for deciphering signaling mechanisms and designing functional selectivity. However, structural studies of GPCR-arrestin complexes are hampered by their highly dynamic nature. Here, we dissect the interaction of arrestin-2 (arr2) with the secretin-like parathyroid hormone 1 receptor PTH1R using genetically encoded crosslinking amino acids in live cells. We identify 136 intermolecular proximity points that guide the construction of energy-optimized molecular models for the PTH1R-arr2 complex. Our data reveal flexible receptor elements missing in existing structures, including intracellular loop 3 and the proximal C-tail, and suggest a functional role of a hitherto overlooked positively charged region at the arrestin N-edge. Unbiased MD simulations highlight the stability and dynamic nature of the complex. Our integrative approach yields structural insights into protein-protein complexes in a biologically relevant live-cell environment and provides information inaccessible to classical structural methods, while also revealing the dynamics of the system.


Conflict of interest statement

The authors declare no competing interests.

Figures

Fig. 1
Fig. 1. Footprint of PTH1R on arr2.
a Photo-activation of Bpa by UV light. The diradical species inserts into C-H bonds within an estimated radius of ∼3.1 Å from the oxygen atom (i.e. up to ∼9–10 Å from the Cβ). bd Surface representation of receptor-bound bovine arr2 (PDBID: 4jqi) with crosslinking hits highlighted in red; the insets are representative western blots of whole cell lysates from photo-crosslinking experiments (n = 1) detected with an α-HA antibody (comprehensive overview in Supplementary Fig. 2). Bpa-arr2-3xHA runs at an apparent molecular weight of ~55 kDa, the PTH1R-arr2 complex at ~200 kDa. Top (b), front (c), and back (d) views of arr2 are shown. Bands appearing below 55 kDa are due to intramolecular crosslinking, while other bands at higher MW likely belong to arrestin dimers (band at D78) or possibly other complexes.
Fig. 2
Fig. 2. Identification of PTH1R-arr2 intermolecular pairs of proximal residues via thiol trapping.
a Nucleophilic substitution reaction between the Cys thiol and the haloalkane moiety of BrEtY. The reaction occurs only when the two moieties are close to each other, and yields a stable thioether. b The length of BrEtY crosslink (10.2 Å) was estimated as the maximal distance between Cβ atoms in the BrEtY-cysteine adduct based on the extensive conformational sampling of the adduct molecule. ce Crosslinking matrix for Cys-PTH1R positions (row) with BrEtY-arr2 positions (column). Fields are colored according to the crosslinking yield of all combinations yielding significant signal over background noise (n ≥ 3, see Supplementary Data 2). Gray squares indicate crosslinking signals not significantly different from control background noise, white indicate combinations that were not tested. All tested combinations are shown in Supplementary Figs. 6, 7.
Fig. 3
Fig. 3. Crosslinking-guided model of PTHLA-PTH1R-arr2 complex.
a Plot of pairwise Cβ-Cβ distances against chemical crosslinking yields in the PTH1R-arr2 model after flexible refinement from the M2R-arr2 template. For glycine, Cα was used instead of Cβ. The horizontal dashed line at 10.2 Å marks the estimated distance (Cβ-Cβ) for BrEtY-Cys crosslinking, whereas the dotted line at 15.0 Å represents the maximal crosslinking distance when taking into account the flexibility of the complex. The large majority of the crosslinking pairs (125 out of 136), lie within 15.0 Å in the static 3D model, suggesting overall agreement with the crosslinking data. Source data are provided in Supplementary Data 3. b Overview of the complex with the location of the crosslinking pairs is shown. Crosslinking pairs in the 7TM and helix VIII of PTH1R (blue, c), in the proximal and distal phosphorylation clusters (red, d) and in the end of truncated C-terminus (gray, e) are shown as connecting solid lines in separate panels; the thickness of each line represents crosslinking yield; residues of arr2 are labeled. For illustrative purposes, a sphere is placed on Cα of labeled arr2 residues instead of the Cβ where the distances are measured.
Fig. 4
Fig. 4. Molecular Interactions in the optimized PTH1R-arr2 model based on the M2R-arr2 template.
Two views of the model containing long-acting PTH (PTHLA, magenta), arr2 (green), and PTH1R (cyan) are presented at the center. Interactions involving the (a) distal phosphorylation cluster, (b) ICL3 of PTH1R, (c) finger loop, (d) C-loop of arr2, and (e) proximal phosphorylation cluster of PTH1R are shown in separate panels.
Fig. 5
Fig. 5. Dynamics of the assembled complex based on M2R-arr2 template.
ac Box plots and stacked histograms showing statistics of crosslinking distances in MD simulations in PTH1R-arr2. Pairwise Cβ-Cβ distances were measured; when glycine was present, Cα was used instead. Chemical crosslinking pairs are grouped by PTH1R regions, namely (a) 7TM + helix VIII (res. D27–F483), (b) proximal and distal phosphorylation clusters (res. K484–S504), and (c) the rest of the C-terminus in this construct (res. V505–T525). The whiskers of the box plot indicate the maximum and minimum of the distance observed; the center of the box indicates median value of the distance observed; the lower and upper bounds of the box indicates the 25th percentile and the 75th percentile of the distance observed. These descriptive statistics were collected with n = 12,000 frames from the ten 1200 ns trajectories. Distances in the starting model are marked with crosses. The lower bound of the covalent diameter at 10.2 Å of BrEtY is drawn as a thick vertical dash line accompanied by a thin dash line at 15 Å. Both plots are colored by the crosslinking yield of individual pairs. The stacked histograms on top give an overall summarizing statistics of the Cβ-Cβ distances in each of the PTH1R regions showing that the vast majority of pairs stays within 15 Å distance during MD simulations. The orientation of arr2 relative to PTH1R was measured in terms of pitch, roll, and yaw angles of rotation around their principal axes. Source data for Fig. 5a–c are provided as Supplementary Data 4–6. df Distribution of pitch, roll, yaw angles and r.m.s.d. of arr2 from its starting coordinates for each frame in MD simulations. In general, the orientations are limited by the membrane anchoring of C-edge with pitch angle showing a modest ~13 degrees deviation, followed by ~17 degrees of roll and up to 25 degrees of yaw deviations. (g) Compass and aircraft axes to define pitch, roll, yaw angles. Source data for Fig. 5d–f are provided as Supplementary Data 7.

References

    1. Fredriksson R, Lagerström MC, Lundin L-G, Schiöth HB. The G-protein-coupled receptors in the human genome form five main families. Phylogenetic analysis, paralogon groups, and fingerprints. Mol. Pharmacol. 2003;63:1256–1272. doi: 10.1124/mol.63.6.1256. - DOI - PubMed
    1. Gurevich VV, Gurevich EV. The structural basis of arrestin-mediated regulation of G-protein-coupled receptors. Pharmacol. Ther. 2006;110:465–502. doi: 10.1016/j.pharmthera.2005.09.008. - DOI - PMC - PubMed
    1. Benovic JL, et al. Functional desensitization of the isolated beta-adrenergic receptor by the beta-adrenergic receptor kinase: potential role of an analog of the retinal protein arrestin (48-kDa protein) Proc. Natl Acad. Sci. 1987;84:8879–8882. doi: 10.1073/pnas.84.24.8879. - DOI - PMC - PubMed
    1. Caron MG, Barak LS. A brief history of the β-arrestins. Methods Mol. Biol. 2019;1957:3–8. doi: 10.1007/978-1-4939-9158-7_1. - DOI - PMC - PubMed
    1. Ferguson SS, et al. Role of beta-arrestin in mediating agonist-promoted G protein-coupled receptor internalization. Science. 1996;271:363–366. doi: 10.1126/science.271.5247.363. - DOI - PubMed

Publication types

MeSH terms