

Decreased coherence in the model of the dorsal visual pathway associated with Alzheimer's disease
- PMID: 36859462
- PMCID: PMC9977922
- DOI: 10.1038/s41598-023-30535-w
Decreased coherence in the model of the dorsal visual pathway associated with Alzheimer's disease
Abstract
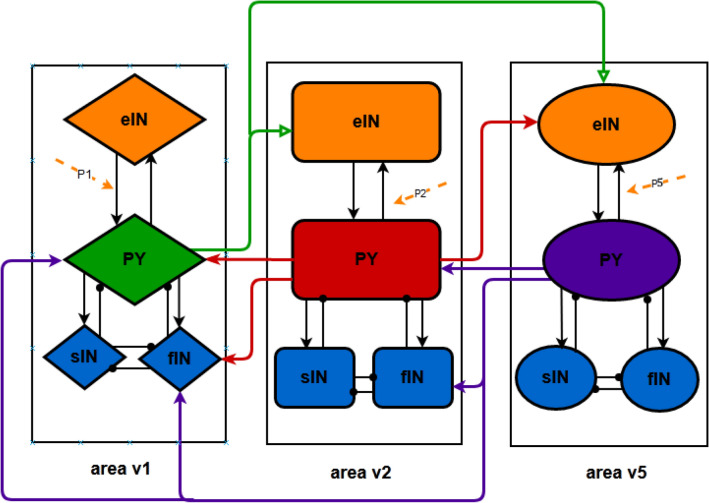
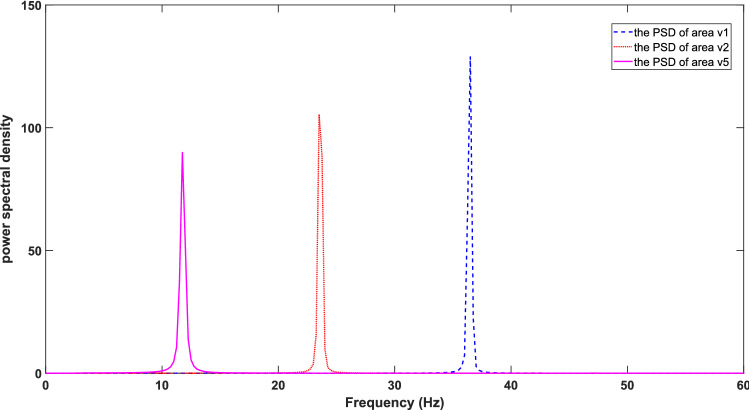
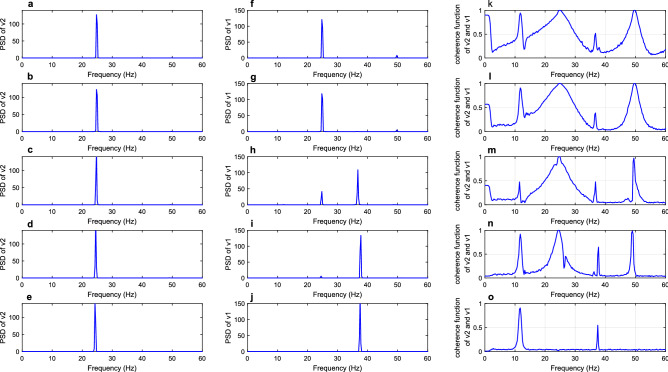
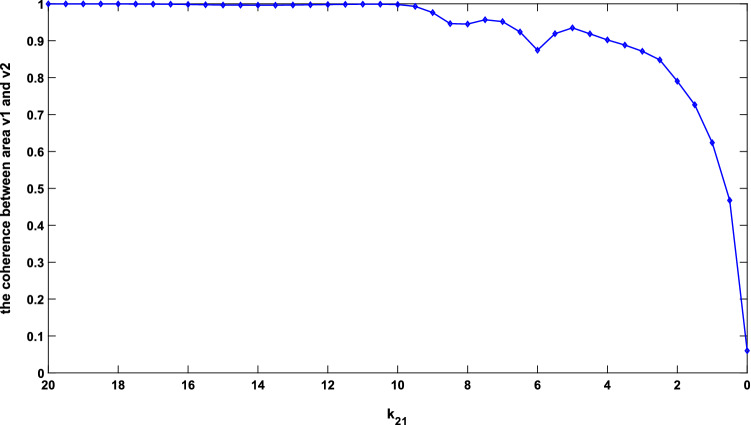
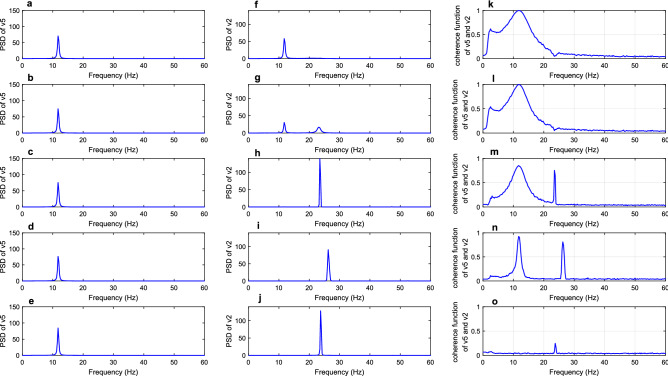
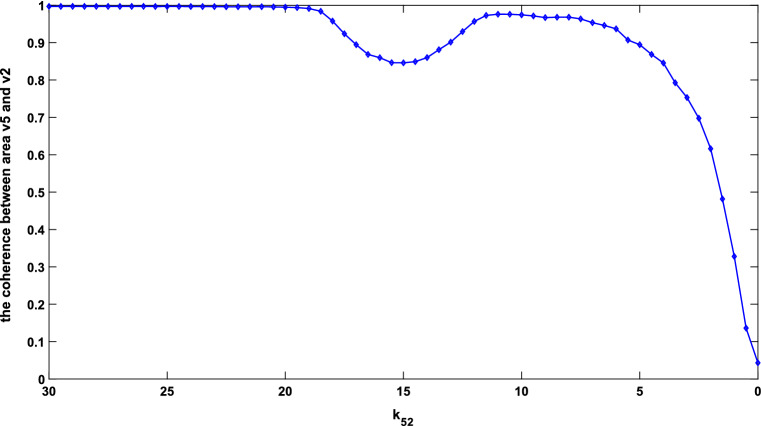
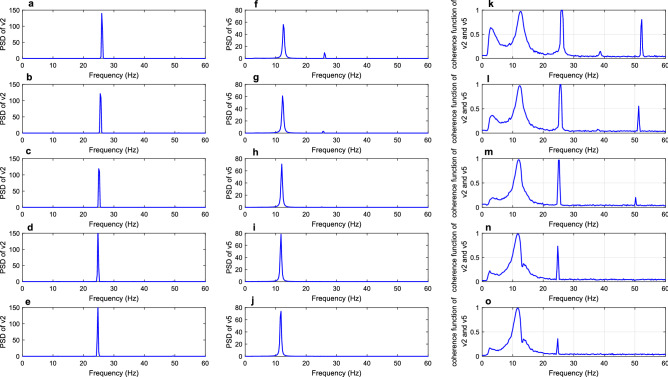
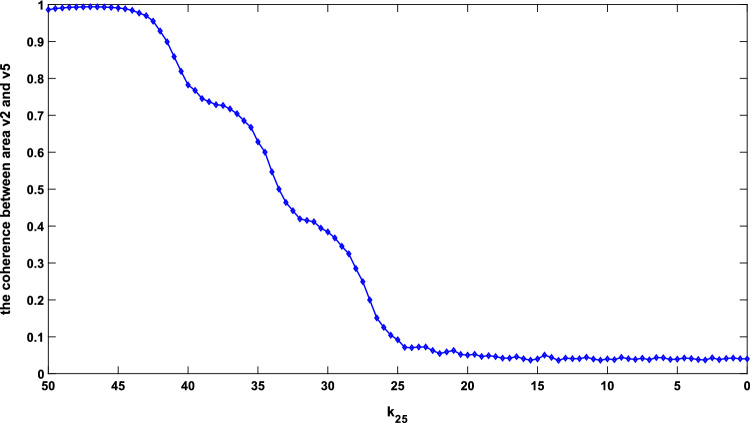
Decreased coherence in electroencephalogram (EEG) has been reported in Alzheimer's disease (AD) experimentally, which could be considered as a typical electrophysiological characteristic in AD. This work aimed to investigate the effect of AD on coherence in the dorsal visual pathway by the technique of neurocomputation. Firstly, according to the hierarchical organization of the cerebral cortex and the information flows of the dorsal visual pathway, a more physiologically plausible neural mass model including cortical areas v1, v2, and v5 was established in the dorsal visual pathway. The three interconnected cortical areas were connected by ascending and descending projections. Next, the pathological condition of loss of long synaptic projections in AD was simulated by reducing the parameters of long synaptic projections in the model. Then, the loss of long synaptic projections on coherence among different visual cortex areas was explored by means of power spectral analysis and coherence function. The results demonstrate that the coherence between these interconnected cortical areas showed an obvious decline with the gradual decrease of long synaptic projections, i.e. decrease in descending projections from area v2 to v1 and v5 to v2 and ascending projection from area v2 to v5. Hopefully, the results of this study could provide theoretical guidance for understanding the dynamical mechanism of AD.
© 2023. The Author(s).
Conflict of interest statement
The authors declare no competing interests.
Figures
Similar articles
-
Functional implications of the anatomical organization of the callosal projections of visual areas V1 and V2 in the macaque monkey.Behav Brain Res. 1988 Aug;29(3):225-36. doi: 10.1016/0166-4328(88)90027-7. Behav Brain Res. 1988. PMID: 3166700
-
Alpha rhythm slowing in a modified thalamo-cortico-thalamic model related with Alzheimer's disease.PLoS One. 2020 Mar 12;15(3):e0229950. doi: 10.1371/journal.pone.0229950. eCollection 2020. PLoS One. 2020. PMID: 32163454 Free PMC article.
-
Pattern reversal visual evoked responses of V1/V2 and V5/MT as revealed by MEG combined with probabilistic cytoarchitectonic maps.Neuroimage. 2006 May 15;31(1):86-108. doi: 10.1016/j.neuroimage.2005.11.045. Epub 2006 Feb 15. Neuroimage. 2006. PMID: 16480895
-
Projections of the Mouse Primary Visual Cortex.Front Neural Circuits. 2021 Nov 19;15:751331. doi: 10.3389/fncir.2021.751331. eCollection 2021. Front Neural Circuits. 2021. PMID: 34867213 Free PMC article. Review.
-
Brain neural synchronization and functional coupling in Alzheimer's disease as revealed by resting state EEG rhythms.Int J Psychophysiol. 2016 May;103:88-102. doi: 10.1016/j.ijpsycho.2015.02.008. Epub 2015 Feb 7. Int J Psychophysiol. 2016. PMID: 25660305 Review.
Cited by
-
Exploring the Relationship between Behavioral and Neurological Impairments Due to Mild Cognitive Impairment: Correlation Study between Virtual Kiosk Test and EEG-SSVEP.Sensors (Basel). 2024 May 30;24(11):3543. doi: 10.3390/s24113543. Sensors (Basel). 2024. PMID: 38894334 Free PMC article.
-
Controlling Alzheimer's disease by deep brain stimulation based on a data-driven cortical network model.Cogn Neurodyn. 2024 Oct;18(5):3157-3180. doi: 10.1007/s11571-024-10148-3. Epub 2024 Jul 8. Cogn Neurodyn. 2024. PMID: 39555293
References
-
- Bokdea ALW, Lopez-Bayo P, Born C, Dong W, Meindl T, Leinsinger G, Teipel SJ, Faltraco F, Reiser M, Möller HJ, Hampel H. Functional abnormalities of the visual processing system in subjects with mild cognitive impairment: An fMRI study. Psychiatry Res. Neuroimaging. 2007;163:248–259. doi: 10.1016/j.pscychresns.2007.08.013. - DOI - PubMed
Publication types
MeSH terms
LinkOut - more resources
Full Text Sources
Medical
