. 2023 Mar 1;13(1):3449.
doi: 10.1038/s41598-023-30516-z.

Resolving hidden pixels beyond the resolution limit of projection imaging by square aperture

Affiliations

Resolving hidden pixels beyond the resolution limit of projection imaging by square aperture

Kelvin J Xu et al. Sci Rep. .

Abstract

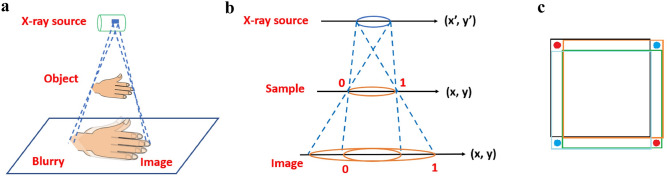
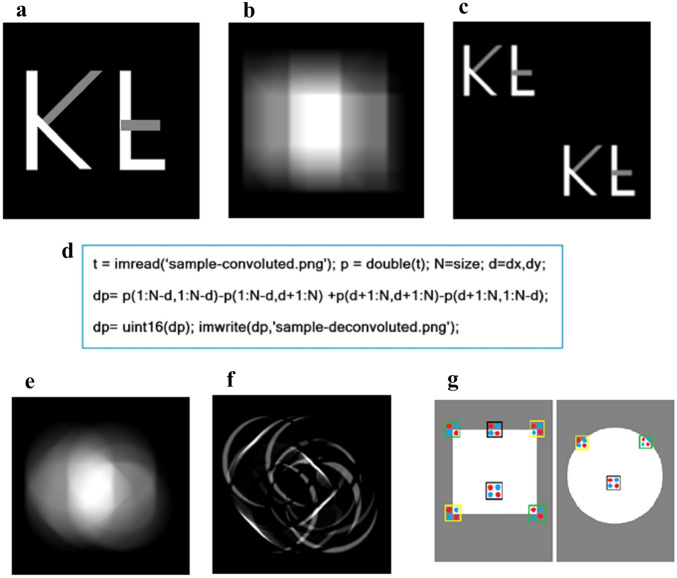
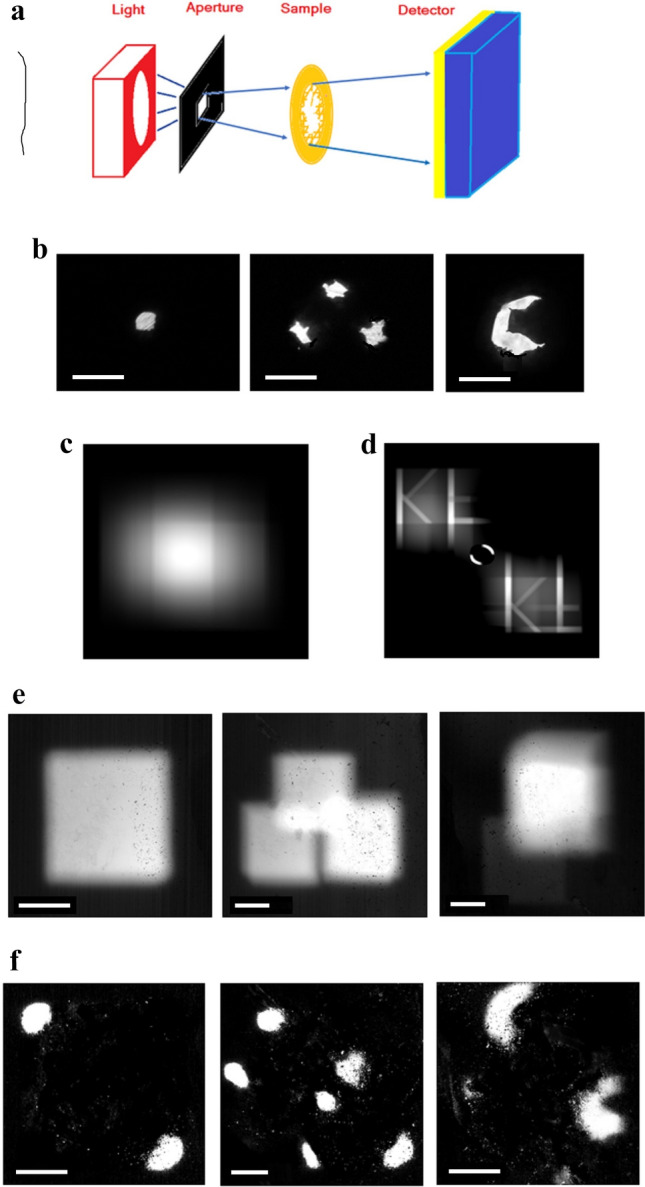
Projection imaging has been employed widely in many areas, such as x-ray radiography, due to its penetration power and ballistic geometry of their paths. However, its resolution limit remains a major challenge, caused by the conflict of source intensity and source size associated with image blurriness. A simple yet robust scheme has been proposed here to solve the problem. An unconventional square aperture, rather than the usual circular beam, is constructed, which allows for the straightforward deciphering of a blurred spot, to unravel hundreds originally hidden pixels. With numerical verification and experimental demonstration, our proposal is expected to benefit multiple disciplines, not limited to x-ray imaging.


Conflict of interest statement

The authors declare no competing interests.

Figures

Figure 1
Figure 1
(a) Due to the ballistic nature of short wavelength x-rays, and submicron coherent lengths, a non-point source produces many projected beams through an object, all of which are then superimposed onto each other, to form a blurred image on the detector screen. (b) From the projection geometry, the image p(x,y) is simply given by the sample f(x,y) convoluted over the light source distribution g(x’,y’), where the scale of (x,y) for f, and p, can be adjusted to simplify the derivation. (c) The “square aperture difference” of p(x,y), convoluted by a point f with a square g, where the green square = p(x,y), orange = p(x,y + d), black = p(x + d,y + d), blue = p(x + d,y). To be consistent with the data matrix, the upper left corner is taken as the origin of (x, y), and d the amount of shift along the x,y axes. The resulting 4 p’s cancel each other everywhere, except for the positive red dots, sized by d, and negative blue dots, which will be dropped when re-written into an image.
Figure 2
Figure 2
(a) Numerical construction of an f(x,y) of “K” and inverted “F”, with 0, 0.5 and 1.0 intensities, over a matrix of 200 × 200, to serve as a demo sample. (b) f convoluted via Eq. (1) by a square source g of 200 × 200, the resulting p(x,y) are blurred, featuring square shaped spots caused by square light source. (c) Decipher matrix p(x,y) by the “square aperture difference” producing a twin image, separated by the source size. (d) Matlab™ commands for image-data, and deciphering by “square aperture difference”, (e) For the usual circular beam source, the convolution of 2a becomes very different; (f) The de-convolution of 2e produces a collection of curved lines, the letters are invisible; (g) Why the usual circular beam fails: for a pinhole f, the circular shape g forms a ring shaped rising edge, giving non-zero contribution along the circle, whereas the square g makes zero contribution from the edges, as the red and blue dots cancel completely.
Figure 3
Figure 3
(a) The experimental setup of a non-point light source of wavelengths centered around 550 nm, square aperture by 2 perpendicular slits of 1 mm separation via thin metal strips, sample by a pinhole punched metal foil, and 3 × 5mm2 image sensor from a digital camera, with the lens assembly removed. The aperture-detector distance is about 50 mm, with the sample placed in between. (b) microscope photos of the samples made of metal foil; one pinhole on the left; triple pinholes in the middle, and the letter “C” to the right. Scale bar length: 300 µm. (c) For a common non-point light source, the intensity may not be uniformly distributed across the square aperture. Thus Fig. 2b was recalculated by incorporating a Gaussian decaying factor of exp(− R2/Ro2) on top of a square g(x’,y’), where R is the radius from the center, and Ro is about 70% of the half width of g. (d) Despite the resulting p(x,y) starts to show some artifacts, the de-convolution of 3c is similar to Fig. 2c, due to the fact that it is slowly-varying, when compared with the letters. (e) The resulting photos from the metal foils in 3b, taken by a CMOS sensor of digital camera: on the left, almost a perfect square like spot is produced by the light source through a single pinhole in 3b; in the middle, three overlapping squares are formed by the triple pinholes in 3b; to the right, the “C” in 3b leads to a square-like bright spot. Scale bar length: 400 µm. Note that these squares are the smallest spots attainable due to the finite sized light source, where the original pinholes and letter “C” are blurred. (f) The de-convolution results of 3e by Matlab™ command in 2d: on the left, the “square” produces after the “square aperture difference” a pair of bright dots, corresponding to the two red dots in 1c; in the middle, the triple pinhole forms two sets of triplets, with one on the upper left and the other on the lower right; to the right, the doubled “C”s are evident, despite the noise. Scale bar length: 400 µm. Compare with 3e, the resolution is much improved and the blurred images are now resolved.

Similar articles

References

    1. Groenewald A, Groenewald WA. Development of a universal medical X-ray imaging phantom prototype. J. Appl. Clin. Med. Phys. 2016;17:356–365. doi: 10.1120/jacmp.v17i6.6356. - DOI - PMC - PubMed
    1. Seibert JA. Projection x-ray imaging: Radiography, mammography, fluoroscopy. Health Phys. 2019;116:148–156. doi: 10.1097/HP.0000000000001028. - DOI - PubMed
    1. Müller B, Khimchenko A, Rodgers G, et al. X-ray imaging of human brain tissue down to the molecule level. Proc. XVII Int. Conf. X-ray Lasers. 2021;11886:1188613.
    1. De Jonge M, Hornberger B, Holzner C, et al. Quantitative phase imaging with a scanning transmission x-ray microscope. Phys. Rev. Lett. 2008;100:163902. doi: 10.1103/PhysRevLett.100.163902. - DOI - PMC - PubMed
    1. Turner JJ, Huang X, Krupin O, et al. X-ray diffraction microscopy of magnetic structures. Phys. Rev. Lett. 2011;107:033904. doi: 10.1103/PhysRevLett.107.033904. - DOI - PubMed