Review
. 2023 Feb 28;46(2):106-119.
doi: 10.14348/molcells.2023.0009. Epub 2023 Feb 24.

Integration of Single-Cell RNA-Seq Datasets: A Review of Computational Methods

Affiliations
Review

Integration of Single-Cell RNA-Seq Datasets: A Review of Computational Methods

Yeonjae Ryu et al. Mol Cells. .

Abstract

With the increased number of single-cell RNA sequencing (scRNA-seq) datasets in public repositories, integrative analysis of multiple scRNA-seq datasets has become commonplace. Batch effects among different datasets are inevitable because of differences in cell isolation and handling protocols, library preparation technology, and sequencing platforms. To remove these batch effects for effective integration of multiple scRNA-seq datasets, a number of methodologies have been developed based on diverse concepts and approaches. These methods have proven useful for examining whether cellular features, such as cell subpopulations and marker genes, identified from a certain dataset, are consistently present, or whether their condition-dependent variations, such as increases in cell subpopulations in particular disease-related conditions, are consistently observed in different datasets generated under similar or distinct conditions. In this review, we summarize the concepts and approaches of the integration methods and their pros and cons as has been reported in previous literature.

Keywords: batch correction; data integration; single-cell RNA-seq.


Conflict of interest statement

CONFLICT OF INTEREST

The authors have no potential conflicts of interest to disclose.

Figures

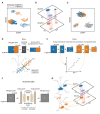
Fig. 1
Fig. 1. Definition of batches.
(A) Schematic illustration of defining batches by donors (Dataset 1), sample preparation protocols (Dataset 2), sequencing platforms (Dataset 3), and individual samples (donors; Dataset k). (B) Analytical flow of data integration. See text for details.
Fig. 2
Fig. 2. Schematic view of the methods using linear decomposition models.
(A) Linear decomposition scheme used in limma and ComBat. Batches and conditions for cells are indicated by colors. Matrix sizes are denoted in left bottom (number of rows) and right top (number of columns) corners: N genes, M cells, H conditions, and K batches. The error matrix used in ComBat is depicted in parentheses. (B) Decomposition scheme used in ZINB-WaVE involving L gene-level covariates and Q unknown sample-level covariates.
Fig. 3
Fig. 3. Dimension reduction methods.
(A) Cell-level covariates. Three cell types (clusters) show differential variations between batches 1 and 2. (B) Anchored cell pairs between batches 1 and 2 on two-dimensional LV space. (C) Distributions of cells after batch correction on the UMAP. (D and E) Schematic illustration of PCA (D) and CCA (E). PC1 and PC2 are defined to capture the largest and 2nd largest variance in the distribution of cells while u and v are defined to maximize the correlation between projections of X1 (batch 1) and X2 (batch 2) onto u and v. Decomposition schemes of X1 and X1 are also shown. (F) Architecture of the autoencoder that takes X as an input and tries to reconstruct X itself. During this reconstruction, the essential features of X are extracted in the nodes of the embedding layer. UMAP, uniform manifold approximation and projection; PCA, principal component analysis; CCA, canonical correlation analysis; PC, principal component.
Fig. 4
Fig. 4. Cell-level similarity search.
(A) Similar cell pairs identified by cell-level similarity search (left) and similar clusters identified by clustering (right). (B) Schematic illustration of MNN strategy for identifying anchored cell pairs (left) and batch correction strategy (right). (C and D) Dynamic time warping involving selection of metagenes (C, top), determination of metagene expression profiles (C, bottom), generation of cumulative distance matrix (D, top), and dynamic time warping strategy (D, bottom). See text for details (B-D).
Fig. 5
Fig. 5. Cluster-level similarity search.
Schematic illustration of the analytical steps in Harmony (A), DESC (B), LIGER (C), and scMerge (D). See text for details.
Fig. 6
Fig. 6. Generative models with variational autoencoder.
(A) Architecture of scVI and schematic illustration of analytical steps in scVI. The outputs from NN5-6 are used to estimate the ZINB distribution p(xm|zm,sm,lm). (B). Schematic illustration of analytical steps in scGen. See text for details (A and B).

References

    1. Amodio M., van Dijk D., Srinivasan K., Chen W.S., Mohsen H., Moon K.R., Campbell A., Zhao Y., Wang X., Venkataswamy M., et al. Exploring single-cell data with deep multitasking neural networks. Nat. Methods. 2019;16:1139–1145. doi: 10.1038/s41592-019-0576-7. - DOI - PMC - PubMed
    1. Aran D., Looney A.P., Liu L., Wu E., Fong V., Hsu A., Chak S., Naikawadi R.P., Wolters P.J., Abate A.R., et al. Reference-based analysis of lung single-cell sequencing reveals a transitional profibrotic macrophage. Nat. Immunol. 2019;20:163–172. doi: 10.1038/s41590-018-0276-y. - DOI - PMC - PubMed
    1. Argelaguet R., Cuomo A.S.E., Stegle O., Marioni J.C. Computational principles and challenges in single-cell data integration. Nat. Biotechnol. 2021;39:1202–1215. doi: 10.1038/s41587-021-00895-7. - DOI - PubMed
    1. Barkas N., Petukhov V., Nikolaeva D., Lozinsky Y., Demharter S., Khodosevich K., Kharchenko P.V. Joint analysis of heterogeneous single-cell RNA-seq dataset collections. Nat. Methods. 2019;16:695–698. doi: 10.1038/s41592-019-0466-z. - DOI - PMC - PubMed
    1. Barrett T., Wilhite S.E., Ledoux P., Evangelista C., Kim I.F., Tomashevsky M., Marshall K.A., Phillippy K.H., Sherman P.M., Holko M., et al. NCBI GEO: archive for functional genomics data sets--update. Nucleic Acids Res. 2013;41((Database issue)):D991–D995. doi: 10.1093/nar/gks1193. - DOI - PMC - PubMed

MeSH terms

LinkOut - more resources