

Serum-integrated omics reveal the host response landscape for severe pediatric community-acquired pneumonia
- PMID: 36859478
- PMCID: PMC9976684
- DOI: 10.1186/s13054-023-04378-w
Serum-integrated omics reveal the host response landscape for severe pediatric community-acquired pneumonia
Abstract
Objective: Community-acquired pneumonia (CAP) is the primary cause of death for children under five years of age globally. Hence, it is essential to investigate new early biomarkers and potential mechanisms involved in disease severity.
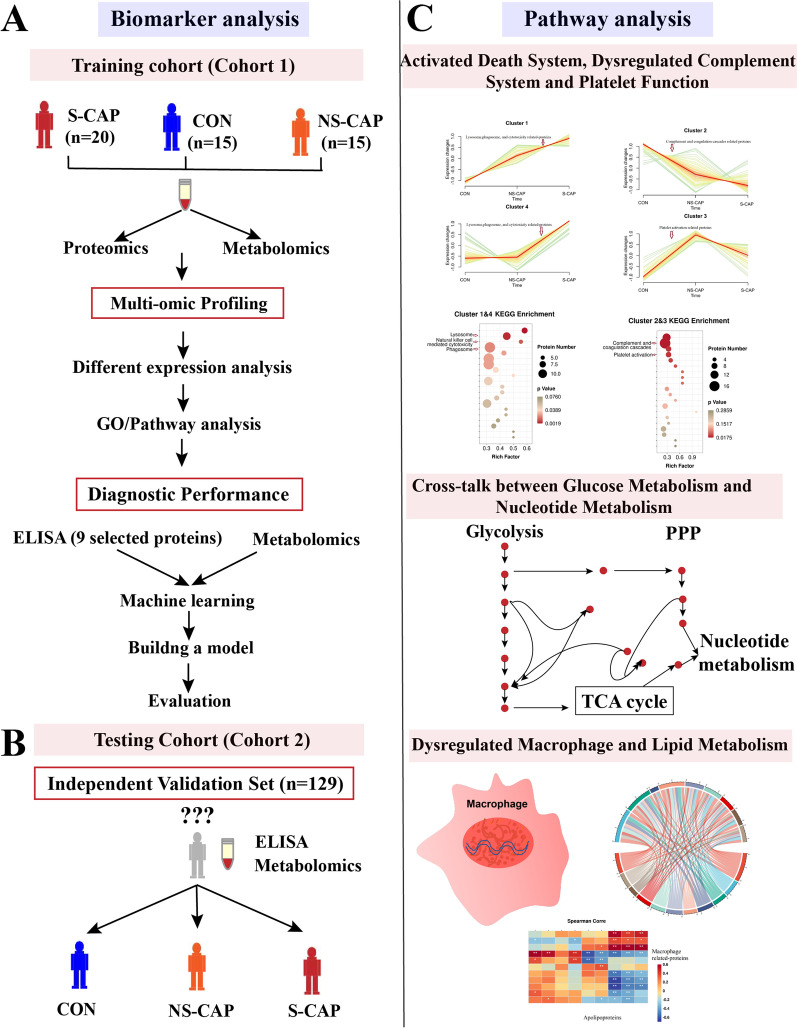
Methods: Proteomics combined with metabolomics was performed to identify biomarkers suitable for early diagnosis of severe CAP. In the training cohort, proteomics and metabolomics were performed on serum samples obtained from 20 severe CAPs (S-CAPs), 15 non-severe CAPs (NS-CAPs) and 15 healthy controls (CONs). In the verification cohort, selected biomarkers and their combinations were validated using ELISA and metabolomics in an independent cohort of 129 subjects. Finally, a combined proteomics and metabolomics analysis was performed to understand the major pathological features and reasons for severity of CAP.
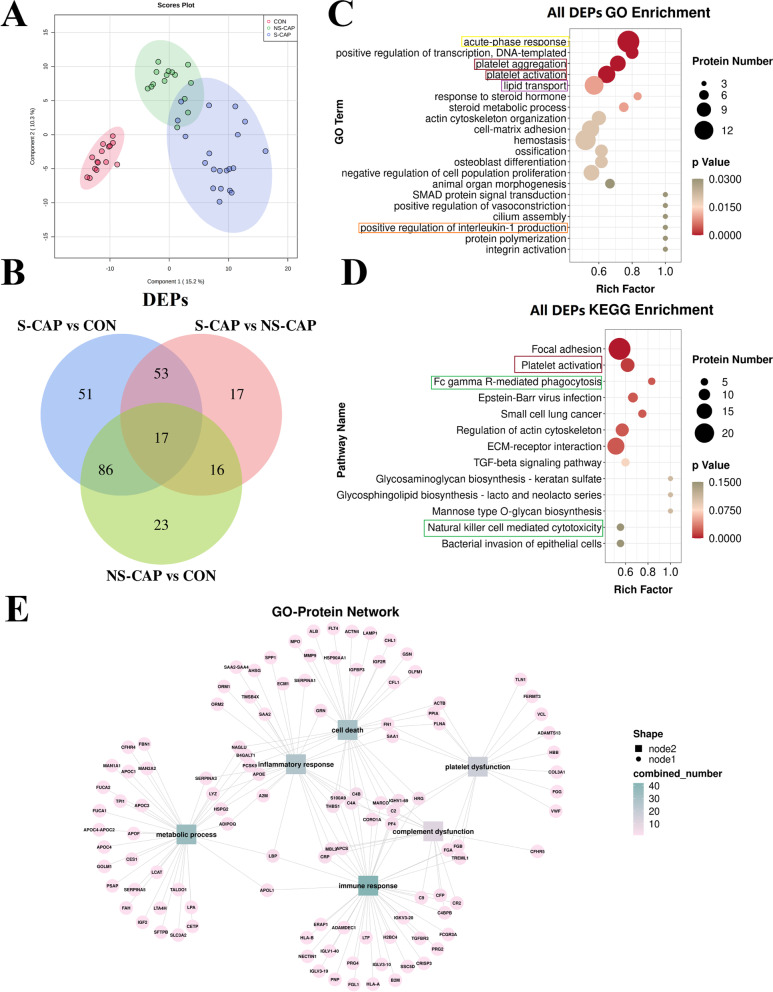
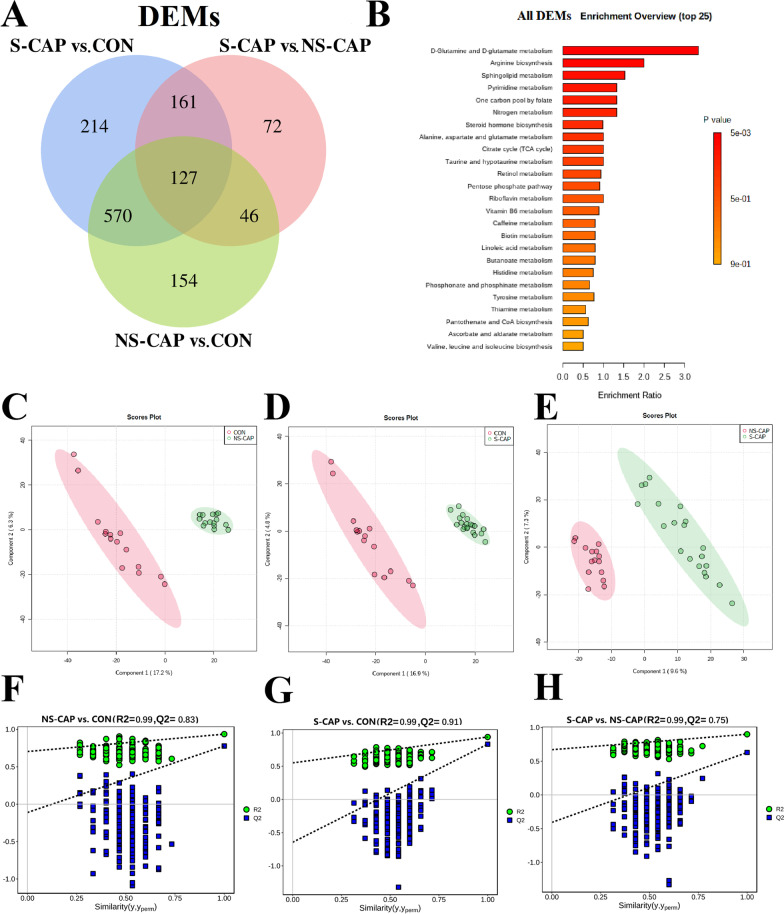
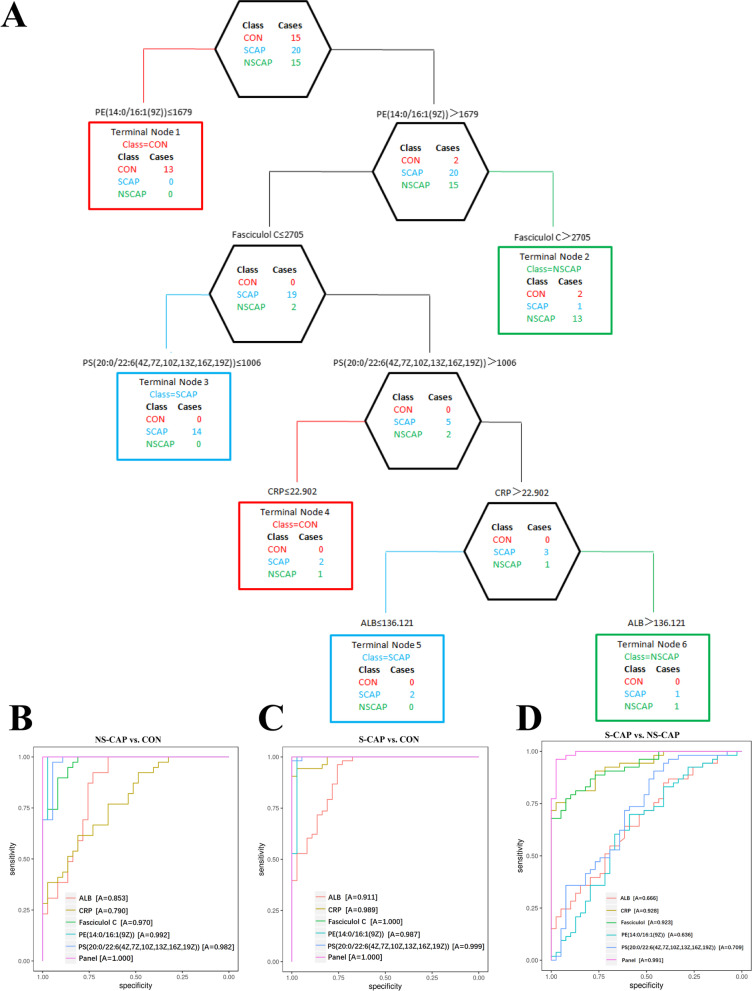
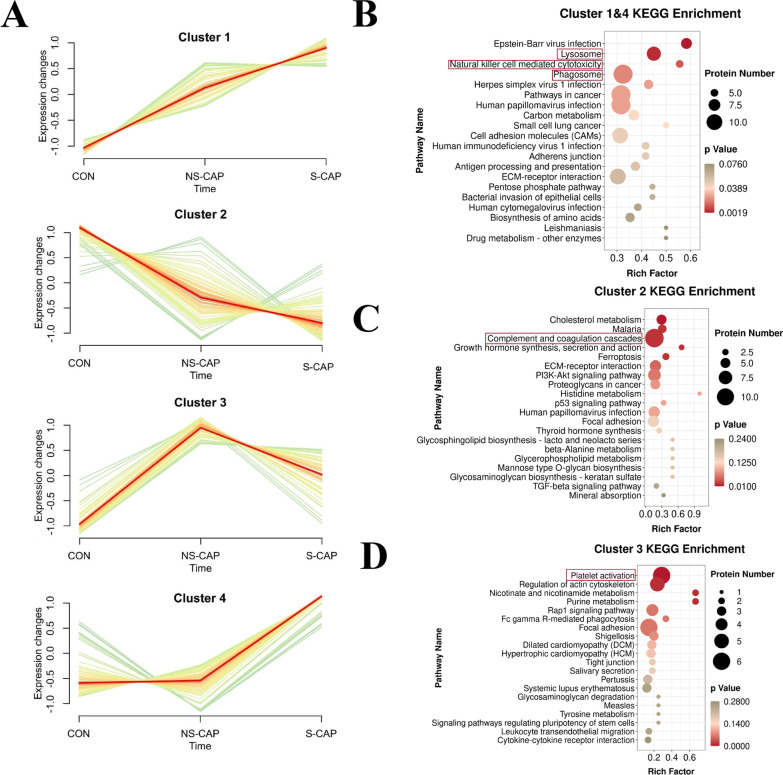
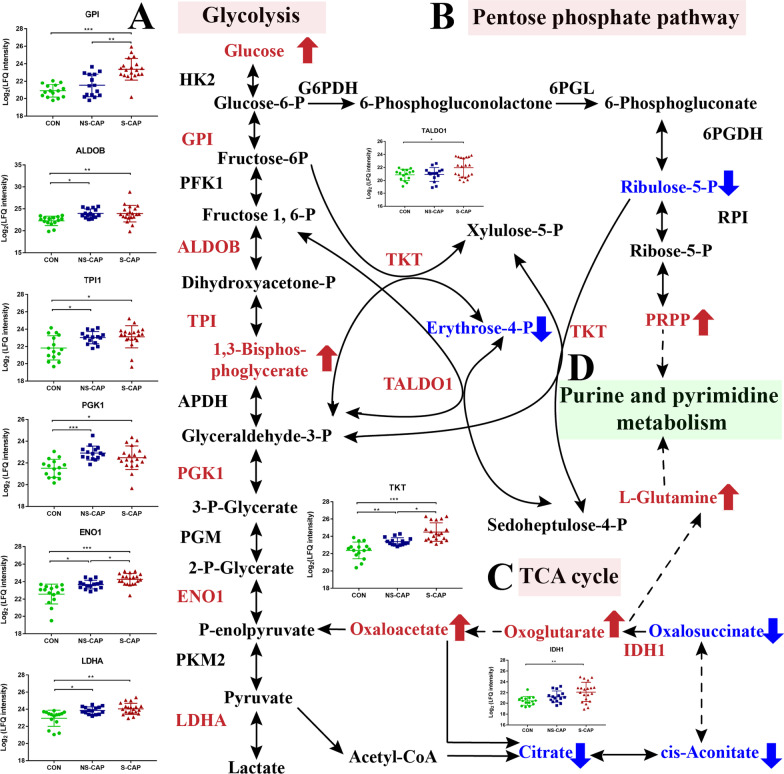
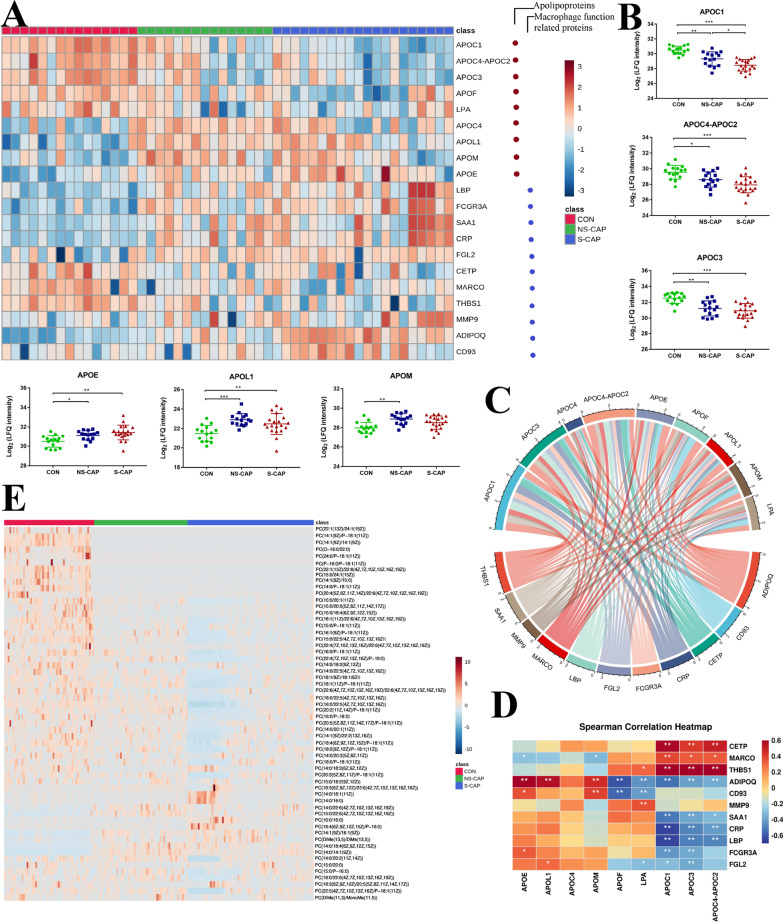
Results: The proteomic and metabolic signature was markedly different between S-CAPs, NS-CAPs and CONs. A new serum biomarker panel including 2 proteins [C-reactive protein (CRP), lipopolysaccharide (LBP)] and 3 metabolites [Fasciculol C, PE (14:0/16:1(19Z)), PS (20:0/22:6(4Z, 7Z, 10Z, 13Z, 16Z, 19Z))] was developed to identify CAP and to distinguish severe pneumonia. Pathway analysis of changes revealed activation of the cell death pathway, a dysregulated complement system, coagulation cascade and platelet function, and the inflammatory responses as contributors to tissue damage in children with CAP. Additionally, activation of glycolysis and higher levels of nucleotides led to imbalanced deoxyribonucleotide pools contributing to the development of severe CAP. Finally, dysregulated lipid metabolism was also identified as a potential pathological mechanism for severe progression of CAP.
Conclusion: The integrated analysis of the proteome and metabolome might open up new ways in diagnosing and uncovering the complexity of severity of CAP.
Keywords: Community-acquired pneumonia; Diagnosis; Host response; Metabolomics; Proteomics.
© 2023. The Author(s).
Conflict of interest statement
The authors declare no competing interests.
Figures
Similar articles
-
Uncovering host response in adults with severe community-acquired pneumonia: a proteomics and metabolomics perspective study.World J Emerg Med. 2025 May 1;16(3):248-255. doi: 10.5847/wjem.j.1920-8642.2025.063. World J Emerg Med. 2025. PMID: 40406290 Free PMC article.
-
Multi-omics analysis reveals overactive inflammation and dysregulated metabolism in severe community-acquired pneumonia patients.Respir Res. 2024 Jan 19;25(1):45. doi: 10.1186/s12931-024-02669-6. Respir Res. 2024. PMID: 38243232 Free PMC article.
-
Association of proteome and metabolome signatures with severity in patients with community-acquired pneumonia.J Proteomics. 2020 Mar 1;214:103627. doi: 10.1016/j.jprot.2019.103627. Epub 2019 Dec 30. J Proteomics. 2020. PMID: 31899367
-
Biomarkers in Pediatric Community-Acquired Pneumonia.Int J Mol Sci. 2017 Feb 19;18(2):447. doi: 10.3390/ijms18020447. Int J Mol Sci. 2017. PMID: 28218726 Free PMC article. Review.
-
Biomarkers and community-acquired pneumonia: tailoring management with biological data.Semin Respir Crit Care Med. 2012 Jun;33(3):266-71. doi: 10.1055/s-0032-1315638. Epub 2012 Jun 20. Semin Respir Crit Care Med. 2012. PMID: 22718212 Review.
Cited by
-
A multimodal integration pipeline for accurate diagnosis, pathogen identification, and prognosis prediction of pulmonary infections.Innovation (Camb). 2024 May 22;5(4):100648. doi: 10.1016/j.xinn.2024.100648. eCollection 2024 Jul 1. Innovation (Camb). 2024. PMID: 39021525 Free PMC article.
-
Dysregulated proteasome activity and steroid hormone biosynthesis are associated with mortality among patients with acute COVID-19.J Transl Med. 2024 Jul 4;22(1):626. doi: 10.1186/s12967-024-05342-0. J Transl Med. 2024. PMID: 38965561 Free PMC article.
-
Single-cell landscape revealed immune characteristics associated with disease phases in brucellosis patients.Imeta. 2024 Jul 23;3(4):e226. doi: 10.1002/imt2.226. eCollection 2024 Aug. Imeta. 2024. PMID: 39135683 Free PMC article.
-
Single-cell profiling reveals distinct immune response landscapes in tuberculous pleural effusion and non-TPE.Front Immunol. 2023 Jun 26;14:1191357. doi: 10.3389/fimmu.2023.1191357. eCollection 2023. Front Immunol. 2023. PMID: 37435066 Free PMC article.
-
Uncovering host response in adults with severe community-acquired pneumonia: a proteomics and metabolomics perspective study.World J Emerg Med. 2025 May 1;16(3):248-255. doi: 10.5847/wjem.j.1920-8642.2025.063. World J Emerg Med. 2025. PMID: 40406290 Free PMC article.
References
MeSH terms
Substances
Grants and funding
LinkOut - more resources
Full Text Sources
Medical
Research Materials
Miscellaneous
