. 2023 Mar;615(7951):285-291.
doi: 10.1038/s41586-023-05752-y. Epub 2023 Mar 1.

Evolution of the germline mutation rate across vertebrates

Affiliations

Evolution of the germline mutation rate across vertebrates

Lucie A Bergeron et al. Nature. 2023 Mar.

Abstract

The germline mutation rate determines the pace of genome evolution and is an evolving parameter itself1. However, little is known about what determines its evolution, as most studies of mutation rates have focused on single species with different methodologies2. Here we quantify germline mutation rates across vertebrates by sequencing and comparing the high-coverage genomes of 151 parent-offspring trios from 68 species of mammals, fishes, birds and reptiles. We show that the per-generation mutation rate varies among species by a factor of 40, with mutation rates being higher for males than for females in mammals and birds, but not in reptiles and fishes. The generation time, age at maturity and species-level fecundity are the key life-history traits affecting this variation among species. Furthermore, species with higher long-term effective population sizes tend to have lower mutation rates per generation, providing support for the drift barrier hypothesis3. The exceptionally high yearly mutation rates of domesticated animals, which have been continually selected on fecundity traits including shorter generation times, further support the importance of generation time in the evolution of mutation rates. Overall, our comparative analysis of pedigree-based mutation rates provides ecological insights on the mutation rate evolution in vertebrates.


Conflict of interest statement

The authors declare no competing interests.

Figures

Fig. 1
Fig. 1. Variation in GMRs and their association with life-history traits across 68 vertebrate species.
a, The phylogenetic tree of 68 species is based on UCE data and is calibrated with fossil data at 14 nodes (see Methods; Extended Data Fig. 3 and Supplementary Fig. 8). The average pedigree-based mutation rates per generation for each species, which are represented by the squares, show 40-fold variation among species. The 95% binomial confidence intervals are shown, and individual trios are represented by round points. See Supplementary Table 8 and Extended Data Fig. 4 for a comparison with published estimated rates of closely related species. b, The per-generation mutation rate is significantly associated with the average parental age at the time of offspring production across all individuals with known paternal age (105 trios), using linear regression. For birds, this relationship is statistically significant after removing a single outlier, the Darwin’s rhea. c, The male-to-female contribution ratio (α) is estimated for groups of vertebrates having at least 30 mutations phased to their parents of origin in each group. The highest male bias (7.6:1) is found in two bird lineages, whereas fishes and reptiles show negligible male bias. The data are represented with 95% confidence intervals based on the binomial variance. The silhouette of Syngnathus scovelli was created by J.S. All other silhouettes are from PhyloPic (http://phylopic.org), except for one of the silhouettes of Sarcophilus harrisii, which was created by S. Werning, and the silhouette of Pan troglodytes, which was created by T. M. Keesey (vectorization) and T. Hisgett (photography); both are available under a CC-BY 3.0 licence (https://creativecommons.org/licenses/by/3.0).
Fig. 2
Fig. 2. GMRs are associated with long-term substitution rates.
a,b, There is a positive association between the modelled yearly pedigree-based mutation rates and the macroevolutionary substitution rates when using phylogenetic regression (PGLS) on both UCEs and their flanking sequences (a) and whole-genome alignments (WGAs) (b). The grey dashed lines indicate equality. See Extended Data Fig. 5 for plots of the same data on a log scale and Extended Data Fig. 6 for a comparison of UCE and WGA methods.
Fig. 3
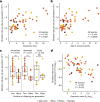
Fig. 3. Predictors of interspecific variation in GMRs.
ac, Significant positive associations are found using phylogenetic regression (PGLS) between the modelled per-generation mutation rates and three life-history traits: species-specific mean generation time (a), age at sexual maturity (b) and the number of offspring per generation (c). In total there are 55 species with modelled per-generation rates, including 32 mammalian and 15 avian species. The box plot in c represents the median, the interquartile range and the maximum and minimum excluding outliers. d, Species-specific average per-generation mutation rates are negatively associated with the harmonic mean of the effective population size (Ne) over the past 1 million years, using phylogenetic regression (PGLS).
Fig. 4
Fig. 4. The yearly GMRs are higher in domesticated species than in non-domesticated species.
a, Yearly GMRs are significantly higher in domesticated or farmed species than in wild species (using phylogenetic regression (PGLS) on a total of 68 species). b, Using the modelled mutation rate instead (using phylogenetic regression (PGLS) on a total number of 55 species) shows that there is no difference in yearly GMRs between domesticated and non-domesticated animals, suggesting that this difference is mainly driven by the shorter generation time of domesticated species. The box plots represent the median, the interquartile range and the maximum and minimum excluding outliers.
Extended Data Fig. 1
Extended Data Fig. 1. Association of parental ages.
Maternal and paternal ages are significantly positively correlated for the 105 trios with known parental age at reproduction (linear regression; adjusted r2 = 0.77, F = 342.3 on 1 and 103 DF, p < 2.2 × 10⁻¹⁶).
Extended Data Fig. 2
Extended Data Fig. 2. Comparison of published male bias estimates (α) using genome alignments and our male bias estimates (modified Fig. 1c of the main text).
The yellow points are α estimates from Wilson Sayres et al., and the purple points are α estimates from Wu et al.. Most of the common species reveal similar estimates with overlapping 95% confidence intervals. However, the estimates of α based on genome alignments are generally lower for dogs and cats than our estimates, yet the pedigree-based estimate of α for cats (Wang et al.; green point) is similar to our estimate. See also Supplementary Table 5. The barplots represent male biases estimated by clustering different species per group (to have a minimum of 30 phased mutations per group) and the 95% confidence intervals were based on the binomial distribution. The silhouette of Sygnathus was created by J.S. All other silhouettes are from PhyloPic (http://phylopic.org), except one of the silhouettes of Sarcophilus harrissi, which was created by S. Werning, and the silhouette of Pan troglodytes, which was created by T. M. Keesey (vectorization) and T. Hisgett (photography); both are available under a CC-BY 3.0 licence (https://creativecommons.org/licenses/by/3.0).
Extended Data Fig. 3
Extended Data Fig. 3. Robustness of the calibration.
We compared the estimated substitution rates using the 14 initial calibration points with the inferred substitution rates using only 13 calibration points (with 14 iterations to remove each calibration node one by one). We found a strong relationship between the rates estimated with 14 and 13 calibrations (linear regression adjusted r2 = 0.91, F = 9416 on 1 and 950 DF, p-value: < 2.2 × 10⁻¹⁶). However, some of the calibration points had a stronger impact on the estimated substitution rates. For instance, removing the two bird nodes (7 and 10), the gekko node (9), the Canidae/Arctoidea node (13) and the Glires/Primate node (8) altered some of the substitution rate estimates.
Extended Data Fig. 4
Extended Data Fig. 4. Per-generation mutation rates (similar to Fig. 1a) including published data on closely related species.
For each species, the colored squares represent the average per-generation observed rate, along with the 95% confidence intervals based on the binomial distribution, and the black points represent published estimates from similar or closely related species to those included in our dataset. For most of the species, these estimates lie within the 95% confidence intervals of our estimates. Published estimates are from: Felis catus (Wang et. al.), Mus musculus (Milholland et al., Lindsay et al.), Pan troglodytes (Venn et al., Tatsumoto et al., Besenbacher et al.), Homo sapiens (Conrad et al., Kong et al., Francioli et al., Rahbari et al., Wong et al., Jónsson et al., Maretty et al., Turner et al., Sasani et al., Kessler et al.). The closely related species are from: close to the Salmo salar, Clupea harengus (Feng et al.), close to Paralichthys olivaceus, the Cichlid (Malinsky et al.), close to Canis lupus familiaris, Canis lupus (Koch et al.), close to Capra hircus, Bos taurus (Harland et al.), close to Mandrillus leucophaeus, Papio anubis (Wu et al.), Macaca mulatta (Wang et al., Bergeron et al.), and Chlorocebus sabaeus (Pfeifer), close to Saimiri boliviensis boliviensis, Aotus nancymaae (Thomas et al.), close to Monodelphis domestica, Ornithorhynchus anatinus (Martin et al.), close to Taeniopygia guttata, Ficedula albicollis (Smeds et al.). See also Supplementary Table 8. The silhouette of Sygnathus was created by J.S. All other silhouettes are from PhyloPic (http://phylopic.org), except one of the silhouettes of S. harrissi, which was created by S. Werning, and the silhouette of P. troglodytes, which was created by T. M. Keesey (vectorization) and T. Hisgett (photography); both are available under a CC-BY 3.0 licence (https://creativecommons.org/licenses/by/3.0).
Extended Data Fig. 5
Extended Data Fig. 5. Germline mutation rates are associated with long-term substitution rates.
This figure is similar to the main Fig. 2 but uses phylogenetic regression (PGLS) on a log scale. The grey dashed lines indicate equality. a. Using a log scale, there is a significant positive correlation between the per-year rates and the rates derived from Ultraconserved elements (UCEs) and their flanking sequences. b. However, this correlation is not significant when comparing the per-year rates with the rates derived from the whole genome alignments (WGAs).
Extended Data Fig. 6
Extended Data Fig. 6. Comparison of substitution rates estimated with Ultra Conserved Elements (UCEs) and MultiZ alignments.
The substitution rates estimated with the two methods are highly correlated (linear regression: adjusted r2 = 0.73, F = 179.9 on 1 and 66 DF, p < 2.2 × 10⁻¹⁶).
Extended Data Fig. 7
Extended Data Fig. 7. Three life-history traits are not significantly associated with the per-generation mutation rate.
a. lifespan in the wild, b. body mass and c. the mating system (polygamy versus monogamy). The total number of species with modeled per-generation rate was 55 for the phylogenetic regression (PGLS). The boxplots represent the median, the interquartile range, and the maximum and minimum excluding outliers.
Extended Data Fig. 8
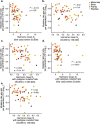
Extended Data Fig. 8. The drift barrier hypothesis on different times and different mutation rate parameters used to estimate Ne with phylogenetic regression (PGLS).
a. The correlation between Ne and the mutation rate per generation is not significant when using the most recent value before 30,000 years estimated by PSMC. b. The relationship is also not significant when using the harmonic mean over a more recent period of time (30,000 years to 130,000 years ago). However, this relationship is significant for mammals (adjusted r2 = 0.104, p = 0.04). We used the harmonic mean over the past million years in the main text, as PSMC is not reliable over recent periods. c. When looking at the relationship between the mutation rate and Ne, estimated using the pedigree-based mutation rate, we find a stronger signal over the past 1,000,000 years, probably due to the circularity of this analysis. d. However, the relationship is still not significant when using the most recent time point or e. the average over the past 100,000 years.
Extended Data Fig. 9
Extended Data Fig. 9. Effective population sizes calculated with two different methods (see main text) are significantly correlated.
The harmonic mean of the population size estimated with PSMC from 30,000 to 1,000,000 years ago is significantly correlated with the effective population size estimated from Ne = π/4μ (linear regression: adjusted r2 = 0.83, F = 316.3 on 1 and 63 DF, p < 2.2 × 10⁻¹⁶).

Similar articles

Cited by

References

    1. Lynch M, et al. Genetic drift, selection and the evolution of the mutation rate. Nat. Rev. Genet. 2016;17:704–714. doi: 10.1038/nrg.2016.104. - DOI - PubMed
    1. Bergeron LA, et al. The mutationathon highlights the importance of reaching standardization in estimates of pedigree-based germline mutation rates. eLife. 2022;11:e73577. doi: 10.7554/eLife.73577. - DOI - PMC - PubMed
    1. Lynch M. Evolution of the mutation rate. Trends Genet. 2010;26:345–352. doi: 10.1016/j.tig.2010.05.003. - DOI - PMC - PubMed
    1. Acuna-Hidalgo R, Veltman JA, Hoischen A. New insights into the generation and role of de novo mutations in health and disease. Genome Biol. 2016;17:241. doi: 10.1186/s13059-016-1110-1. - DOI - PMC - PubMed
    1. Sturtevant AH. Essays on evolution. I. On the effects of selection on mutation rate. Q. Rev. Biol. 1937;12:464–467. doi: 10.1086/394543. - DOI

Publication types