. 2023 Mar;615(7951):300-304.
doi: 10.1038/s41586-023-05750-0. Epub 2023 Mar 1.

Coordination of bacterial cell wall and outer membrane biosynthesis

Affiliations

Coordination of bacterial cell wall and outer membrane biosynthesis

Katherine R Hummels et al. Nature. 2023 Mar.

Abstract

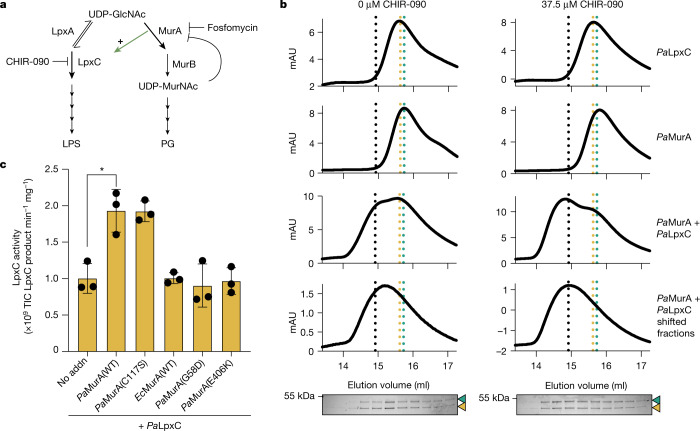
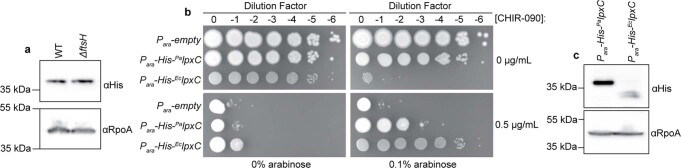
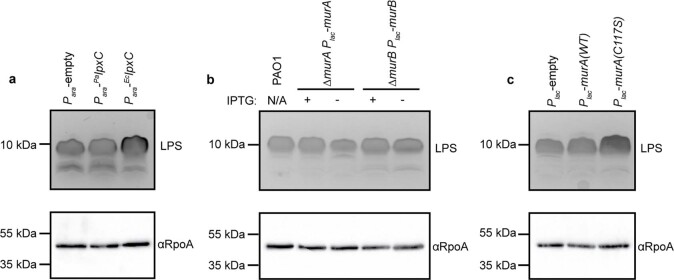
Gram-negative bacteria surround their cytoplasmic membrane with a peptidoglycan (PG) cell wall and an outer membrane (OM) with an outer leaflet composed of lipopolysaccharide (LPS)1. This complex envelope presents a formidable barrier to drug entry and is a major determinant of the intrinsic antibiotic resistance of these organisms2. The biogenesis pathways that build the surface are also targets of many of our most effective antibacterial therapies3. Understanding the molecular mechanisms underlying the assembly of the Gram-negative envelope therefore promises to aid the development of new treatments effective against the growing problem of drug-resistant infections. Although the individual pathways for PG and OM synthesis and assembly are well characterized, almost nothing is known about how the biogenesis of these essential surface layers is coordinated. Here we report the discovery of a regulatory interaction between the committed enzymes for the PG and LPS synthesis pathways in the Gram-negative pathogen Pseudomonas aeruginosa. We show that the PG synthesis enzyme MurA interacts directly and specifically with the LPS synthesis enzyme LpxC. Moreover, MurA was shown to stimulate LpxC activity in cells and in a purified system. Our results support a model in which the assembly of the PG and OM layers in many proteobacterial species is coordinated by linking the activities of the committed enzymes in their respective synthesis pathways.


Conflict of interest statement

The authors declare no competing interests.

Figures

Fig. 1
Fig. 1. PaMurA interacts with and activates PaLpxC.
a, Schematic representation of the biosynthetic pathways responsible for PG and LPS biosynthesis, showing the committed enzymes MurA and LpxC, and other relevant enzymes (LpxA and MurB). T-bars indicate inhibition by the antibiotics fosfomycin and CHIR-090. The green arrow indicates activation of LpxC by MurA. b, Size-exclusion chromatography in which 7.5 µM of purified F–LpxC and H–MurA were resolved either individually or as a mixture in the presence or absence of 37.5 µM CHIR-090 as indicated. The shifted F–LpxC + H–MurA fractions were subsequently collected, resubjected to size-exclusion chromatography, and the resulting fractions were resolved by SDS–PAGE followed by Coomassie staining. Dotted lines indicate the peak mobilities for F–LpxC (gold), H–MurA (cyan) or the shifted F–LpxC + H–MurA fractions (black) in the presence of CHIR-090. The mobilities of H–MurA and F–LpxC in SDS–PAGE assays are indicated by a cyan or gold arrowhead, respectively. Data are representative of two replicates. For gel source data, see Supplementary Fig. 1. c, Catalytic activity (total ion counts (TIC)) of purified PaLpxC (100 nM) alone (no addition (No addn)) or in the presence of MurA variants (100 nM). Dots indicate the values obtained for three individual replicates, bars indicate the mean, and error bars represent their standard deviation. *P = 0.0109 (unpaired, two-tailed t-test). Source Data
Fig. 2
Fig. 2. PaMurA(C117S) is a potent activator of PaLpxC in vivo.
a, Viability assay in which serial dilutions of PAO1 harbouring an empty plasmid or the indicated PamurA variant under IPTG-inducible control were plated on LB agar with or without IPTG supplementation as indicated. Data are representative of three biological replicates. b, Ratio of LpxC product to substrate detected by liquid chromatography–mass spectrometry in the aqueous fraction of methanol–chloroform-extracted P. aeruginosa whole-cell lysates. Dots indicate the values obtained for three biological replicates, bars indicate the mean, and error bars represent their standard deviation. c, Model structure of the PaLpxC–PaMurA complex predicted by AlphaFold. PaLpxC is represented in gold and PaMurA is represented in cyan. PaMurA residues G58 and E406 are highlighted in red and residue C117 is highlighted in navy. PaLpxC active-site residues are depicted in orange. Source Data
Fig. 3
Fig. 3. Direct interaction between LpxC and MurA is observed in diverse bacteria.
a, MurA–LpxC interaction scores calculated from a direct coupling analysis-based approach (Methods) plotted on a maximum-likelihood phylogenetic tree based on concatenated MurA and LpxC sequences generated with FastTree. Experimentally tested interactions are highlighted. b, Purified F–LpxC (2.5 µM) was mixed in a 1:1 ratio with purified H–MurA in the presence or absence of CHIR-090 (5.7 µM) as indicated. The mixtures were pulled down with anti-Flag resin and the input and eluate were subjected to SDS–PAGE and Coomassie staining. Mobilities of H–MurA and F–LpxC are indicated by a cyan or gold arrowhead, respectively. Data are representative of at least two replicates. For gel source data, see Supplementary Fig. 1. Source Data
Extended Data Fig. 1
Extended Data Fig. 1. Regulation of LpxC in P. aeruginosa differs from that observed in E. coli.
(a) Anti-His immunoblot detecting H-PaLpxC expressed from the native chromosomal locus in wild-type cells or an ftsH deletion mutant. A corresponding blot for RpoA was used as a loading control. Data are representative of 3 biological replicates. (b) Spot titer assay in which serial dilutions of PAO1 harboring an empty plasmid or one encoding His-PalpxC or His-EclpxC under arabinose-inducible control were plated on LB agar supplemented with arabinose and/or the LpxC inhibitor CHIR-090 as indicated. Plates were incubated at 37 °C for 20 h before being imaged. Data are representative of 3 biological replicates. (c) Anti-His immunoblot analysis of His-PaLpxC or His-EcLpxC protein levels in exponentially growing PAO1. Immunoblot for RpoA serves as a loading control. Data are representative of 3 biological replicates. For gel source data, see Supplementary Fig. 1.
Extended Data Fig. 2
Extended Data Fig. 2. LPS levels are altered upon mis-regulation of LpxC.
Silver stain of LPS harvested from exponentially growing cultures and western blot of RpoA from the same samples as a loading control. (a) PAO1 harboring an empty plasmid or one encoding PalpxC or EclpxC under arabinose-inducible control were induced with 0.1% arabinose 1 h prior to harvesting samples. (b) PAO1, PA1118 [∆murA Plac-murA], or PA1135 [∆murB Plac-murB] were grown in the presence or absence of 1 mM IPTG as indicated before samples were processed. (C) PAO1 harboring an empty plasmid or one encoding PamurA(WT) or PamurA(C117S) under IPTG-inducible control were induced with 1 mM IPTG 1 h prior to harvesting samples. Data are representative of 3 biological replicates. For gel source data, see Supplementary Fig. 1.
Extended Data Fig. 3
Extended Data Fig. 3. MurA is essential and its depletion phenocopies simultaneous inhibition of PG and LPS biosynthesis.
(a–c) Growth curves of P. aeruginosa strains in LB with or without IPTG as indicated. Dots represent the average of 3 biological replicates and dashed lines indicate the standard deviation. The following strains were used: (a) PAO1 [WT] and PA1080 [∆PA4701], (b,c) PAO1 [WT], PA1118 [∆murA Plac-murA], and PA1135 [∆murB Plac-murB]. (d) Phase contrast images of P. aeruginosa cells after 1 hr treatment with the indicated antibiotic(s). Scale bar indicates 2 µm. Data are representative of at least 2 biological replicates (e) Phase contrast images of the indicated P. aeruginosa murA or murB depletion strains grown for 4 h in the presence or absence of inducer as indicated. MurB depletion was analyzed as a control to compare the phenotype of inactivating another early step in PG synthesis with that of MurA. Scale bar indicates 2 µm. Data are representative of at least 3 biological replicates (f) Quantification of cell width after 1 hr treatment with the indicated antibiotic(s) or after depletion of MurA or MurB. Each dot represents an individual cell and the median of the population is indicated by a black line. n indicates the number of cells analyzed. For each condition, the cells quantified were derived from a single population and data are representative of biological duplicates. Source Data
Extended Data Fig. 4
Extended Data Fig. 4. PaMurA interacts with PaLpxC.
(a) H-PaLpxC in vivo pulldowns. The expression status of H-PaLpxC and F-PaMurA before (input) and after (elution) co-affinity purification using Ni-NTA resin is indicated above the immunoblots. The variant of F-PaMurA produced is indicated by WT for F-PaMurA(WT) or * for F-PaMurA(C117S). When indicated, 0.5 µg/mL CHIR-090 was added to cultures 1 hr prior to harvesting and was maintained in all lysis and wash buffers as detailed in the methods section. The following strains were used to generate the lysates: PA239 (lane 1), PA1013 (lane 2), PA1068 (lane 3), PA1071 (lanes 4 and 6), and PA1121 (lanes 5 and 7). Data are representative of at 3 biological replicates. (b) Purified F-PaLpxC (2.5 µM) was mixed in a 1:1 ratio with purified H-MurA variants in the presence or absence of CHIR-090 (5.7 µM) as indicated. The mixtures were pulled down with anti-FLAG resin and the input and elution subjected to SDS-PAGE and Coomassie staining. Mobilities of H-MurA and F-LpxC are indicated by a cyan or gold carrot, respectively. Data are representative of 3 replicates. For gel source data, see Supplementary Fig. 1.
Extended Data Fig. 5
Extended Data Fig. 5. Purified proteins used in this study and linearity of LpxC activity assay.
(a) Purified proteins used in this study were resolved by SDS-PAGE and protein was visualized with Coomassie staining. Data are representative of at least two 2 replicates. For gel source data, see Supplementary Fig. 1. (b) Time course in which turnover of UDP-3-O-(R-3-hydroxydecanoyl)-N-acetylglucosamine (PaLpxC substrate) to UDP-3-O-(R-3-hydroxydecanoyl)-glucosamine (PaLpxC product) by FLAG-PaLpxC over the course of 20 min was monitored by LC-MS. The R2 value of the linear regression is presented. Source Data
Extended Data Fig. 6
Extended Data Fig. 6. Mutations in the PaMurA active site are toxic but can be suppressed by inhibition of PaLpxC.
(a) Spot titer assay in which serial dilutions of PAO1 harboring an empty vector, one encoding PaMurA(WT) or the indicated PaMurA variant were plated on LB agar supplemented with IPTG and/or CHIR-090 as indicated. Plates were incubated at 37 °C for 20 h before imaging. indicates the presence of a silent mutation in the construct. See Table S2 for details. Data are representative of 3 biological replicates. (b) Crystal structure of E. cloacae MurA (PDB 1EJC) in which residues corresponding to the identified PaMurA dominant negative alleles are depicted in gold spheres, or in the case of Cys117, a red sphere. Note that the substitutions all cluster around the active site. (c) MurA activity assay in which purified PaMurA variants (100 nM) were mixed with UDP-GlcNAc (1 mM) and PEP (0.5 mM) and the release of Pi was measured by Lanzetta assay. Dots indicate the values obtained for three individual replicates, bars indicate the mean, and error bars represent their standard deviation. (d) Catalytic activity of purified PaLpxC (100 nM) alone or in the presence of MurA variants (100 nM) assayed by conversion of UDP-3-O-(R-3-hydroxydecanoyl)-N-acetylglucosamine (PaLpxC substrate) to UDP-3-O-(R-3-hydroxydecanoyl)-glucosamine (PaLpxC product). Dots indicate the values obtained for three individual replicates, bars indicate the mean, and error bars represent their standard deviation. (e) LpxC enzymatic activity detected from preparation of MurA variants (100 nM) alone assayed as in panel d. Dots indicate the values obtained for three individual replicates, bars indicate the mean, and error bars represent their standard deviation. Source Data
Extended Data Fig. 7
Extended Data Fig. 7. LC-MS/MS analysis of PaLpxC substrate and product.
(a) Chemical structure of the PaLpxC substrate. The acetyl moiety removed by LpxC is highlighted in gold. Boxed regions indicate putative fragment ions highlighted in panels c, d, and h-j. (b) Extracted ion chromatogram (EIC) of UDP-3-O-(R-3-hydroxydecanoyl)-N-acetylglucosamine (PaLpxC substrate, 776.1986 m/z, black line) and UDP-3-O-(R-3-hydroxydecanoyl)-glucosamine (PaLpxC product, 734.1872 m/z, gold line) derived from in vitro reaction mixtures containing the PaLpxC substrate along with purified PaLpxC and PaMurA resolved using LC-MS operating in negative mode. The dashed lines indicate the peaks assigned to the PaLpxC substrate (S) and PaLpxC product (P). (c—d) MS/MS spectrum associated with the panel b peaks S and P, respectively. The parent ion is indicated by an asterisk and fragment ions corresponding to those highlighted in panel a are labeled. (e-g) EICs PaLpxC product and PaLpxC substrate detected by LC-MS in the aqueous fraction of methanol-chloroform extracted whole cell lysates. The dashed lines indicate the peak assigned to the PaLpxC substrate (S) and PaLpxC product peaks (P1 and P2). Note that the PaLpxC product has been previously reported to resolve as two peaks, both of which were integrated to infer the relative product abundance. Data are representative of biological triplicates. (h-j) MS/MS spectrum associated with the panel g peaks S, P1, and P2, respectively. The parent ion is indicated by an asterisk and fragment ions corresponding to those highlighted in panel a are labeled. Source Data
Extended Data Fig. 8
Extended Data Fig. 8. MurA(G58D) and MurA(E406K) impact binding and activation of PaLpxC.
(a) Anti-FLAG immunoblot detecting F-PaMurA variants after 1 h of induction with 1 mM IPTG. A corresponding blot for RpoA was used as a loading control. Data are representative of 3 biological replicates. (b) MurA activity assay in which purified PaMurA variants (100 nM) were mixed with UDP-GlcNAc (1 mM) and PEP (0.5 mM) and the release of Pi was measured by Lanzetta assay. Dots indicate the values obtained for three individual replicates, bars indicate the mean, and error bars represent their standard deviation. The dashed line indicates the average catalytic activity of PaMurA(C117S) observed in Fig S7C. (c) in vitro pulldowns in which purified F-PaLpxC and H-MurA variants were mixed in a 1:1 ratio in the presence or absence of CHIR-090 and processed as in Extended Data Fig. 4b. Data are representative of at least two replicates. (d) Spot titer assay in which serial dilutions of a PAO1 strain harboring a PamurA deletion or PamurA(C117S) allele at the native locus complemented by a chromosomally-integrated, IPTG-inducible copy of PamurA(WT) were plated on LB agar with the indicated supplements. As indicated, the strains also contained an empty plasmid or one encoding PamurA(G58D) under arabinose-inducible control. Plates were incubated at 37oC for 20 h before being photographed. Data are representative of 3 biological replicates. For gel source data, see Supplementary Fig. 1. Source Data
Extended Data Fig. 9
Extended Data Fig. 9. PaLpxC and PaMurA are predicted to interact.
(a,b) AlphaFold2 predicted aligned error matrices of the PaLpxC/PaMurA complex and EcLpxC/EcMurA complex structures, respectively. (c) Distribution of initial interaction scores among all LpxC and MurA pairs analyzed. Red bars indicate the sequences used to train the final EVcomplex model and the score corresponding to the PaLpxC/PaMurA pair is indicated by a dashed line. (d) Model structure of the PaLpxC/PaMurA complex predicted by AlphaFold2. PaLpxC is represented in gold and PaMurA is represented in cyan. The top six intermolecular couplings between LpxC/MurA residues from the final EVcomplex model are highlighted in red with red lines connecting the coupling pairs. (e) Distribution of final interaction scores among all LpxC and MurA pairs analyzed. The data fit a two-component Gaussian mixture model (black line) indicating the presence of a population with low interaction scores (blue line) and high interaction scores (orange line). (f) Catalytic activity of purified LpnLpxC (100 nM) alone or in the presence of LpnMurA (200 nM) assayed by conversion of UDP-3-O-(R-3-hydroxydecanoyl)-N-acetylglucosamine to UDP-3-O-(R-3-hydroxydecanoyl)-glucosamine. Dots indicate the values obtained for three individual replicates, bars indicate the mean, and error bars represent their standard deviation. (g) Catalytic activity of purified EcLpxC (100 nM) alone or in the presence of EcMurA (200 nM) assayed by conversion of UDP-3-O-(R-3-hydroxydecanoyl)-N-acetylglucosamine to UDP-3-O-(R-3-hydroxydecanoyl)-glucosamine. Dots indicate the values obtained for three individual replicates, bars indicate the mean, and error bars represent their standard deviation. Source Data

References

    1. Silhavy TJ, Kahne D, Walker S. The bacterial cell envelope. Cold Spring Harb. Perspect. Biol. 2010;2:a000414. doi: 10.1101/cshperspect.a000414. - DOI - PMC - PubMed
    1. Zgurskaya HI, Lopez CA, Gnanakaran S. Permeability barrier of Gram-negative cell envelopes and approaches to bypass it. ACS Infect. Dis. 2015;1:512–522. doi: 10.1021/acsinfecdis.5b00097. - DOI - PMC - PubMed
    1. Bush K. Antimicrobial agents targeting bacterial cell walls and cell membranes. Rev. Sci. Tech. 2012;31:43056. doi: 10.20506/rst.31.1.2096. - DOI - PubMed
    1. Ogura T, et al. Balanced biosynthesis of major membrane components through regulated degradation of the committed enzyme of lipid A biosynthesis by the AAA protease FtsH (HflB) in Escherichia coli. Molec. Microbiol. 1999;31:833–844. doi: 10.1046/j.1365-2958.1999.01221.x. - DOI - PubMed
    1. Klein G, Kobylak N, Lindner B, Stupak A, Raina S. Assembly of lipopolysaccharide in Escherichia coli requires the essential LapB heat shock protein. J. Biol. Chem. 2014;289:14829–14853. doi: 10.1074/jbc.M113.539494. - DOI - PMC - PubMed

Publication types

MeSH terms

Substances