. 2023 Mar;615(7951):292-299.
doi: 10.1038/s41586-023-05748-8. Epub 2023 Mar 1.

Cardiogenic control of affective behavioural state

Affiliations

Cardiogenic control of affective behavioural state

Brian Hsueh et al. Nature. 2023 Mar.

Abstract

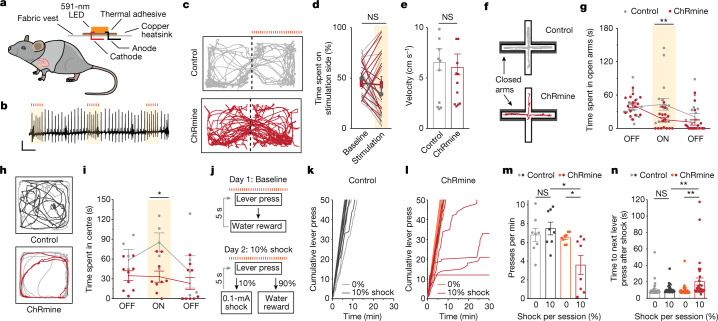
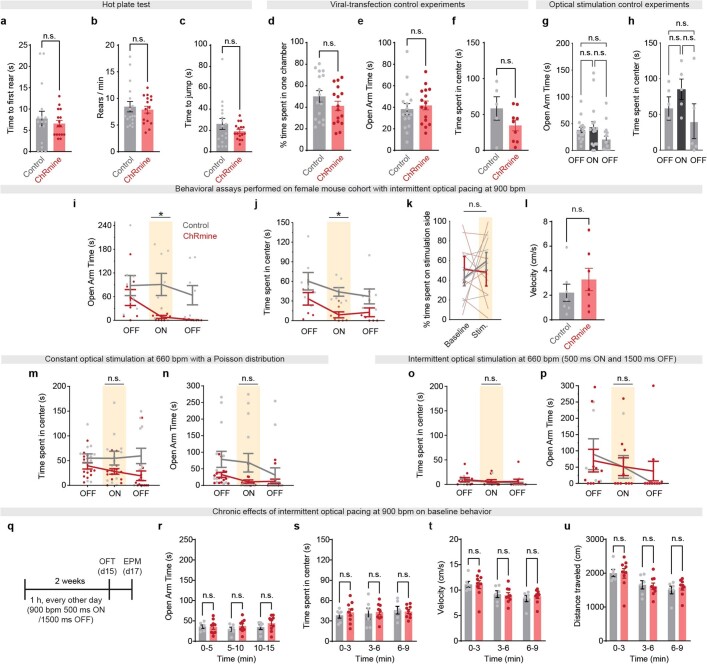
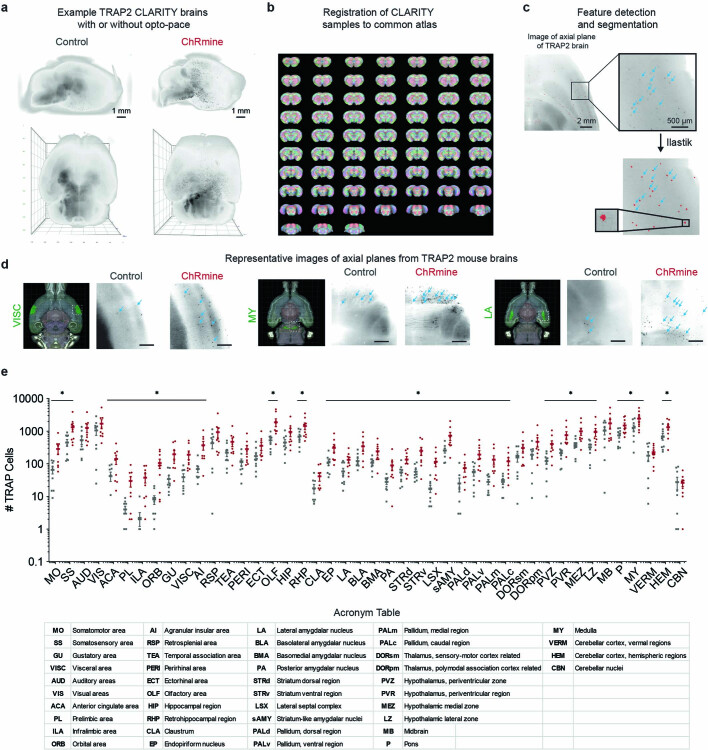
Emotional states influence bodily physiology, as exemplified in the top-down process by which anxiety causes faster beating of the heart1-3. However, whether an increased heart rate might itself induce anxiety or fear responses is unclear3-8. Physiological theories of emotion, proposed over a century ago, have considered that in general, there could be an important and even dominant flow of information from the body to the brain9. Here, to formally test this idea, we developed a noninvasive optogenetic pacemaker for precise, cell-type-specific control of cardiac rhythms of up to 900 beats per minute in freely moving mice, enabled by a wearable micro-LED harness and the systemic viral delivery of a potent pump-like channelrhodopsin. We found that optically evoked tachycardia potently enhanced anxiety-like behaviour, but crucially only in risky contexts, indicating that both central (brain) and peripheral (body) processes may be involved in the development of emotional states. To identify potential mechanisms, we used whole-brain activity screening and electrophysiology to find brain regions that were activated by imposed cardiac rhythms. We identified the posterior insular cortex as a potential mediator of bottom-up cardiac interoceptive processing, and found that optogenetic inhibition of this brain region attenuated the anxiety-like behaviour that was induced by optical cardiac pacing. Together, these findings reveal that cells of both the body and the brain must be considered together to understand the origins of emotional or affective states. More broadly, our results define a generalizable approach for noninvasive, temporally precise functional investigations of joint organism-wide interactions among targeted cells during behaviour.


Conflict of interest statement

The authors declare no competing interests.

Figures

Fig. 1
Fig. 1. Development of a noninvasive optical pacemaker.
a, Schematic showing the optical control of cardiac rhythm with an external light source enabled by retro-orbital injection of AAV9-mTNT::ChRmine-p2A-oScarlet. b, Confocal cross-section images indicating homogeneous transgene expression of ChRmine-p2A-oScarlet (red) with DAPI staining (blue) in atria and ventricles. Scale bars, 1 mm (main); 100 µm (inset). c, Example electrocardiogram (ECG) trace with optical pacing using 589 nm light delivered at 15 Hz (at 900 bpm) with a pulse width of 10 ms and irradiance of 160 mW mm−2. Scale bar, 500 ms. Inset traces: ECG signal before and after light delivery (grey) and at light onset and cessation (red). Scale bar, 50 ms, 0.5 mV. d, Reliability of photoactivated QRS complexes at 900 bpm as a function of cutaneous optical irradiance (n = 6 mice). e, Example ECG traces of individual 10-ms optical pulses. Grey arrowheads indicate P waves associated with sinus rhythm, which are overridden (red arrowheads) during optical pacing. Scale bar, 25 ms, 0.25 mV. f, Example ECG traces of pacing at 600, 800 and 1,000 bpm. Scale bar, 50 ms, 0.5 mV. The shaded area indicates the period of illumination at the specified frequency at 100% duty cycle. g, Characterization of optical pacing fidelity, showing stimulation frequency versus ECG-measured heart rate (n = 6 mice). All ECG measurements were performed in anaesthetized mice. Data are mean ± s.e.m.
Fig. 2
Fig. 2. Optically induced tachycardia increases anxiety-like behaviour.
a, Schematic of a micro-LED mounted to a wearable vest and fastened onto a mouse. b, Representative ECG trace of optically induced tachycardia (900 bpm for 500 ms every 2 s) used for all behavioural assays. Scale bar, 0.2 mV, 500 ms. c, Example path trace of a mouse with (red) or without (grey) ChRmine expression during an RTPP test, in which mice received optically induced cardiac pacing on one side of the chamber. d, Percentage of time spent on stimulation side during baseline and stimulation days for control (grey) and ChRmine-expressing (red) mice (n = 16 mice per group; two-way repeated-measures ANOVA with Bonferroni post hoc test: group (opsin) × time interaction F(1,30) = 2.29, P = 0.14; group (opsin) effect F(1,30) = 6.2 × 10−4, P = 0.98; time effect F(1,30) = 2.06, P = 0.16. Bonferroni post hoc: control versus ChRmine P = 0.71 (baseline day); P = 0.67 (stimulation day)). NS, not significant. e, Average velocity on the optically paced side during RTPP (n = 16 mice per group; unpaired two-tailed t-test, P = 0.81). f, Example path trace of control (grey) and ChRmine-expressing (red) mice during an EPM test with optical pacing during the 5-min ON epoch of a 15-min trial. Open arms are vertical; closed arms are horizontal and bordered in grey. g, Time spent in open arms during 5-min epochs of EPM exploration (n = 16 mice per group; two-way repeated-measures ANOVA with Bonferroni post hoc test: group (opsin) × time interaction F(2,60) = 3.906, P = 0.0254; group (opsin) effect F(1,30) = 3.297, P = 0.0794; time effect F(2,60) = 9.75, P = 0.0002. Bonferroni post hoc: ON epoch ChRmine versus control, **P = 0.0079). h, Example path trace of control (grey) and ChRmine-expressing (red) mice during an OFT with optical pacing during the 3-min ON epoch of a 9-min trial. i, Time spent in the centre during 3-min epochs of OFT exploration (n = 5 (control), 9 (ChRmine) mice; two-way repeated-measures ANOVA with Bonferroni post hoc test: group (opsin) × time interaction F(2,24) = 1.531, P = 0.024; group (opsin) effect F(1,12) = 5.69, P = 0.0035; time effect F(2,24) = 3.42, P = 0.049. Bonferroni post hoc: ON epoch ChRmine versus control, *P = 0.018). j, Vogel conflict task to assay for cardiogenic effects on operant behaviour. Water-restricted mice were first trained for 2–3 weeks until each mouse was able to complete the 50 water-reward lever-press trials over 30 min for at least 3 consecutive days. On the day of the behavioural task, mice received optical pacing while completing a total of 50 lever-press trials per session (day 1). On the subsequent day, a 10% pseudorandom chance of shock was introduced upon lever press (day 2). k,l, Cumulative lever presses during 0% (day 1) and 10% shock (day 2) sessions for control (k) and ChRmine-expressing (l) mice (n = 8 mice). m, Average lever-pressing rate during 0% baseline or 10% shock trial sessions (n = 8 mice per group; two-way repeated-measures ANOVA with Bonferroni post hoc test: group (opsin) × condition (shock) interaction F(1,14) = 8.326, P = 0.0120; group (opsin) effect F(1,14) = 7.39, P = 0.0166; condition (shock) effect F(1,14) = 3.162, P = 0.0971. Bonferroni post hoc: control 0% versus 10%, P = 0.8933; ChRmine 0% versus 10%, *P = 0.0106; 0% control versus ChRmine, P > 0.9999; 10% control versus ChRmine, **P = 0.0010). n, Elapsed time between a lever press resulting in shock and a subsequent lever press as a measure of the mouse’s apprehension state. On 10% shock trials, 3 out of 8 mice did not complete the trial, so the time to next lever press for some trials cannot be measured (n = 40, 40, 40 and 32 presses per group in control 0%, control 10%, ChRmine 0% and ChRmine 10%; two-way ANOVA with Bonferroni post hoc test: group (opsin) × condition (shock) interaction F(1,148) = 6.478, P = 0.0119; group (opsin) effect F(1,148) = 5.041, P = 0.0262; condition (shock) effect F(1,148) = 7.253, P = 0.0079. Bonferroni post hoc: control 0% versus 10%, P > 0.9999; ChRmine 0% versus 10%, **P = 0.0026; 0% control versus ChRmine, P > 0.9999; 10% control versus ChRmine, **P = 0.0074). Data are mean ± s.e.m.
Fig. 3
Fig. 3. Whole-brain screen for regions that are activated by optically induced tachycardia.
a, Schematic for whole-brain activity mapping to identify regions that are activated by optically paced tachycardia. Double-transgenic TRAP2;Ai14 reporter mice were injected with 4-hydroxytamoxifen (4TM) and treated with optically induced tachycardia for 15 min. After two weeks of tdTomato reporter gene expression, mice were euthanized and processed with CLARITY. Whole brains were imaged with a light-sheet microscope, followed by automated registration to a common brain atlas, cell segmentation and quantification to identify brain regions with differential accumulation of activated TRAP (tdTomato+) cells. b, Regional cell counts of paced (ChRmine, red) versus control (grey) cohorts sorted from anterior to posterior anatomical regions with select regions from the central autonomic network with increased TRAP cells and regions outside of the central autonomic network without statistical significance (n = 9 per group; multiple two-sided t-tests corrected for multiple comparisons with the Benjamini and Hochberg method (*false discovery rate (FDR) = 10%)). Significantly activated regions include the prefrontal cortex (ACA, PL and ILA), insular cortex (GUI, VISC and AI) and brainstem (P and MY). Non-significant regions include primary sensory cortices (AUD, VIS) and the cerebellum (VERM, CBN). c, Percentage of cells that are Fos+, determined from in situ hybridization for Fos mRNA (magenta) after cardiac pacing in control and ChRmine-expressing mice in the pIC (n = 4 mice per group; unpaired two-tailed t-test, *P = 0.020). Scale bars, 20 µm. d, Electrode tracks from n = 5 mice (3 ChRmine and 2 control) over 60 recording sessions co-registered to the common Allen Brain Atlas. e, Locations of recorded single units overlaid onto the Allen Brain Atlas. Red denotes units in the insular cortex. AP, anterior–posterior. f, Spike raster and changes in firing rate for three example insular neurons after 900-bpm pacing. g, Population-averaged changes in firing rate of insular neurons from ChRmine (red, n = 391) or control (grey, n = 228) mice (one-sided P values from hierarchical bootstrap: P = 0.026 (during 5 s pacing); P = 0.357 (during 5 s after pacing)). h, Average change in baseline firing rate per brain region across 5-s epochs during and after photostimulation in control (grey) and ChRmine-expressing (red) mice. Single units were obtained from the pIC (n = 228 (control), n = 391 (ChRmine)); somatosensory cortex (SS; n = 77 (control), n = 368 (ChRmine)); and striatum (STR; n = 70 (control), n = 800 (ChRmine)). One-sided P values from hierarchical bootstrap: pIC: P = 0.026 (stimulation; stim.), P = 0.36 (post-stimulation; post-stim.); SS: P = 0.0014 (stim.), P = 0.16 (post-stim.); STR: P = 0.29 (stim.), P = 0.036 (post-stim.). Data are mean ± s.e.m.
Fig. 4
Fig. 4. Optogenetic inhibition of the posterior insula attenuates the anxiogenic response from optical pacing.
a, Illustration of the experimental protocol for simultaneous optically induced tachycardia and optogenetic inhibition of the pIC or mPFC using AAVdj-hSyn::iC++-YFP or control virus (YFP only). b, Left, conditions for the Vogel conflict task, in which mice received both 473-nm constant illumination in the pIC or mPFC and optically induced tachycardia during the behavioural task. Right, illustration of the experimental protocol for simultaneous optogenetic inhibition of the pIC with optical pacing during the EPM test. c,d, Cumulative lever presses during baseline (day 1) and 10% shock (day 2) sessions for mice expressing control (YFP) (c) or iC++ (d) in the pIC with optical pacing (n = 6 mice per group). e, Cumulative number of lever presses completed in each session. Owing to increased apprehension, only 1 out of 6 control mice completed the 50-lever-press session on the 10% shock session (n = 6 per group; two-sided Wilcoxon rank-sum test, *P = 0.0152). f, Average lever-pressing rate for 0% and 10% shock experimental sessions. Note that iC++ inhibition partially restores overall rates of lever pressing, but not to baseline levels (n = 6 per group; two-way ANOVA with Bonferroni post hoc test: group × condition interaction F(1,10) = 5.533, P = 0.0405; group (opsin) effect F(1,10) = 7.439, P = 0.0213; condition (shock) effect F(1,10) = 67.8, P < 0.0001. Bonferroni post hoc: 0% shock YFP versus iC++, P > 0.9999; 10% shock YFP versus iC++, **P = 0.0036; YFP 0% versus 10% shock, ****P < 0.0001; iC++ 0% versus 10% shock, **P = 0.0039). g, Time to next lever press after shock. Note that iC++ inhibition reduces apprehension to no-shock levels (n = 30, 17, 30 and 30 presses per group in YFP 0%, YFP 10%, iC++ 0% and iC++ 10%; two-way ANOVA with Bonferroni post hoc test: group (opsin) × condition (shock) interaction F(1,103) = 8.7, P = 0.0039; group (opsin) effect F(1,103) = 8.6, P = 0.0041; condition (shock) effect F(1,103) = 35.6, P < 0.0001. Bonferroni post hoc: YFP 0% versus 10%, ****P < 0.0001; iC++ 0% versus 10%, P = 0.099; 0% YFP versus iC++, P > 0.9999; 10% YFP versus iC++, **P = 0.0011). h, Time spent in open arms during 5-min epochs of EPM exploration (n = 6 per group; two-way repeated-measures ANOVA with Bonferroni post hoc test: group (opsin) × time interaction F(2,20) = 3.543, P = 0.0482; group (opsin) effect F(1,10) = 1.251, P = 0.2894; time effect F(2,20) = 3.058, P = 0.0694. Bonferroni post hoc: ON epoch YFP versus iC++, *P = 0.0323). i,j, Cumulative lever presses with the same conditions as c,d but with expression of YFP (i) or iC++ (j) in the mPFC (n = 6 mice). k, Cumulative number of lever presses during each session. Note that in 10% shock sessions, both YFP- and iC++-expressing mPFC mice cease lever pressing (n = 6 per group; two-sided Wilcoxon rank-sum test, P = 0.2987). l, Average lever-pressing rate for 0% and 10% shock sessions (n = 6 per group; two-way repeated-measures ANOVA with Bonferroni post hoc test: group × condition interaction F(1,10) = 0.002521, P = 0.9609; group (opsin) effect F(1,10) = 0.4370, P = 0.5235; condition (shock) effect F(1,10) = 154.1, P < 0.0001. Bonferroni post hoc: 0% shock YFP versus iC++, P > 0.9999; 10% shock YFP versus iC++, P > 0.9999; YFP 0% versus 10% shock, ****P = 1.1 × 10−5; iC++ 0% versus 10% shock, ****P = 1.0 × 10−6). m, Time to next lever press after shock (n = 30, 22, 30 and 19 presses per group in mPFC YFP 0%, YFP 10%, iC++ 0% and iC++ 10%; two-way ANOVA with Bonferroni post hoc test: group (opsin) × condition (shock) interaction F(1,97) = 3.703, P = 0.05725; group (opsin) effect F(1,97) = 3.610, P = 0.0604; condition (shock) effect F(1,97) = 54.18, P < 0.000001. Bonferroni post hoc: YFP 0% versus 10%, ***P = 0.0009; iC++ 0% versus 10%, ****P = 2.95 × 10−8; 0% YFP versus iC++, P > 0.9999; 10% YFP versus iC++, P = 0.0698). n, Time spent in open arms during 5-min epochs of EPM exploration with (iC++, blue) and without (YFP, grey) mPFC inhibition (n = 6 per group; two-way repeated-measures ANOVA with Bonferroni post hoc test: group (opsin) × time interaction F(2,20) = 0.3929, P = 0.6802; group (opsin) effect F(1,10) = 0.00039, P = 0.9846; time effect F(2,20) = 17.41, P < 0.0001. Bonferroni post hoc: ON epoch YFP versus iC++, P > 0.9999).
Extended Data Fig. 1
Extended Data Fig. 1. In vitro characterization of the optical pacemaker.
a, Quantified cardiomyocyte contraction sequence measured by centroid motion (see Supplementary Video 1). Optical stimulation was applied at 5 Hz, with 10-ms pulse width at 585 nm. Scale: 1 s, 1 pixel. b, Fidelity of optically induced contractions at different light intensities. n = 20 cells. Data represent mean ± s.e.m.
Extended Data Fig. 2
Extended Data Fig. 2. In vivo characterization of AAV9-mTNT::ChRmine-2A-oScarlet.
a,b, Representative confocal images of ChRmine-2A-oScarlet (red)-infected ventricular (a) and atrial (b) cardiac tissue, co-labelled with troponin (white), vimentin (green), and DAPI (blue). Note ChRmine expression is restricted to troponin+ cardiomyocytes with no off-target labelling in neighbouring vimentin+ fibroblasts. Scale bar=100 µm. c, Penetrance of AAV9-mTNT::ChRmine-p2A-oScarlet quantified as percentage of troponin+ cells that express ChRmine-2A-oScarlet (n = 3). d, Specificity of AAV9-mTNT::ChRmine-p2A-oScarlet quantified as percentage of ChRmine-2A-oScarlet+ cells that are troponin+ (n = 3). e, Quantification of oScarlet expression in ventricular and atrial cardiac tissue and liver as mean fluorescence signal (arbitrary unit) following 1 month post-injection of AAV9-mTNT::ChRmine-p2A-oScarlet (n = 3, one-way repeated-measures ANOVA with Bonferroni post-hoc test: F(2,4)=18.3, p = 0.0097. Post-hoc: ventricle vs. atrium p = 0.99, ventricle vs. liver p = 0.014, atrium vs liver p = 0.029). f, Representative confocal image from one of two mice depicting lack of neuronal labelling in cardiac ganglia following retro-orbital delivery of  AAV9-mTNT::ChRmine-p2A-oScarlet as measured by immunostaining for the neural marker PGP9.5 (cyan). No off-target ChRmine expression was observed in neurites (centre) or in the soma of cardiac ganglia (bottom). Scale bar=100 µm (top), 20 µm (center, bottom). g,h, Representative confocal images of oScarlet (red), ChRmine mRNA (white) and nuclei (DAPI) nuclei across different organs (g) after 9 months of expression from one of two mice. No off-target expression of ChRmine was observed in organs beyond the heart, including throughout the brain (h). Scale bar=100 µm. Data represent mean ± s.e.m.
Extended Data Fig. 3
Extended Data Fig. 3. Quantification of cardiac responses to optical pacing in vivo.
a, Representative ECG recording with optical pacing at 400 bpm below (top) or above (bottom) a resting heart rate of 400 bpm. b, Percentage of photoactivated heart beats that track with the delivered 400 bpm optical stimulus below or above a resting heart of 400 bpm (n = 4 (below), n = 5 (above) mice). c, Measured heart rate before, during, and after pacing at 400 bpm in heavily anesthetized mice with a resting heart rate below 400 bpm (n = 4 mice, one-way repeated-measures ANOVA with Bonferroni post-hoc test: condition F(1.01, 3.03)=34.07, p = 0.0097; individual F(3,6)=2.4, p = 0.17. Post-hoc: OFF vs. ON *p = 0.015, OFF vs. OFF **p = 0.002). d, Measured heart rate before, during, and after pacing at 400 bpm in lightly anesthetized mice with a resting heart rate above 400 bpm (n = 5 mice, one-way repeated-measures ANOVA with Bonferroni post-hoc test: condition F(1.06, 4.24)=3.71, p = 0.12; individual F(4,8)=5.9, p = 0.016. Post-hoc: OFF vs. ON p = 0.17, OFF vs. OFF p = 0.72). e, Representative ECG recording with optical pacing delivered at 900 bpm with 10-ms pulse width with laser positioned at the centre of the chest to induce right ventricular pacing (top) with additional traces from before, during, and after light stimulation (bottom). f, Representative ECG recording with optical pacing delivered at 900 bpm with 10-ms pulse width with laser positioned more lateral of the chest to induce left ventricular pacing (top) with additional traces from before, during, and after light stimulation (bottom). g, Representative QRS complexes averaged over 100 heart beats before, during, and after pacing for right and left ventricular stimulation. Dark grey bar indicates duration of QRS complex. h, QRS duration before, during, and after right ventricular pacing (n = 4 mice, one-way repeated-measures ANOVA with Bonferroni post-hoc test: condition F(1.01, 3.04)=25.4, p = 0.015; individual F(3,6)=0.68, p = 0.59. Post-hoc: OFF vs. ON *p = 0.037, OFF vs. OFF p = 0.99). i, QRS duration before, during, and after left ventricular pacing (n = 4 mice, one-way repeated-measures ANOVA with Bonferroni post-hoc test: condition F(1.18, 3.54)=121.7, p = 6.7e-4; individual F(3,6)=16.64, p = 0.0026. Post-hoc: OFF vs. ON **p = 0.0038, OFF vs. OFF p = 0.20). j, Representative left ventricular blood pressure recordings with sustained optical pacing delivered at 900 bpm with 10-ms pulse width (top) with additional traces from before and after light stimulation (bottom). k, Systolic blood pressure (SBP) over time with sustained 900 bpm optical pacing (orange) for 30 s showing a sustained drop in SBP during stimulation (n = 3 mice). l, Representative left ventricular blood pressure recordings with intermittent optical pacing delivered at 900 bpm with 10-ms pulse width for 500 ms every 1,500 ms (top) with additional traces during light stimulation (bottom). m, Averaged SBP over the interval of optical stimulation (500 ms ON at 900 bpm, 1,500 ms OFF) (n = 3 mice). Data represent mean ± s.d.
Extended Data Fig. 4
Extended Data Fig. 4. Characterization of the wearable micro-LED vest.
a, Schematic of optical pacing vest. b, Photographs of freely moving mouse wearing optical pacing vest while receiving 591 nm light stimulation. c, Heating of device operated at 900 bpm with 10-ms pulse width at varying duty cycles (n = 3 devices, 25% (500 ms ON, 1,500 ms OFF), 50% (1 s ON, 1 s OFF), 100% (constant ON)). d, Percentage of photoactivated QRS complexes as a function of irradiance using the micro-LED device (n = 5). e, Measured heart rate across time over a 10 min stimulation period (900 bpm) showing ability of optical pacing to induce a stable heart rhythm (n = 6 mice). f, Representative ECG recording from one mouse receiving 900-bpm stimulation for 10 min (top) with additional traces from before, during, and after light stimulation (bottom). g, Representative QRS complexes averaged over 100 heart beats before, during and after pacing. h, QRS duration before, during and after right ventricular pacing (n = 5 mice, one-way repeated-measures ANOVA with Bonferroni post-hoc test: condition F(1.03, 4.10)=13.74, p = 0.02; individual F(4,8)=1.83, p = 0.21. Post-hoc: OFF vs. ON *p = 0.024, OFF vs. OFF p = 0.88). Data represent mean ± s.e.m.
Extended Data Fig. 5
Extended Data Fig. 5. Additional characterization of optical-pacing effects on mouse behaviour.
ac, A hot-plate test was performed to assess for potential effects on thermal pain thresholds from optical pacing (n = 17 (control), 16 (ChRmine)) and the following were quantified: time to first rear (unpaired two-tailed t-test, p = 0.53) (a); rears per minute (unpaired two-tailed t-test, p = 0.64) (b); and time to first jump (unpaired two-tailed t-test, p = 0.22) (c). Note no statistical significance in thermal thresholds was observed with cardiac pacing. df, To assess behavioural differences between control and virally transduced ChRmine-expressing mice, the following comparisons were performed: time spent in one chamber during baseline day (no light delivery) (n = 16 per group, unpaired two-tailed t-test p = 0.21) (d); time spent in the open arm of the EPM test during the first 5-min epoch with no light delivery (n = 16 per group, unpaired two-tailed t-test p = 0.61) (e); and time spent in the centre of the OFT during the first 3-min epoch with no light delivery (n = 5 (control), 9 (ChRmine), unpaired two-tailed t-test p = 0.15) (f). Note no statistical significance in behaviour was observed from viral-transfection. g,h, To assess for effects of light stimulation alone on mouse behaviour, the following comparisons were performed: time spent in the open arms by control (saline injected) mice during the 15 min EPM assay, where intermittent light delivery (10-ms pulse width, 900 bpm for 500 ms every 2 s) was delivered during the 5 min ON epoch (n = 16, one-way repeated-measures ANOVA with Bonferroni post-hoc test: condition F(1.44,21.62)=2.942, p = 0.088, individual F(15,30)=1.61, p = 0.13. Post-hoc: OFF vs. ON p = 0.99, OFF vs. OFF p = 0.9, ON vs. OFF p = 0.27) (g); and time spent in the centre by control mice during the 9 min OFT, where intermittent light delivery was delivered during the 3 min ON epoch (n = 5, one-way repeated-measures ANOVA with Bonferroni post-hoc test: condition F(1.84,7.45)=1.67, p = 0.25, individual F(4,8)=1.51, p = 0.29. Post-hoc: OFF vs. ON p = 0.99, OFF vs. OFF p = 0.99, ON vs. OFF p = 0.41) (h). Note no statistical significance in behaviour was observed from light stimulation alone. i,j, To assess for effects from optical pacing (10-ms pulse width, 900 bpm for 500 ms every 2 s) on anxiety-like behaviour in female mice, the following behavioural assays were measured: time spent in the open arms during the EPM (n = 8 (control) and 7 (ChRmine) female mice, two-way repeated-measures ANOVA with Bonferroni post-hoc test: group (opsin) x time interaction F(2,26)=1.91, p = 0.17, group (opsin) effect F(1,13)=5.1, p = 0.042; time effect F(2,26)=4.24, p = 0.026. Bonferroni post-hoc: ON epoch ChRmine vs Control *p = 0.033) (i); and time spent in the centre during the OFT (n = 7 (control) and 7 (ChRmine) female mice, two-way repeated-measures ANOVA with Bonferroni post-hoc test: group (opsin) x time interaction F(2,24)=0.37, p = 0.70; group (opsin) effect F(1,12)=7.47, p = 0.018; time effect F(2,24)=6.9, p = 0.0043. Post-hoc: ON epoch ChRmine vs Control *p = 0.031) (j). k,l, To determine whether cardiac pacing was aversive in female mice, we also measured the percentage of time spent on baseline and stimulation day for control (grey) and ChRmine-expressing (red) mice during the RTPP assay (n = 7 female mice per group, two-way repeated-measures ANOVA with Bonferroni post-hoc test: group (opsin) x treatment interaction F(1,12)=0.68, p = 0.42; group (opsin) effect F(1,12)=0.11, p = 0.91; treatment effect F(1,12)=0.35, p = 0.57. Post-hoc: Baseline vs Stimulation for Control: p = 0.67, ChRmine: p = 0.99) (k); and the average velocity on the optically paced side during RTPP (n = 7 female mice per group, two-way repeated-measures ANOVA with Bonferroni post-hoc test: group (opsin) x treatment interaction F(1,12)=0.088, p = 0.77; group (opsin) effect F(1,12)=3.69, p = 0.079; treatment effect F(1,12)=0.12, p = 0.73. Post-hoc: Stimulation day Control vs Chrmine: p = 0.59) (l). m,n, To determine whether increased heart rate variability can affect anxiety-like behaviour, we introduced constant 660 bpm stimulation with a Poisson distribution in mice and measured the time spent in the centre during the OFT (n = 12 (control) and 14 (ChRmine) mice, two-way repeated-measures ANOVA with Bonferroni post-hoc test: group (opsin) x time interaction F(2,48)=1.29, p = 0.28; group (opsin) effect F(1,24)=5.80, p = 0.024; time effect F(1.36,32.6)=0.47, p = 0.55. Post-hoc ChRmine vs Control: OFF p = 0.61, ON p = 0.28, OFF p = 0.12) (m); and the time spent in the open arms during the EPM (n = 14 (control) and 14 (ChRmine) mice, two-way repeated-measures ANOVA with Bonferroni post-hoc test: group (opsin) x time interaction F(2,52)=1.75, p = 0.18; group (opsin) effect F(1,26)=3.3, p = 0.082; time effect F(1.84,47.8)=5.157, p = 0.011. Post-hoc ChRmine vs Control: OFF p = 0.25, ON p = 0.20, OFF p = 0.99) (n). o,p, To determine whether intermittent tachycardia at a rhythm below 900 bpm can affect anxiety-like behaviour, we introduced intermittent 660 bpm stimulation (10-ms pulse width, 660 bpm for 500 ms every 2 s) in mice and measured the time spent in the centre during the OFT (n = 6 (control) and 10 (ChRmine) mice, two-way repeated-measures ANOVA with Bonferroni post-hoc test: group (opsin) x time interaction F(2,28)=0.13, p = 0.88; group (opsin) effect F(1,14)=0.25, p = 0.63; time effect F(2,28)=1.1, p = 0.35. Post-hoc ChRmine vs Control: OFF p = 0.99, ON p = 0.99, OFF p = 0.99) (o); and the time spent in the open arms during the EPM (n = 6 (control) and 10 (ChRmine) mice, two-way repeated-measures ANOVA with Bonferroni post-hoc test: group (opsin) x time interaction F(2,28)=0.52, p = 0.60; group (opsin) effect F(1,14)=0.03, p = 0.86; time effect F(2,28)=2.23, p = 0.12. Post-hoc ChRmine vs Control: OFF p = 0.99, ON p = 0.99, OFF p = 0.99) (p). q, Schematic overview of the chronic stimulation experiment. Mice were stimulated with intermittent optical pacing (900 bpm for 500 ms every 2 s) for 1 h every other day for two weeks before performing the OFT and EPM behavioural assays. r, Time spent in open arm during the EPM test for control (grey) and ChRmine (red) mice subjected to chronic optical stimulation (n = 6 (control) and 9 (ChRmine) mice, two-way repeated-measures ANOVA with Bonferroni post-hoc test: group (opsin) x time interaction F(2,26)=0.87, p = 0.43; group (opsin) effect F(1,13)=0.71, p = 0.41; time effect F(1.65,21.4)=0.96, p = 0.38. Post-hoc ChRmine vs Control: 0–5 min p = 0.99, 5–10 min p = 0.89, 10–15 min p = 0.84). s, Time spent in centre during the OFT test for control (grey) and ChRmine (red) mice subjected to chronic optical stimulation (n = 6 (control) and 9 (ChRmine) mice, two-way repeated-measures ANOVA with Bonferroni post-hoc test: group (opsin) x time interaction F(2,26)=0.25, p = 0.78; group (opsin) effect F(1,13)=0.097, p = 0.76; time effect F(1.78,23.2)=0.49, p = 0.60. Post-hoc ChRmine vs Control: 0–3 min p = 0.99, 3–6 min p = 0.99, 6–9 min p = 0.99). t, Average velocity (cm/s) of mice in the OFT test for control (grey) and ChRmine (red) mice subjected to chronic optical stimulation (n = 6 (control) and 9 (ChRmine) mice, two-way repeated-measures ANOVA with Bonferroni post-hoc test: group (opsin) x time interaction F(2,26)=0.29, p = 0.78; group (opsin) effect F(1,13)=0.005, p = 0.94; time effect F(1.34,17.4)=17.3, p = 2.6e-4. Post-hoc ChRmine vs Control: 0–3 min p = 0.99, 3–6 min p = 0.99, 6–9 min p = 0.99). u, Total distance travelled (cm) mice during the OFT test for control (grey) and ChRmine (red) mice subjected to chronic optical stimulation (n = 6 (control) and 9 (ChRmine) mice, two-way repeated-measures ANOVA with Bonferroni post-hoc test: group (opsin) x time interaction F(2,26)=0.29, p = 0.75; group (opsin) effect F(1,13)=0.005, p = 0.94; time effect F(1.34,17.4)=17.3, p = 2.6e-4. Post-hoc ChRmine vs Control: 0–3 min p = 0.99, 3–6 min p = 0.99, 6–9 min p = 0.99). Data represent mean ± s.e.m.
Extended Data Fig. 6
Extended Data Fig. 6. Operant lever-pressing task at higher risk of shock.
a, Cumulative lever presses during 20% shock session for control (grey) and ChRmine-expressing (red) mice (n = 8 mice per group). Experiment was performed otherwise identically to the behaviour described in Fig. 2. b, Lever-pressing rate averaged across the entire 20% shock trial session (n = 8 mice per group, Two-tailed t-test, *p = 0.0367). c, Cumulative lever presses during 30% shock session. d, Lever-pressing rate averaged across the entire 30% shock trial session (n = 8 mice per group, Two-tailed t-test, p = 0.7663). Data represent mean ± s.e.m.
Extended Data Fig. 7
Extended Data Fig. 7. Generation of brain-wide activity maps during optical pacing.
a, Representative whole-brain CLARITY sagittal (top) and axial (bottom) images of control and ChRmine expressing mice exposed to optical pacing. Heart-targeted ChRmine expression resulted in increased tdTomato+ cells throughout the brain (seen as black dots) relative to control. b, Following light-sheet imaging, each image stack was registered to a common Allen Reference Atlas using our previously reported computational pipeline. Depicted are coronal slices across the brain with the overlaid anatomical atlas, where different anatomical regions are depicted with different colours. c, Representative raw image of single plane of TRAP2-tdTomato brain imaged under light-sheet microscope (left), and after detection by a supervised classifier (Ilastik, Arivis plugin), where single-cells are outlined in red (right, bottom). Blue arrows indicate example features that were detected by the classifier. d, Example CLARITY light-sheet images of control and ChRmine-paced mice in the visceral cortex (VISC), Medulla-behavioural state related (MY), and in the lateral amygdalar nucleus (LA), which are outlined in green in the axial reference slice. Scale bar=500 µm. e, Regional cell counts of paced (ChRmine, red) vs control (grey) cohorts sorted from anterior to posterior in all anatomical regions (n = 9 per group, multiple two-sided t-tests corrected for multiple comparisons with the Benjamini and Hochberg method (*FDR=10%). p-values: MO p = 0.025, SS p = 0.038, AUD p = 0.082, VIS p = 0.31, ACA p = 0.050, PL p = 0.027, ILA p = 0.0086, ORB p = 0.012, GU p = 0.013, VISC p = 0.018, AI p = 0.016, RSP p = 0.20, TEA p = 0.11, PERI p = 0.074, ECT p = 0.10, OLF p = 0.017, HIP p = 0.10, RHP p = 0.052, CLA p = 0.092, EP p = 0.035, LA p = 0.028, BLA p = 0.051, BMA p = 0.036, PA p = 0.043, STRd p = 0.029, STRv p = 0.015, LSX p = 0.012, sAMY p = 0.037, PALd p = 0.036, PALv p = 0.033, PALm p = 0.024, PALc p = 0.012, DORsm p = 0.16, DORpm p = 0.095, PVZ p = 0.016, PVR p = 0.020, MEZ p = 0.029, LZ p = 0.033, MB p = 0.28, P p = 0.030, MY p = 0.054, VERM p = 0.50, HEM p = 0.043, CBN p = 0.92). Acronyms for each major brain region is listed.
Extended Data Fig. 8
Extended Data Fig. 8. Optically induced tachycardia increases Fos mRNA expression in brain regions associated with the central autonomic network.
a,b, Percentage of cells that are Fos+ determined from in situ hybridization for Fos mRNA (magenta) following cardiac pacing in control and ChRmine-expressing mice in the nucleus of the solitary tract (NTS) (a) and in the locus coeruleus (LC) (b) (n = 4 mice per group, unpaired two-tailed t-test, ***p = 0.00029 (NTS), **p = 0.0027). We have also performed in situ hybridization for Fos mRNA in the nodose ganglion and observed potential induction in these vagal sensory neurons by the cardiac signals (n = 4, control 0.96% ± 0.7; ChRmine 5.29% ± 1.6, unpaired two-tailed t-test, p = 0.04). c, Confocal images of the locus coeruleus stained for Fos (magenta), the norepinephrine transporter Slc6a2 (yellow) and DAPI (blue). d, Quantification of neurons that express Slc6a2 that also co-localize with Fos during optical pacing (n = 4 mice per group, unpaired two-tailed t-test: ****p = 1.0e-7). Scale bar=20 µm. Data represent mean ± s.e.m.
Extended Data Fig. 9
Extended Data Fig. 9. Behavioural and physiological effects from inhibition of the posterior insula.
a, Mice were evaluated on the EPM with iC++ inhibition only during the “ON” epoch, with no optical pacing vest (n = 6 mice per group; two-way repeated-measures ANOVA: group (opsin) x time interaction F(2,20)=2.569, p = 0.1016; group (opsin) effect F(1,10)=0.0392, p = 0.8470; time effect F(2,20)=0.1486, p = 0.8629). Note inhibition of pIC did not significantly alter time spent in the open arms of the EPM. b, Schematic overview of the pIC inhibition experiment. Mice were evaluated on the Vogel conflict task with elevated chance of shock (30%) while wearing the optical pacing vest but without receiving cardiac stimulation. Optogenetic inhibition was performed during the entire duration of the 30 min trial. c, Individual traces of lever presses during shock day with 30% chance of shock and bilateral pIC inhibition (n = 6 mice per group). d, Lever-pressing rate averaged across entire 30% shock session (n = 6 mice per group). e, Heart rate as a function of time during pIC inhibition (blue) (n = 3 mice per group). Data represent mean ± s.e.m.

Comment in

Similar articles

Cited by

References

    1. Critchley HD, Harrison NA. Visceral influences on brain and behavior. Neuron. 2013;77:624–638. doi: 10.1016/j.neuron.2013.02.008. - DOI - PubMed
    1. Chen WG, et al. The emerging science of interoception: sensing, integrating, interpreting, and regulating signals within the self. Trends Neurosci. 2021;44:3–16. doi: 10.1016/j.tins.2020.10.007. - DOI - PMC - PubMed
    1. Craig AD. How do you feel? Interoception: the sense of the physiological condition of the body. Nat. Rev. Neurosci. 2002;3:655–666. doi: 10.1038/nrn894. - DOI - PubMed
    1. Critchley HD, Garfinkel SN. Interoception and emotion. Curr. Opin. Psychol. 2017;17:7–14. doi: 10.1016/j.copsyc.2017.04.020. - DOI - PubMed
    1. Tural U, Iosifescu DV. The prevalence of mitral valve prolapse in panic disorder: a meta-analysis. Psychosomatics. 2019;60:393–401. doi: 10.1016/j.psym.2018.10.002. - DOI - PubMed

Publication types

Substances