. 2023 Mar;615(7951):339-348.
doi: 10.1038/s41586-023-05780-8. Epub 2023 Mar 1.

H3K4me3 regulates RNA polymerase II promoter-proximal pause-release

Affiliations

H3K4me3 regulates RNA polymerase II promoter-proximal pause-release

Hua Wang et al. Nature. 2023 Mar.

Erratum in

Abstract

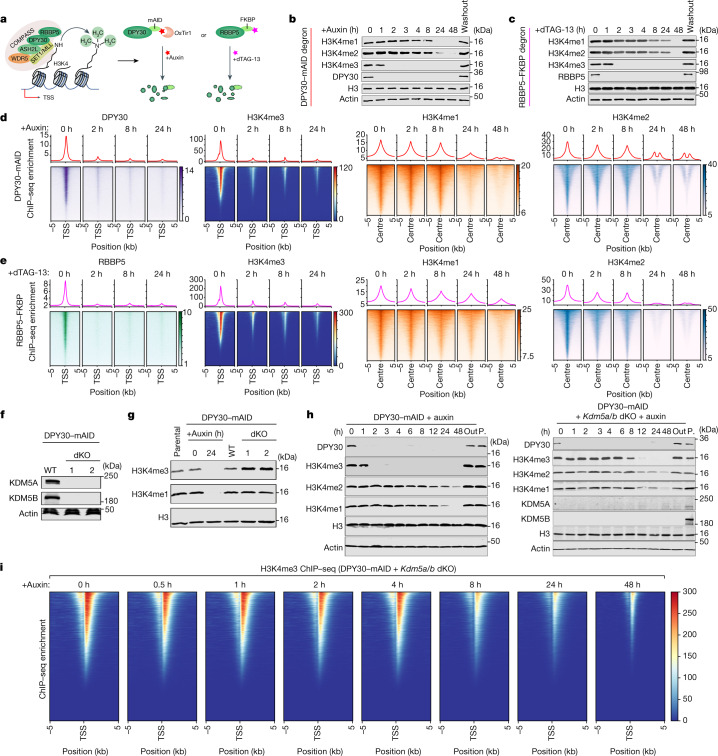
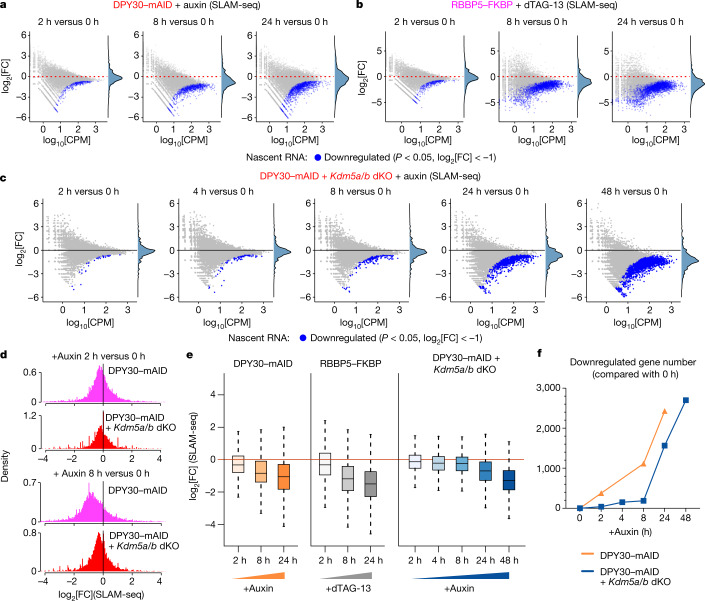
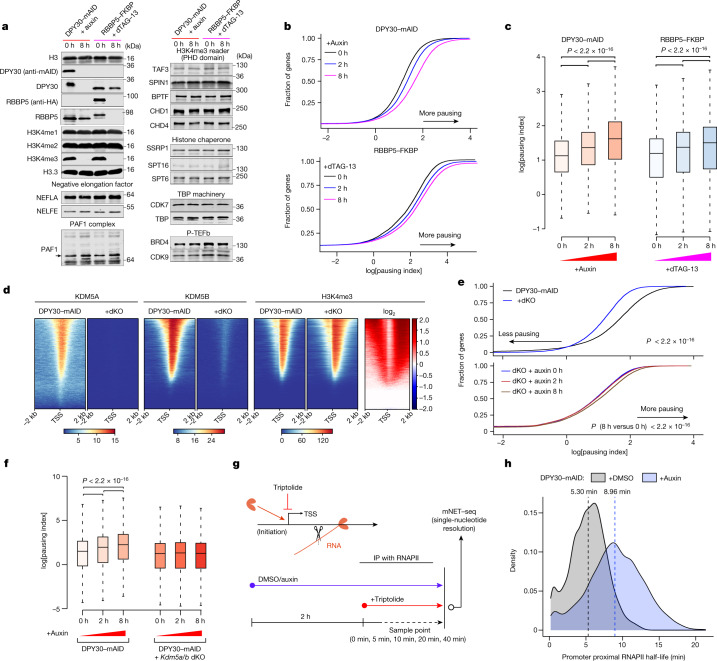
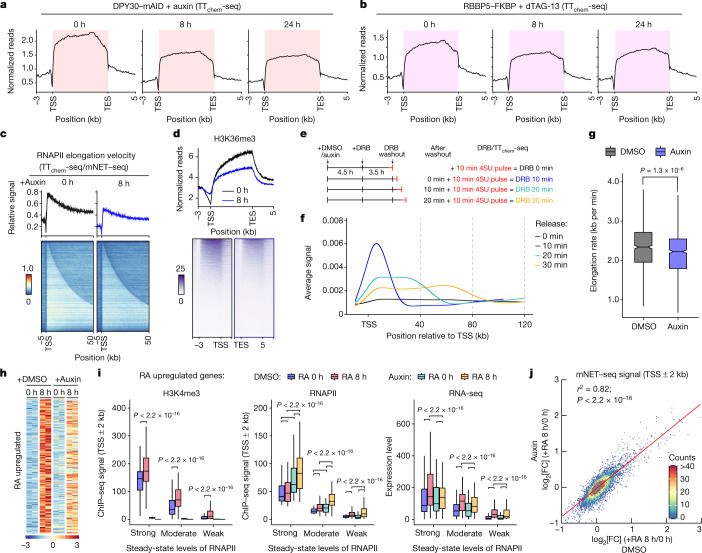
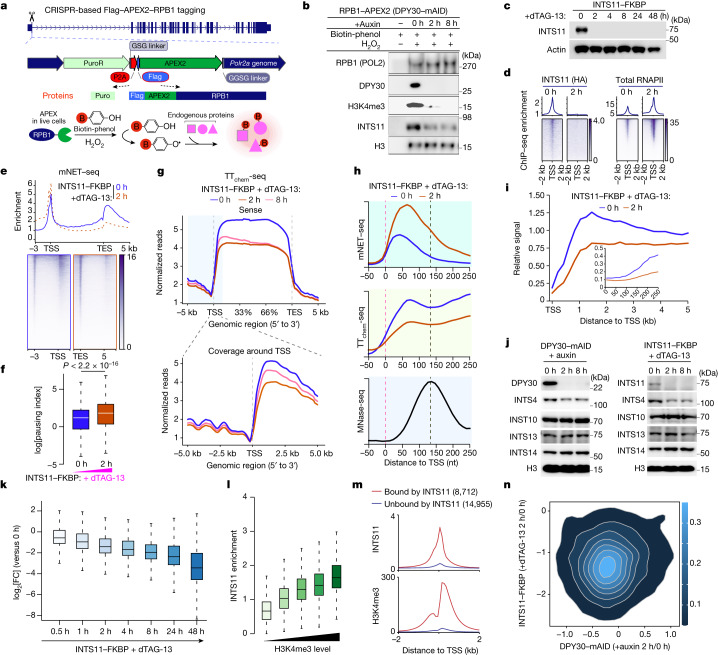
Trimethylation of histone H3 lysine 4 (H3K4me3) is associated with transcriptional start sites and has been proposed to regulate transcription initiation1,2. However, redundant functions of the H3K4 SET1/COMPASS methyltransferase complexes complicate the elucidation of the specific role of H3K4me3 in transcriptional regulation3,4. Here, using mouse embryonic stem cells as a model system, we show that acute ablation of shared subunits of the SET1/COMPASS complexes leads to a complete loss of all H3K4 methylation. Turnover of H3K4me3 occurs more rapidly than that of H3K4me1 and H3K4me2 and is dependent on KDM5 demethylases. Notably, acute loss of H3K4me3 does not have detectable effects on transcriptional initiation but leads to a widespread decrease in transcriptional output, an increase in RNA polymerase II (RNAPII) pausing and slower elongation. We show that H3K4me3 is required for the recruitment of the integrator complex subunit 11 (INTS11), which is essential for the eviction of paused RNAPII and transcriptional elongation. Thus, our study demonstrates a distinct role for H3K4me3 in transcriptional pause-release and elongation rather than transcriptional initiation.


Conflict of interest statement

K.H. is a co-founder of Dania Therapeutics, consultant for Inthera Bioscience and a scientific advisor for MetaboMed and Hannibal Innovation. The other authors declare no competing interests.

Figures

Fig. 1
Fig. 1. Acute depletion of SET1/COMPASS core subunits reveals rapid turnover of H3K4me3.
a, Schematic of the degron systems for the targeted degradation of DPY30 and RBBP5. b,c, Immunoblot analysis of DPY30, RBBP5 and H3K4me1–3 levels at the indicated times after treatment with 500 nM auxin (b) or 500 nM dTAG-13 (c). Washout, degron ligand was washed out for 48 h. d,e, ChIP–seq heat maps and profiles were generated from control and auxin-treated DPY30–mAID cells (d) and dTAG-13-treated RBBP5–FKBP cells (e). For DPY30, RBBP5 and H3K4me3 ChIP–seq, the signal was plotted over the TSSs (TSS ± 5 kb) of protein-coding genes. For H3K4me1 and H3K4me2 ChIP–seq, the signal was plotted over their centre peaks (peak centre ± 5 kb), which are called from steady-state mES cells. Sites were sorted by the ChIP–seq signals at 0 h. f, Immunoblot analysis of KDM5A and KDM5B in DPY30–mAID cells and two independently isolated dKO cell lines. β-Actin was used as the loading control. g, Immunoblot analysis of H3K4me3 and H3K4me1 levels in DPY30–mAID, control and Kdm5a/b-dKO cells. Histone H3 was used as the loading control. h, Immunoblot analysis of DPY30, H3K4me1–3, KDM5A and KDM5B at the indicated times after auxin treatment. Out, degron ligand was washed out for 48 h; P, parental cells. i, H3K4me3 ChIP–seq heat maps in DPY30–mAID Kdm5a/b-dKO cells. The signal was plotted over the TSSs (TSS ± 5 kb) of protein-coding genes. Rows are sorted by decreasing ChIP–seq occupancy in the auxin 0 h cells.
Fig. 2
Fig. 2. H3K4me3 is required for nascent transcription.
a, MA plots depicting changes in nascent transcription (SLAM-seq) at the indicated times after auxin treatment in DPY30–mAID cells. n = 3 biological replicates. CPM, counts per million mapped reads; FC, fold change. Adjusted P values were calculated using Wald tests in DESeq2. b, MA plots depicting changes in nascent transcription (SLAM-seq) at the indicated times after dTAG-13 treatment in RBBP5–FKBP cells. n = 3 biological replicates. Adjusted P values were calculated using Wald tests in DESeq2. c, MA plots depicting changes in nascent transcription (SLAM-seq) at the indicated times after auxin treatment in DPY30–mAID Kdm5a/b-dKO cells. n = 2 biological replicates. Adjusted P values were calculated using Wald tests in DESeq2. d, The log2-transformed fold change in nascent gene expression in the depicted cell lines on the basis of the data shown in a and c. e, The nascent transcriptional changes (log2-transformed) for genes in indicated samples across timepoints with DPY30 or RBBP5 degradation kinetics. The box plots indicate the median (centre line), the third and first quartiles (box limits) and 1.5 × interquartile range (IQR) above and below the box (whiskers). n = 3 (DPY30–mAID or RBBP5–FKBP degron cells) and n = 2 (dKO cells) biological replicates. f, Comparison of the number of downregulated genes after auxin treatment for the indicated cell lines, based on the data presented in a and c.
Fig. 3
Fig. 3. Acute loss of H3K4me3 increases the residence time of paused RNAPII.
a, Immunoblot analysis of the indicated transcriptional core proteins and H3K4me3 readers in the indicated cell lines treated with or without auxin or dTAG-13 as shown. b, The RNAPII pausing index in control (0 h, black) and auxin-treated or dTAG-13-treated degron cells. Higher index values indicate a higher degree of RNAPII pausing. Cumulative index plots of the pausing index were calculated from total RNAPII ChIP–seq signals. c, The RNAPII pausing index was determined using ChIP–seq in the indicated samples with DPY30 or RBBP5 degradation kinetics. The box plots indicate the median (centre line), the third and first quartiles (box limits) and 1.5 × IQR above and below the box (whiskers). P values were calculated using two-sided Wilcoxon rank-sum tests. n = 12,621 genes. d, Comparison of the occupancy of KDM5A, KDM5B and H3K4me3 around the TSS region (TSS ± 2 kb) in DPY30–mAID and DPY30–mAID Kdm5a/b-dKO cells. e, The RNAPII pausing index in DPY30–mAID (black), DPY30–mAID Kdm5a/b-dKO (blue) and auxin-treated cells. Higher index values indicate a higher degree of RNAPII pausing on promoter region of genes. P values were calculated using two-sided Wilcoxon tests. f, The RNAPII pausing index determined using mNET–seq in DPY30–mAID, DPY30–mAID Kdm5a/b-dKO and auxin-treated cells. The box plots indicate the median (centre line), the third and first quartiles (box limits) and 1.5 × IQR above and below the box (whiskers). P values were calculated using two-sided Wilcoxon tests. n = 10,332 genes. g, The experimental strategy of the mNET–seq approach to measure the promoter-proximal RNAPII half-life after treatment with triptolide. h, Density plot showing increased paused RNAPII half-life of n = 4,007 genes after acute loss of H3K4me3. The average of paused RNAPII half-life is shown as a dashed line. n = 2 biological replicates.
Fig. 4
Fig. 4. H3K4me3 regulates transcriptional elongation.
a,b, Metagene profiles for transient transcriptome sequencing (TTchem-seq) in control and auxin-treated (a) or dTAG-13-treated (b) cells in the indicated cell lines. TES, transcription end site. c, Heat maps and profiles showing changes in elongation velocities (TTchem-seq/mNET–seq) after acute loss of H3K4me3. d, H3K36me3 ChIP–seq profiles and heat maps in control and auxin-treated DPY30–mAID cells. e, Outline of the DRB/TTchem-seq experiment to measure RNAPII elongation rates. 4SU, 4-thiouridine. DRB 0 min, no release of DRB. f, DRB/TTchem-seq metagene profiles of protein-coding genes (60–300 kb length) with non-overlapping transcriptional units (n = 3,566) in the depicted cells. Lines are computationally fitted splines. g, Box plot showing decreased RNAPII elongation rates after H3K4me3 loss. P values were calculated using two-sided Wilcoxon tests. n = 855 genes with RPM > 100. The box plots indicate the median (centre line), the third and first quartiles (box limits) and 1.5 × IQR above and below the box (whiskers). h, The upregulated genes response to RA treatment in auxin-treated and DMSO-treated cells (n = 2). Gene expression is shown as relative Z-scores across the samples. i, The changes in H3K4me3 and RNAPII ChIP–seq at TSSs (±2 kb), and RNA-sequencing analysis of RA-response genes (upregulated genes) in the indicated samples. The box plots indicate the median (centre line), the third and first quartiles (box limits) and 1.5 × IQR above and below the box (whiskers). P values were calculated using two-sided Wilcoxon tests. n = 77 genes for each group. j, The correlation of mNET–seq signal around the TSS region (TSS ± 2 kb) at 8 h after RA treatment with or without H3K4me3. Pearson correlation and P values are reported at the top. P values were calculated using two-sided Wilcoxon tests.
Fig. 5
Fig. 5. INTS11 regulates pause-release and transcription dependent on H3K4me3.
a, The strategy for CRISPR-based Flag–APEX2–RPB1 (RNAPII–APEX2) tagging. b, Validation of H3K4me3-dependent INTS11 chromatin interaction in DPY30–mAID cells. c, Western blot analysis of HA-tagged INTS11 and actin in INTS11–FKBP cells. d, HA-tagged INTS11 and total RNAPII ChIP–seq profiles and heat maps in INTS11–FKBP cells. e, mNET–seq profiles and heat maps in INTS11–FKBP degron cells. f, The RNAPII pausing index was determined using mNET–seq in INTS11–FKBP cells. The box plots indicate the median (centre line), the third and first quartiles (box limits) and 1.5 × IQR above and below the box (whiskers). P values were calculated using two-sided Wilcoxon tests. n = 10,332 genes. g, Metagene transcriptional profiles were acquired using TTchem-seq in INTS11–FKBP degron cells. h, Metagene analyses of mNET–seq and TTchem-seq signals at single-nucleotide resolution acquired in INTS11–FKBP cells. MNase-seq, micrococcal nuclease sequencing. i, Analysis of elongation velocities (TTchem-seq/mNET–seq) after acute loss of INTS11. j, Immunoblot analysis of integrator subunits in the indicated cell lines treated with or without auxin or dTAG-13 as shown. k, Box plot comparing the log2-transformed fold change in SLAM-seq at the indicated timepoints. The box plots indicate the median (centre line), the third and first quartiles (box limits) and 1.5 × IQR above and below the box (whiskers). n = 13,776 genes. l, The INTS11 signal at TSSs (± 2 kb) in the indicated groups. The box plots indicate the median (centre line), the third and first quartiles (box limits) and 1.5 × IQR above and below the box (whiskers). n = 4,700 genes. m, The average distribution of INTS11 and H3K4me3 ChIP–seq signals at INTS11-bound genes (n = 8,712) versus INTS11-unbound genes (n = 14,955) in mES cells. n, 2D kernel density plot showing the relationship between SLAM-seq changes in INTS11–FKBP and DPY30–mAID degron cells. The colour bar reflects the intensity.
Extended Data Fig. 1
Extended Data Fig. 1. Generation of DPY30–mAID and RBBP5–FKBP mES cell lines.
(a,b) DPY30, RBBP5, H3K4me3 and RNAPII occupancy in mES cells plotted around the TSS of all protein-coding genes. Genes were sorted based on H3K4me3 binding levels in the heat maps (a). 3′ RNA-seq data is from Quant-seq in mES cells. The average signal in the profiles (b) is plotted over the transcription start sites (TSS ± 2 kb) of all protein-coding genes. (c) Outline of CRISPR-HDR based knock-in targeting approach generating DPY30-AID and RBBP5–FKBP, by knocking-in mAID and FKBP12 degron tags into the 3′ end of both alleles of endogenous Dpy30 and Rbbp5 loci of the E14 mES cell cell line, respectively. The endogenous Dpy30 gene was edited to encode Auxin inducible degradation (mAID)-BFP at the C terminus of DPY30 in OsTir1 E14 mES cells. The endogenous Rbbp5 gene was edited to encode FKBP12 tag-Neomycin that enables targeted degradation upon dTAG-13 treatment. (d) DPY30 expression in the indicated cell lines as measured by flow cytometry analysis using an anti-DPY30 antibody. (e,f) H3K4me3 ChIP–seq heat maps and profiles at H3K4me3 peak centre in control and Auxin-treated cells in DPY30–mAID (E) or dTAG-13-treated in RBBP5–FKBP (F) cells. The signal was plotted over H3K4me3 peaks centre (peak centre ± 5 kb) which are called from WT mES cells. Sites are sorted by the ChIP–seq signals at 0 h. (g,h) Integrative genomics viewer (IGV) browser snapshots comparing DPY30 (g) or H3K4me3 (h) enrichments determined by ChIP–seq in control and Auxin-treated in DPY30–mAID degron mES cells. (i–k) ChIP-qPCR enrichments of DPY30 (I) and H3K4 methylations (j and k) in DPY30–mAID cells after treatment with Auxin for the indicated times. (l) ChIP-qPCR for H3K4me3 in RBBP5–FKBP cells. In panels (i-l) target sites around the promoter of the genes and control region (intragenic chr8: 72,806,101- 72,806,240) were used. For H3K4me1, the enhancer region of Nanog was used for DPY30, H3K4me2 and H3K4me3 ChIP-qPCR. Graph shows mean values from technical triplicates (n = 3), from one representative out of two independent experiments.
Extended Data Fig. 2
Extended Data Fig. 2. DPY30 and RBBP5 are required for cell proliferation.
(a) Cell proliferation assays of DPY30–mAID and RBBP5–FKBP cells grown either with or without Auxin/dTAG-13. The line graph represents the mean ± SD of the numbers of cells counted at each time point. Parental represents the parental E14 ES cells without CRISPR editing. Ectopic expression (EE) of DPY30 or RBBP5 rescues the proliferation of defect observed by degrading endogenous DPY30 and RBBP5, respectively. Data are from three biological replicates (n = 3) and were analysed using Two-way ANOVA (n = 3) and represented as mean ± s.d., ***P < 0.001. (b) Colony formation assay for DPY30–mAID and RBBP5–FKBP cells grown either with or without Auxin/dTAG-13 for two weeks. (c) Quantification of colony formation assays from two independent experiments. Data in bar plots are represented as mean and n = 2 replicates. (d) Cell proliferation assays of DPY30–mAID cells after treatment with Auxin at the indicated times with or without Kdm5ab dKO. (e) RT-qPCR analyses of mRNA expression of DPY30–mAID cells with or without Kdm5ab dKO. Two independent dKO clones were chosen for downstream analysis. The values are normalized to 18S rRNA. Graph shows mean values from technical triplicates (n = 3), from one representative out of two independent experiments. (f) ChIP-qPCR enrichment for WDR5, SETD1B and MLL1 in DPY30–mAID cells system after treatment with Auxin at the indicated points. Graph shows mean values from technical triplicates (n = 3), from one representative out of two independent experiments.
Extended Data Fig. 3
Extended Data Fig. 3. Outline and controls for SLAM-seq experiments.
(a) Experimental design. To validate the SLAM-seq protocol, we performed a pilot experiment for mapping responses to short-term THZ1 (2h) treatment by SLAM-seq in mES cells. SLAM-seq utilizes thymine-to-cytosine (T>C) conversion from 4-thiouridine (4sU)-labelled mRNAs to quantify the abundance of nascent RNA transcripts using 3′ end mRNA-sequencing (Quant-seq). To monitor the consistency and reproducibility of different SLAM-seq data, we inhibited transcription with THZ1 (reduces RNAPII-mediated gene transcription by inhibiting cyclin-dependent kinase 7 (CDK7)). (b) Conversion rates for each position of 4-thioU-containing SLAM-seq reads (≥ 2 T>C conversions) before or after Auxin or THZ1 treatment for 2 h. Changes in the abundance of newly synthesized mRNAs (detected in SLAM-seq based on T>C conversions). Average conversion rates (centre line) ± s.d. (whiskers) of two independent experiments (points) are shown. P value (Two-sided Mann-Whitney test) is indicated (***P < 0.001, n.s., not significant.). n = 20,428 transcripts. The boxplot indicates the median (middle line) and the third and first quartiles (box); the whiskers show the 1.5× IQR above and below the box. (c,d) Transcriptional response of the cells treated with THZ1/DMSO for 2h followed by 4sU labelling over 60 min. (c) MA plots comparing total gene expression level with log change in transcription per gene measured by 4-thioU RNA-seq (SLAM-seq). (d) MA plots comparing nascent gene expression levels with log change in transcription per gene measured by SLAM-seq. THZ1 treatment confirmed that transcripts containing T>C conversions of protein-coding genes were broadly repressed, which captured the prominent immediate responses, while the total mRNA level showed fewer changes. P-adjusted value by Wald test in DESeq2. (e) H3K4me3 levels on TSS before Auxin treatment of downregulated genes (n = 1,111) and unchanged genes (n = 10,107) measured by SLAM-seq (in response to Auxin treatment for 2h in DPY30–mAID cells). The p value was calculated with a two-sided Wilcoxon test. The boxplot indicates the median (middle line) and the third and first quartiles (box); the whiskers show the 1.5× IQR above and below the box. (f) H3K4me3 peak width of downregulated genes and unchanged genes measured by ChIP–seq at steady-state. n= for downregulated and n= for unchanged genes. The p value was calculated with a two-sided Wilcoxon test. The boxplot indicates the median (middle line) and the third and first quartiles (box); the whiskers show the 1.5× IQR above and below the box. (g) Box plot showing log2-transformed fold change of nascent transcription (SLAM-seq, 2 h vs. 0 h) of genes containing CGI (n = 11,386) and non-CGI (n = 3,262) promoters. The p value was calculated with a two-sided Wilcoxon test. The boxplot indicates the median (middle line) and the third and first quartiles (box); the whiskers show the 1.5× IQR above and below the box. (h) Gene set enrichment analysis (GSEA) of downregulated genes in DPY30–mAID cells in response to 2 h Auxin treatment.
Extended Data Fig. 4
Extended Data Fig. 4. H3K4me3 loss does not have detectable effects on binding of TAF3, CDK7 and TBP to transcription start sites and to PIC formation.
(a) ChIP–seq profiles of the indicated proteins using DPY30–mAID and RBBP5–FKBP cells treated with or without Auxin/dTAG-13, respectively for 8 h. The enrichments were plotted over the transcription start sites (TSS ± 5 kb) of protein-coding genes. TSS, transcription start site. (b) Outline of the mass spectroscopy proteome profiling strategy for mapping the interaction networks of RNAPII in DPY30–mAID cells treated with or without Auxin. (c) String network of protein complexes (k-means clustering) showing RNAPII interactors in control cells compared with IgG mock IP. (d) Volcano plot showing proteins changing their association with RNAPII in response to acute loss of H3K4me3. The x axis displays the enrichment (log2 fold change) of proteins in Auxin-treated cells (Auxin 8 h) compared to DMSO-treated control cells (Auxin 0 h). The y axis shows the significance (-log10 P value) of enrichment calculated from three biological replicate experiments. A protein was considered an interactor if in one or both comparisons its levels were statistically significantly different (Q value ≤ 0.05, limma test, with P values adjusted by the Storey method). (e) RNAPII occupancy based on ChIP–seq in the indicated cell lines. Metagene analysis showing the genome-wide enrichment averages on protein-coding genes, data are shown along with 3 kb upstream of the transcriptional start site to 5 kb downstream of the end of each annotated gene. TSS, transcription start site, TES, transcription end site. (f) Estimation of a gene’s “pausing index” (PI) from RNAPII ChIP–seq data. The promoter is defined as the region covering 200 bp upstream to 200 bp downstream of the TSS; the gene body is defined as the region from 400 bp downstream of the TSS to TES, genes with gene length less than 400 bp are removed for pausing index analysis. (g) Violin plots showing changes of gene expression in the indicated samples. Genes were separated into three equal parts based on their accumulation change of RNAPII in promoter-proximal region. (h) An IGV snapshot comparing RNAPII, RNAPII Ser 2p and Ser 5p ChIP–seq signals in control and Auxin-treated DPY30–mAID cells at the indicated times. (i) Average metagene ChIP–seq profiles for the indicated factors in control and dTAG-13-treated RBBP5–FKBP cells.
Extended Data Fig. 5
Extended Data Fig. 5. The fast turnover of H3K4me3 is dependent on KDM5 demethylases.
(a) RNAPII pausing index in DPY30–mAID (black), DPY30–mAID: Kdm5a/b dKO (blue, clone #2) and Auxin-treated cells. Higher index values indicate a higher degree of RNAPII pausing. (b) ChIP-qPCR enrichment of H3K4me3 in DPY30–mAID cells after treatment with Auxin at the indicated times with or without Kdm5a/b dKO. (c) ChIP-qPCR signals for RNAPII in DPY30–mAID cells following treatment with Auxin at the indicated times with or without Kdm5a/b dKO. For ChIP-qPCR, the target sites around promoter of the indicated genes and control region (intragenic chr8: 72,806,101- 72,806,240) were used. Graph shows mean values from technical triplicates (n = 3), from one representative out of two independent experiments.
Extended Data Fig. 6
Extended Data Fig. 6. H3K4me3 regulates the paused RNAPII half-life.
(a) Half-lives of paused RNAPII in control and Auxin-treated DPY30–mAID degron cells. The half-life was calculated based on an exponential decay model. Normalized promoter-proximal RNAPII density for each gene is shown over the course of triptolide treatment both for control (DMSO, black) and Auxin (blue) conditions. n = 2 biological replicates. (b) Boxplot showing increased paused RNAPII duration following H3K4me3 loss. P value was calculated with a two-sided Wilcoxon test, n = 4,007 genes. The boxplot indicates the median (middle line) and the third and first quartiles (box); the whiskers show the 1.5× IQR above and below the box. (c) An IGV snapshot comparing mNET–seq signals after triptolide-induced block of transcription in control and Auxin-treated in DPY30–mAID cells at the indicated time points. The decreasing levels of paused RNAPII were observed in the pausing window (shaded areas) over time. (d) Heat maps and profiles showing changes in mNET–seq signals upon acute loss of H3K4me3. Heat maps were plotted as increasing gene length over regions 5 kb upstream to 50 kb downstream of the TSS. The right panel display the difference (∆) in mNET–seq between control (+ Auxin 0 h) and Auxin-treated (+ Auxin 8 h) cells. Genes were sorted by gene length. (ef) Heat maps and profiles showing changes of H3K4me3 ChIP–seq and mNET–seq at promoters, active and inactive enhancers upon Auxin treatment (8 h) in DPY30–mAID degron cells. The signals were plotted over the transcription start sites (TSS ± 5 kb) or the centre of enhancers (centre ± 5 kb). (g) H3K36me3 ChIP–seq profiles in control (+ Auxin 0 h) and Auxin-treated (+ Auxin 8 h) cells in DPY30–mAID cells. Genes were split by their H3K4me3 and H3K27me3 levels around TSS regions. (h) Histogram of RNAPII elongation rates for individual genes between 60 and 300 kb with RPM value ≥100 across all time points (n = 855) with a 10-min wave peak called beyond 2 kb and sequential increase from the TSS over the 10-, 20- and 30-min time points. (i) Heat maps and profiles showing changes of ChIP–seq, mNET–seq and TTchem-seq at promoters upon Auxin treatment (8 h) in DPY30–mAID degron cells. The downregulated genes and unchanged genes measured by SLAM-seq. The signals were plotted over the transcription start sites (TSS ± 5 kb). (j) Boxplot showing RNAPII elongation rates following H3K4me3 loss. P value was calculated with a two-sided Wilcoxon test. The number of genes (n) from each group are shown at the bottom. The boxplot indicates the median (middle line) and the third and first quartiles (box); the whiskers show the 1.5× IQR above and below the box.
Extended Data Fig. 7
Extended Data Fig. 7. Loss of H3K4me3 does not have detectable effects on transcriptional initiation.
(a) Experimental strategy for retinoic acid (RA) differentiation in control and Auxin-treated degron cells. (b) Principal component (PC) analysis of RA-induced mRNA expression changes in DPY30–mAID cells prior to treatment with Auxin (circles) or DMSO (triangles) for 2 h at the indicated differentiation points: 0h, 8h, d1, d2, d4, d6. Developmental trajectory is shown by the dashed arrow. (c) Spearman correlation heat map of retinoic acid (RA) time course RNA-seq replicates of Auxin-treated and DMSO-treated cells. (d) Short- and long-term effects of DPY30 degradation on the expression of RA-induced genes. DPY30–mAID cells were treated with DMSO, Auxin and RA as indicated. The stable RA induced genes were identified from upregulated genes at day 6 in control cells (DMSO). The early RA induced genes were identified from upregulated genes at 8 h in control cells (DMSO). Data were analysed using Two-way ANOVA (n = 2) and represented as mean ± s.d., **P < 0.01, ***P < 0.001. (e) Gene set enrichment analysis (GSEA) analysis of RA induced genes (RA upregulated gene list from previously published data, n = 227). The curve represents the evolution of the density of the genes identified in the RNA-seq. The False Discovery Rate (FDR) is calculated by comparing the actual data with 1000 Monte-Carlo simulations. The NES (Normalized Enrichment Score) computes the density of modified genes in the dataset with the random expectancies, normalized by the number of genes found in the given gene cluster, considering the size of the cluster. (f,g) H3K4me3 and RNAPII occupancy before or after RA treatment in control and Auxin-treated degron cells. The enrichments were plotted over the transcription start sites (TSS ± 2 kb) of protein-coding genes. Rows are sorted by decreasing H3K4me3 ChIP–seq occupancy in the control (DMSO RA 0h) cells.
Extended Data Fig. 8
Extended Data Fig. 8. APEX2-based proteomic mapping scheme and characterization of endogenous RNAPII in vivo interactions.
(a) Genomic confirmation of the APEX-modified Rpb1 loci in DPY30–mAID and RBBP5–FKBP degron cells. (b) Sanger sequencing of the wild type and Flag-APEX2-RPB1 knock-ins. (c) Western blot showing the expression of APEX-modified RPB1 in DPY30–mAID and RBBP5–FKBP degron cells. (d) Representative brightfield images of mES cell colonies. (e) RT-qPCR analysis of the expression of pluripotency and differentiation genes in the knock-in cells. Data are from three biological replicates (n = 3) and are analysed using Two-way ANOVA and represented as mean ± s.d. (f) Titration of biotin phenol (BP). Cells stably expressing Flag-APEX2-RPB1 were pre-incubated for 30 min with the indicated concentrations of BP, followed by the addition of 1 mM H2O2 for 1 min. Cell lysates were probed with Streptavidin-HRP. Proximity biotinylation is optimal at a BP concentration of 4 mM. (g) Confirmation of the APEX2 functionality by protein biotinylation in the APEX2-engineered DPY30–mAID and RBBP5–FKBP degron cells. The discrete bands, denoted with asterisks, show APEX2-independent biotinylation by native enzymes. The Connexin-APEX2 overexpressed cell was severed as positive control for the APEX2 system. (h) SILAC-based chromatin proteomic strategy for mapping the neighbourhood interaction networks of APEX2-tagged RNAPII. (i) Principal component analysis (PCA) of SILAC signal in the RNAPII-APEX2 cells with or without agonist. (j) Distribution of SILAC ratio of RNAPII interactions quantified in the chromatin proteomic analyses. Mean log2 SILAC ratio is shown. In total, 1,901 proteins were identified in this experiment. The RNAPII-APEX2-bait (BP+H2O2) population has a right-shifted distribution compared with the no agonist negative control population, which indicates that the log2(SILAC) ratio allows us to distinguish bona fide RNAPII interactions from non-RNAPII interactions. (k) GO network showing significantly (q value < 0.001) enriched terms for positive RNAPII interaction neighbourhoods from RNAPII-APEX2 experiment. The most prominent pathways are indicated. Connecting lines show interaction of protein nodes. (l) KEGG enrichment and GO network showing significantly (q value < 0.001) enriched terms for positive RNAPII interaction neighbourhoods from RNAPII-APEX2 experiment. (m) Principal component analysis (PCA) of SILAC signal in the RNAPII-APEX2 DPY30–mAID cells with or without Auxin treatment. Time trajectory is shown by the dashed arrow. (n) Venn diagram indicating overlap between up or downregulated targets in the indicated samples. (o) Heatmap representing relative protein abundance of DPY30 and selected targets in Auxin treated DPY30–mAID cells. n = 3 independently samples. (p) Scatterplot analysis of proteins identified by SILAC in RNAPII-APEX2 DPY30–mAID cells following Auxin treatment for 2 and 8 h. (q) Gene ontology-based functional classification of 228 downregulated proteins in RNAPII-APEX2 DPY30–mAID cells following Auxin treatment for 2 and 8 h. The dot size is proportional to the number of members in an enrichment set, and colour intensity reflects the p value. Significance based on clusterProfiler analysis with Benjamini-Hochberg-adjusted P values.
Extended Data Fig. 9
Extended Data Fig. 9. INTS11 is required for nascent transcription.
(a) Venn diagram indicating overlap of H3K4me3 interactors and RNAPII-APEX2 dependent interactors from ChIP-MS (chromatin proteomic profiling) data. (b) Relative enrichments of selected targets in various ChIP preparations based on ChIP-MS. (c) Validation of INTS11 interaction with H3K4me3 in RBBP5–FKBP degron cells at different times after dTAG-13 addition. Biotinylated proteins within lysates were enriched using Streptavidin-coated magnetic beads and analysed by Western blot. In parallel, sample in which H2O2 was omitted was prepared as negative control. (d) Schematic representation of the dTAG INTS11 targeting strategy for the INTS11–FKBP degron mES cells. (e) Western blot showing the expression of INTS11 and INTS11–FKBP–HA, using antibodies recognizing INTS11 or the HA in parental and knock-in degron cells. The arrow indicates the specific HA-tagged INTS11–FKBP–HA protein. (f) RT-qPCR analysis showing the expression of selected pluripotency and differentiation genes in the parental and INTS11–FKBP knock-in cells. Data are from three biological replicates (n = 3) and are analysed using Two-way ANOVA and represented as mean ± s.d. (g) Growth curve analysis of parental and INTS11–FKBP E14 cells treated with or without dTAG-13. (h) INTS11 enrichment profiles and heat maps as determined by using the HA-tag in control (0 h) and Auxin-treated (2 h) DPY30–mAID; INTS11–FKBP degron cells. Genome-wide binding averages showed enrichments at the TSS regions (TSS ± 2 kb) of protein coding genes. TSS, transcription start site. Rows were sorted by decreasing ChIP–seq occupancy in the control (0 h) cells. (i) Correlations between TTchem-seq replicate experiments in INTS11–FKBP degron cells treated with or without dTAG-13 for the indicated times. (j) Average profiles for TTchem-seq for the upstream anti-sense RNAs of each annotated protein-coding gene in INTS11 degron cells. TSS, transcription start site. (k) RNAPII profiles of various subclasses of annotations in INTS11–FKBP degron cells with or without dTAG-13 treatment. TSS, transcription start site. mRNA, messenger RNA. snRNA, small nuclear RNA. ncRNA, non-coding RNA. eRNA, enhancer RNA.
Extended Data Fig. 10
Extended Data Fig. 10. Loss of INTS11 causes reduced transcriptional output of protein-coding genes.
(a) Experimental design of SLAM-seq for INTS11–FKBP degron cells. Conversion rates for each position of a 4-thioU-containing SLAM-seq reads (≥ 2 T>C conversions) before or after dTAG-13 treatment. Average conversion rates (centre line) ± s.d. (whiskers) are shown. n = 3 biological replicates. The boxplot indicates the median (middle line) and the third and first quartiles (box); the whiskers show the 1.5× IQR above and below the box. (b) MA plots depicting changes in nascent transcription (SLAM-seq) at the indicated times after dTAG-13 treatment in INTS11–FKBP cells. n = 3 biological replicates. CPM, counts per million mapped reads. (c) H3K4me3 and INTS11 occupancy in mES cells. The enrichments were plotted over the transcription start sites (TSS ± 2 kb) of protein-coding genes. Rows are sorted by decreasing H3K4me3 ChIP–seq occupancy in the WT mES cells. (d) An IGV snapshot comparing ChIP–seq signals in control and dTAG-13-treated INTS11–FKBP cells.
Extended Data Fig. 11
Extended Data Fig. 11. A Model for the roles of H3K4me3 in transcription regulation.
H3K4me3 facilitates the recruitment of factors regulating the release of paused RNAPII at the +1 nucleosome. The H3K4me3 at promoter regions is highly dynamic, and it is maintained by an equilibrium between SET1/COMPASS complexes and KDM5 demethylases at highly transcribed genes. The rapid turnover of H3K4me3 ensures that the pausing step is a highly regulated process by Integrator Complex Subunit 11 (INTS11), where an increase in H3K4me3 leads to a decrease in RNAPII pausing and acute depletion leads to an increase RNAPII pausing.

References

    1. Lauberth SM, et al. H3K4me3 interactions with TAF3 regulate preinitiation complex assembly and selective gene activation. Cell. 2013;152:1021–1036. doi: 10.1016/j.cell.2013.01.052. - DOI - PMC - PubMed
    1. Shilatifard A. The COMPASS family of histone H3K4 methylases: mechanisms of regulation in development and disease pathogenesis. Annu. Rev. Biochem. 2012;81:65–95. doi: 10.1146/annurev-biochem-051710-134100. - DOI - PMC - PubMed
    1. Miller T, et al. COMPASS: a complex of proteins associated with a trithorax-related SET domain protein. Proc. Natl Acad. Sci. USA. 2001;98:12902–12907. doi: 10.1073/pnas.231473398. - DOI - PMC - PubMed
    1. Qu Q, et al. Structure and conformational dynamics of a COMPASS histone H3K4 methyltransferase complex. Cell. 2018;174:1117–1126. doi: 10.1016/j.cell.2018.07.020. - DOI - PMC - PubMed
    1. Piunti A, Shilatifard A. Epigenetic balance of gene expression by Polycomb and COMPASS families. Science. 2016;352:aad9780. doi: 10.1126/science.aad9780. - DOI - PubMed

Publication types