Prediction of CD3 T cells and CD8 T cells expression levels in non-small cell lung cancer based on radiomic features of CT images
- PMID: 36860311
- PMCID: PMC9968855
- DOI: 10.3389/fonc.2023.1104316
Prediction of CD3 T cells and CD8 T cells expression levels in non-small cell lung cancer based on radiomic features of CT images
Abstract
Background: In this work, radiomics characteristics based on CT scans were used to build a model for preoperative evaluation of CD3 and CD8 T cells expression levels in patients with non-small cell lung cancer (NSCLC).
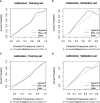
Methods: Two radiomics models for evaluating tumor-infiltrating CD3 and CD8 T cells were created and validated using computed tomography (CT) images and pathology information from NSCLC patients. From January 2020 to December 2021, 105 NSCLC patients with surgical and histological confirmation underwent this retrospective analysis. Immunohistochemistry (IHC) was used to determine CD3 and CD8 T cells expression, and all patients were classified into groups with high and low CD3 T cells expression and high and low CD8 T cells expression. The CT area of interest had 1316 radiomic characteristics that were retrieved. The minimal absolute shrinkage and selection operator (Lasso) technique was used to choose components from the IHC data, and two radiomics models based on CD3 and CD8 T cells abundance were created. Receiver operating characteristic (ROC), calibration curve, and decision curve analyses were used to examine the models' ability to discriminate and their clinical relevance (DCA).
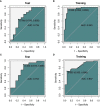
Results: A CD3 T cells radiomics model with 10 radiological characteristics and a CD8 T cells radiomics model with 6 radiological features that we created both demonstrated strong discrimination in the training and validation cohorts. The CD3 radiomics model has an area under the curve (AUC) of 0.943 (95% CI 0.886-1), sensitivities, specificities, and accuracy of 96%, 89%, and 93%, respectively, in the validation cohort. The AUC of the CD8 radiomics model was 0.837 (95% CI 0.745-0.930) in the validation cohort, with sensitivity, specificity, and accuracy values of 70%, 93%, and 80%, respectively. Patients with high levels of CD3 and CD8 expression had better radiographic results than patients with low levels of expression in both cohorts (p<0.05). Both radiomic models were therapeutically useful, as demonstrated by DCA.
Conclusions: When making judgments on therapeutic immunotherapy, CT-based radiomic models can be utilized as a non-invasive way to evaluate the expression of tumor-infiltrating CD3 and CD8 T cells in NSCLC patients.
Keywords: CD3; CD8; model; non-small-cell lung cancer; radiomics.
Copyright © 2023 Chen, Chen, Ni, Shen, Wei, Xia, Yang, Yang and Zhao.
Conflict of interest statement
The authors declare that the research was conducted in the absence of any commercial or financial relationships that could be construed as a potential conflict of interest.
Figures


Similar articles
-
Radiomics study for predicting the expression of PD-L1 in non-small cell lung cancer based on CT images and clinicopathologic features.J Xray Sci Technol. 2020;28(3):449-459. doi: 10.3233/XST-200642. J Xray Sci Technol. 2020. PMID: 32176676
-
A Comprehensive Nomogram Combining CT Imaging with Clinical Features for Prediction of Lymph Node Metastasis in Stage I-IIIB Non-small Cell Lung Cancer.Ther Innov Regul Sci. 2022 Jan;56(1):155-167. doi: 10.1007/s43441-021-00345-1. Epub 2021 Oct 26. Ther Innov Regul Sci. 2022. PMID: 34699046
-
The NSCLC immunotherapy response predicted by tumor-infiltrating T cells via a non-invasive radiomic approach.Front Immunol. 2024 Sep 9;15:1379812. doi: 10.3389/fimmu.2024.1379812. eCollection 2024. Front Immunol. 2024. PMID: 39315096 Free PMC article.
-
CT-based radiomics for predicting Ki-67 expression in lung cancer: a systematic review and meta-analysis.Front Oncol. 2024 Feb 7;14:1329801. doi: 10.3389/fonc.2024.1329801. eCollection 2024. Front Oncol. 2024. PMID: 38384802 Free PMC article.
-
Review of the use of radiomics to assess the risk of recurrence in early-stage non-small cell lung cancer.Transl Lung Cancer Res. 2023 Jul 31;12(7):1575-1589. doi: 10.21037/tlcr-23-5. Epub 2023 Jul 18. Transl Lung Cancer Res. 2023. PMID: 37577298 Free PMC article. Review.
Cited by
-
Applications of CT-based radiomics for the prediction of immune checkpoint markers and immunotherapeutic outcomes in non-small cell lung cancer.Front Immunol. 2024 Aug 22;15:1434171. doi: 10.3389/fimmu.2024.1434171. eCollection 2024. Front Immunol. 2024. PMID: 39238640 Free PMC article. Review.
-
Heterogeneity of tertiary lymphoid structures predicts the response to neoadjuvant therapy and immune microenvironment characteristics in triple-negative breast cancer.Br J Cancer. 2025 Feb;132(3):295-310. doi: 10.1038/s41416-024-02917-y. Epub 2024 Dec 10. Br J Cancer. 2025. PMID: 39658606
-
Bojungikki-Tang Augments Pembrolizumab Efficacy in Human PBMC-Injected H460 Tumor-Bearing Mice.Life (Basel). 2024 Sep 30;14(10):1246. doi: 10.3390/life14101246. Life (Basel). 2024. PMID: 39459546 Free PMC article.
-
Different MRI-based radiomics machine learning models to predict CD3+ tumor-infiltrating lymphocytes in rectal cancer.Front Oncol. 2025 Apr 28;15:1509207. doi: 10.3389/fonc.2025.1509207. eCollection 2025. Front Oncol. 2025. PMID: 40356764 Free PMC article.
-
Pretreatment CT-Based Machine Learning Radiomics Model Predicts Response in Inoperable Stage III NSCLC Treated with Concurrent Radiochemotherapy Plus PD-1 Inhibitors.Technol Cancer Res Treat. 2025 Jan-Dec;24:15330338251351109. doi: 10.1177/15330338251351109. Epub 2025 Jun 12. Technol Cancer Res Treat. 2025. PMID: 40501221 Free PMC article.
References
LinkOut - more resources
Full Text Sources
Research Materials

