

The Optimum Lipid Level for the Juvenile Redclaw Crayfish Cherax quadricarinatus: Practical Diets with Soybean Oil as the Lipid Source
- PMID: 36860426
- PMCID: PMC9973139
- DOI: 10.1155/2022/2640479
The Optimum Lipid Level for the Juvenile Redclaw Crayfish Cherax quadricarinatus: Practical Diets with Soybean Oil as the Lipid Source
Abstract
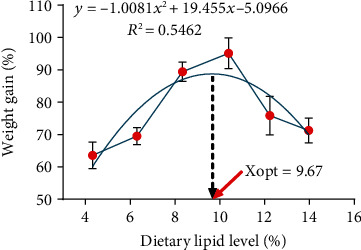
As a new species in aquaculture, the lipid nutrition requirement for the juvenile redclaw crayfish Cherax quadricarinatus on a dietary basis on a practical formula needs to be evaluated accurately. In this study, the optimum dietary lipid level was explained by analyzing the growth performance, antioxidant state, lipid metabolism, and gut microbiota of C. quadricarinatus after an eight-week cultivation trial. Six diets with different soybean oil levels (named L0, L2, L4, L6, L8, and L10) were fed to C. quadricarinatus (11.39 ± 0.28 g). The results indicated that the specific growth rate and weight gain of crayfish fed the L4 and L6 diets were significantly higher than those of the other groups (P < 0.05). By the analysis of a second-order polynomial regression model according to growth performance (weight gain rate), the optimum lipid level in a practical diet for juvenile C. quadricarinatus was 9.67%. The survival, condition factor, and hepatosomatic index of crayfish were not significantly affected by dietary oil levels (P > 0.05). As the level of dietary lipids increased, the total antioxidant capacity and glutathione peroxidase activity in serum showed a tendency to rise and then fall and the enzyme activity was highest in crayfish fed the L6 diet. Gut lipase and pepsin activities showed the highest value in crayfish fed the L6 diet. There was no significant difference in acetyl-CoA carboxylase and carnitine palmitoyltransferase-1 contents in crayfish among all the groups (P > 0.05). The relative abundance of Proteobacteria in the phylum and Citrobacter in the genus showed a significant decrease in crayfish of the L10 diet, while the relative abundance of Firmicutes in the phylum markedly increased compared to that of the other groups (P < 0.05). In summary, the results indicated that the 10.39% (L6 diet) dietary lipid level could induce better growth performance, antioxidant ability, and digestive enzyme activity. Most of the fatty acid composition of muscle is not closely related to the fatty acid composition of the diet. Moreover, the composition and diversity of the gut microbiota of C. quadricarinatus were changed by high dietary lipid levels.
Copyright © 2022 Chengzhuang Chen et al.
Conflict of interest statement
The authors declare that they have no known competing financial interests or personal relationships that could have appeared to influence the work reported in this paper.
Figures


References
-
- Watanabe T. Lipid Nutrition in Fish. Comparative Biochemistry and Physiology Part B: Comparative Biochemistry . 1982;73(1):3–15. doi: 10.1016/0305-0491(82)90196-1. - DOI
-
- Bautista-Teruel M. N., Koshio S. S., Ishikawa M. Diet development and evaluation for juvenile abalone, _Haliotis asinina_ Linne: lipid and essential fatty acid levels. Aquaculture . 2011;312(1-4):172–179. doi: 10.1016/j.aquaculture.2011.01.004. - DOI
-
- Zhao J., Wen X., Li S., Zhu D., Li Y. Effects of dietary lipid levels on growth, feed utilization, body composition and antioxidants of juvenile mud crab _Scylla paramamosain_ (Estampador) Aquaculture . 2015;435:200–206. doi: 10.1016/j.aquaculture.2014.09.018. - DOI
-
- Trenzado C. E., Carmona R., Merino R., et al. Effect of dietary lipid content and stocking density on digestive enzymes profile and intestinal histology of rainbow trout (_Oncorhynchus mykiss_) Aquaculture . 2018;497:10–16. doi: 10.1016/j.aquaculture.2018.07.031. - DOI
-
- Jannathulla R., Chitra V., Vasanthakumar D., et al. Effect of dietary lipid/essential fatty acid level on Pacific whiteleg shrimp, Litopenaeus vannamei (Boone, 1931) reared at three different water salinities–Emphasis on growth, hemolymph indices and body composition. Aquaculture . 2019;513, article 734405
LinkOut - more resources
Full Text Sources
Research Materials