. 2023 Feb 13:14:1102912.
doi: 10.3389/fimmu.2023.1102912. eCollection 2023.

Cell morphology as a biological fingerprint of chondrocyte phenotype in control and inflammatory conditions

Affiliations

Cell morphology as a biological fingerprint of chondrocyte phenotype in control and inflammatory conditions

Mischa Selig et al. Front Immunol. .

Abstract

Introduction: Little is known how inflammatory processes quantitatively affect chondrocyte morphology and how single cell morphometric data could be used as a biological fingerprint of phenotype.

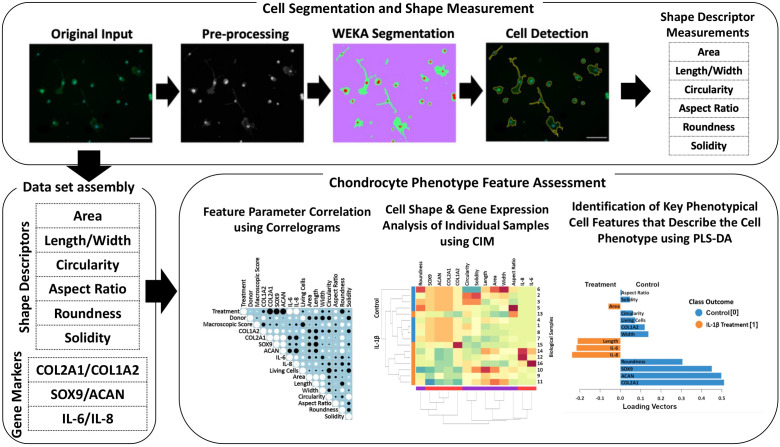
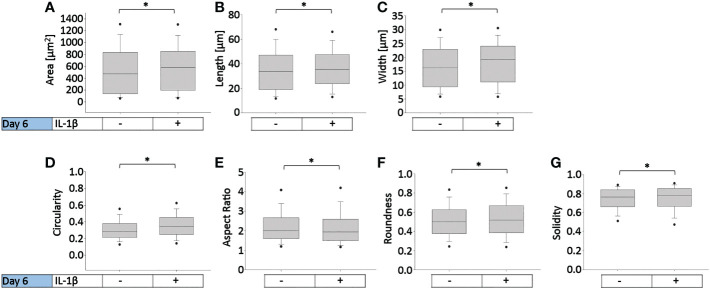
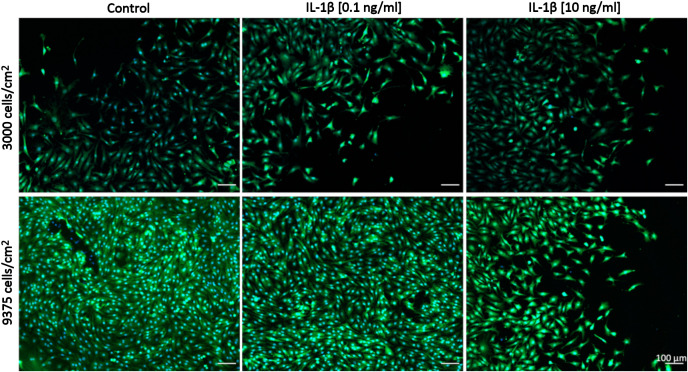
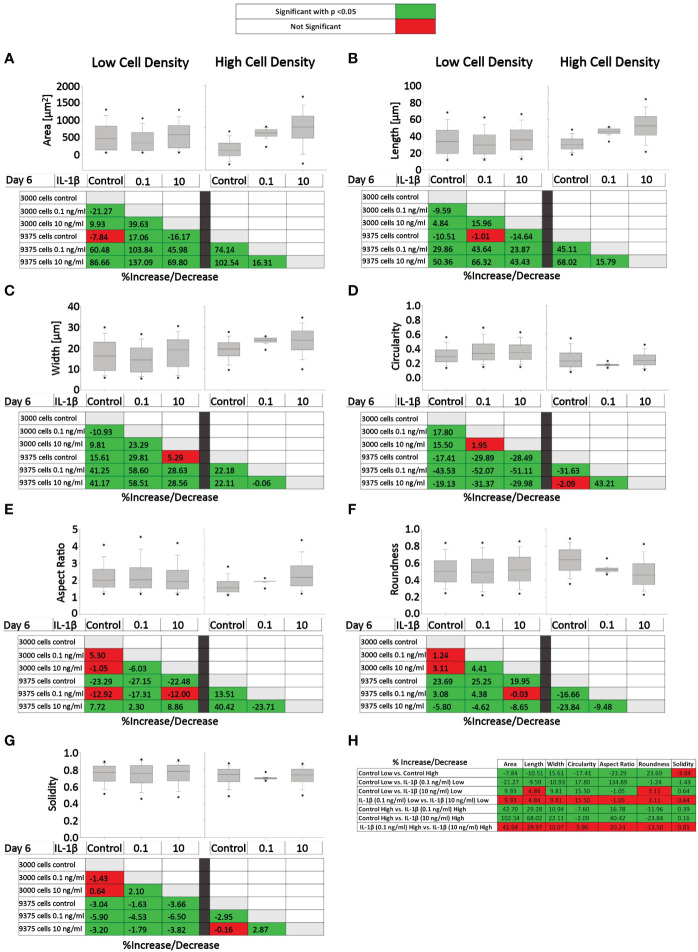
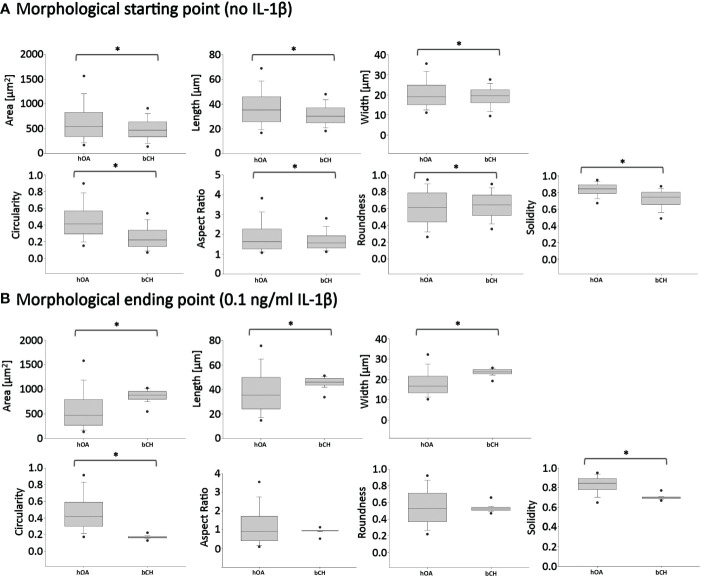
Methods: We investigated whether trainable high-throughput quantitative single cell morphology profiling combined with population-based gene expression analysis can be used to identify biological fingerprints that are discriminatory of control vs. inflammatory phenotypes. The shape of a large number of chondrocytes isolated from bovine healthy and human osteoarthritic (OA) cartilages was quantified under control and inflammatory (IL-1β) conditions using a trainable image analysis technique measuring a panel of cell shape descriptors (area, length, width, circularity, aspect ratio, roundness, solidity). The expression profiles of phenotypically relevant markers were quantified by ddPCR. Statistical analysis, multivariate data exploration, and projection-based modelling were used for identifying specific morphological fingerprints indicative of phenotype.

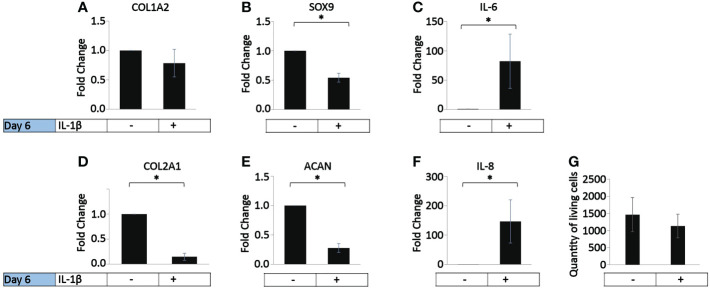
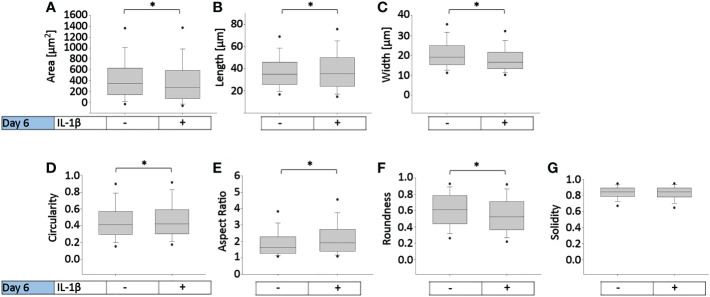
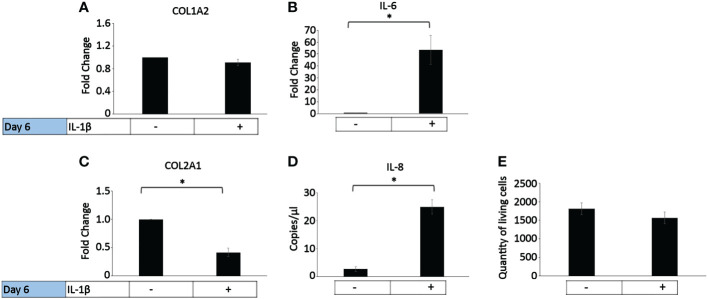
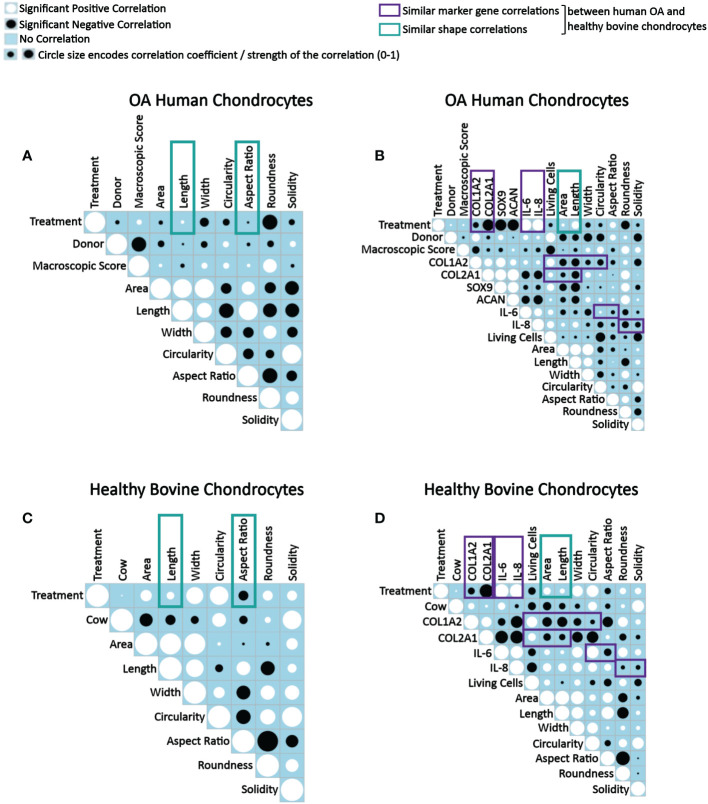
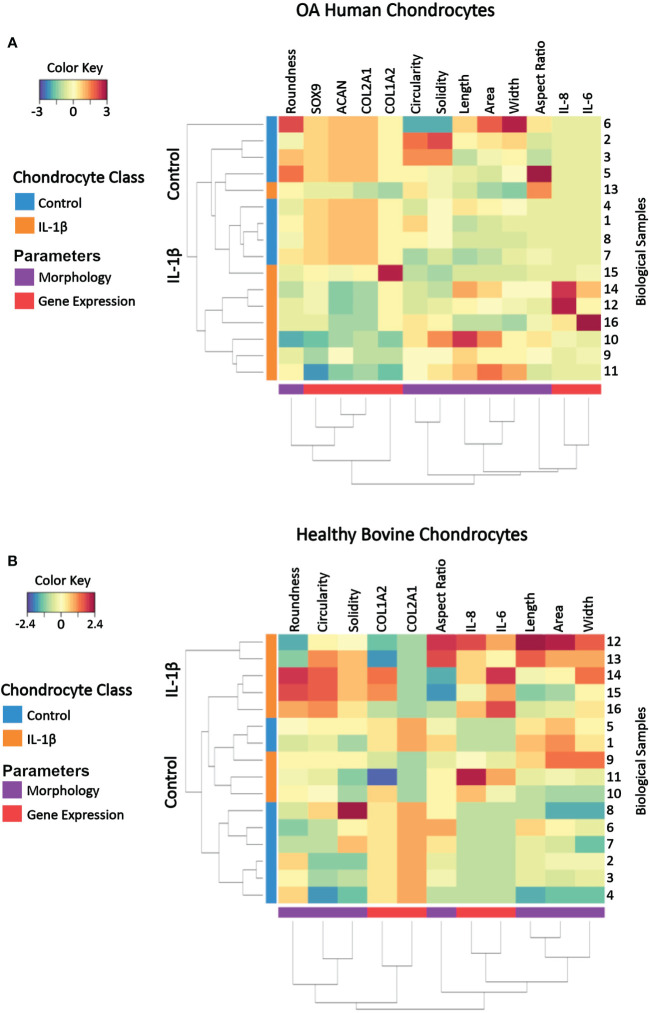
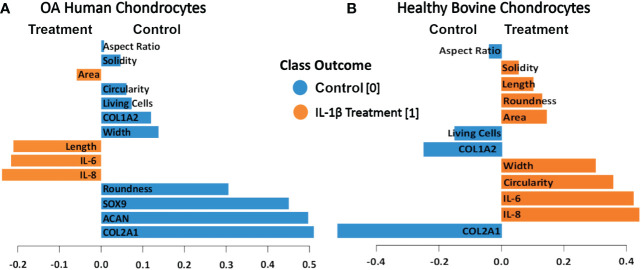
Results: Cell morphology was sensitive to both cell density and IL-1β. In both cell types, all shape descriptors correlated with expression of extracellular matrix (ECM)- and inflammatory-regulating genes. A hierarchical clustered image map revealed that individual samples sometimes responded differently in control or IL-1β conditions than the overall population. Despite these variances, discriminative projection-based modeling revealed distinct morphological fingerprints that discriminated between control and inflammatory chondrocyte phenotypes: the most essential morphological characteristics attributable to non-treated control cells was a higher cell aspect ratio in healthy bovine chondrocytes and roundness in OA human chondrocytes. In contrast, a higher circularity and width in healthy bovine chondrocytes and length and area in OA human chondrocytes indicated an inflammatory (IL-1β) phenotype. When comparing the two species/health conditions, bovine healthy and human OA chondrocytes exhibited comparable IL-1β-induced morphologies in roundness, a widely recognized marker of chondrocyte phenotype, and aspect ratio.

Discussion: Overall, cell morphology can be used as a biological fingerprint for describing chondrocyte phenotype. Quantitative single cell morphometry in conjunction with advanced methods for multivariate data analysis allows identifying morphological fingerprints that can discriminate between control and inflammatory chondrocyte phenotypes. This approach could be used to assess how culture conditions, inflammatory mediators, and therapeutic modulators regulate cell phenotype and function.

Keywords: IL-1; cell morphology; cell shape; chondrocytes; chondrogenic phenotype; inflammation; osteoarthritis; projection-based modelling.


Conflict of interest statement

The authors declare that the research was conducted in the absence of any commercial or financial relationships that could be construed as a potential conflict of interest.

Figures

Figure 1
Figure 1
Illustration of the workflow for high-throughput quantitative single cell morphometry in conjunction with multivariate data analysis that allows identification of cell morphological fingerprints. Single cells are first detected using trainable WEKA image segmentation, and then shape descriptors (e.g., area, length, width, circularity, aspect ratio, roundness, and solidity) on a large number of cells are measured. Together with other phenotypic data (e.g., gene expression profiles), the data set is assembled for multivariate cell feature analysis. The relationship between parameters is analyzed using correlograms, CIM, and PLS-DA. Correlograms demonstrate positive and negative relationships across the parameters. CIM can be used to illustrate the expression levels of the features on the biological sample level. Key morphological and other phenotypical cell features, which discriminate between (e.g., control vs. inflammatory) cell phenotypes are calculated using PLS-DA. This multivariate phenotyping approach is applicable to other conditions and cell types and identifies characteristic morphological fingerprints that describe a cell’s phenotype.
Figure 2
Figure 2
Effect of persistent IL-1β exposure on the marker gene expression of human OA chondrocytes. Human OA chondrocytes were incubated for 6 days with 0.1 ng/ml or without IL-1β (n = 8 per group from 8 different donors). Data is representative of the mean fold change compared to control (without IL-1β) +/- SEM of (A) COL1A2, (B) COL2A1, (C) SOX9, (D) ACAN, (E) IL-6, and (F) IL-8. For fold change vs. control, each control was set to 1. (G) quantity of living cells. *p<0.05.
Figure 3
Figure 3
Effect of persistent IL-1β exposure on the cell morphology of human OA chondrocytes. Human OA chondrocytes were incubated for 6 days with 0.1 ng/ml or without IL-1β. Data is representative of (A) area, (B) length, (C) width, (D) circularity, (E) aspect ratio, (F) roundness, and (G) solidity values obtained from individually measured chondrocytes with 11733 cells analyzed for the control group and 9058 cells analyzed for the IL-1β incubation group from n = 8 per group isolated from 8 different donors. Box plots: the boxes define the 25th and 75th percentiles, with a central line at the median; error bars define the 10th and 90th percentiles; and dots define the 5th and 95th percentiles.*p<0.05.
Figure 4
Figure 4
Effect of persistent IL-1β exposure on the marker gene expression of healthy bovine chondrocytes. Bovine healthy chondrocytes were incubated for 6 days with 10 ng/ml or without IL-1β (n = 8 per group isolated from 3 different cows with samples treated in duplicate or triplicate). Data is representative of the mean fold change compared to control (without IL-1β) +/- SEM of (A) COL1A2, (B) IL-6, and (C) COL2A1. For fold change vs. control, each control was set to 1. (D) IL-8 is expressed as the mean expression in copies/µl +/- SEM since half of the controls expressed very low levels of IL-8. (E) quantity of living cells. *p<0.05.
Figure 5
Figure 5
Effect of persistent IL-1β exposure on the cell morphology of healthy bovine chondrocytes. Bovine healthy chondrocytes were incubated for 6 days with 10 ng/ml or without IL-1β. Data is representative of (A) area, (B) length, (C) width, (D) circularity, (E) aspect ratio, (F) roundness, and (G) solidity values obtained from individually measured chondrocytes with 1181 cells analyzed for the control group and 2917 cells analyzed for the IL-1β incubation group from n = 8 per group isolated from 3 different cows with samples treated in duplicate or triplicate. Box plots: the boxes define the 25th and 75th percentiles, with a central line at the median; error bars define the 10th and 90th percentiles; and dots define the 5th and 95th percentiles. *p<0.05.
Figure 6
Figure 6
Representative images of healthy bovine single cells. Representative images of healthy bovine chondrocytes in high or low density cell cultures treated with 0 (control), low (0.1 ng/ml), or high (10 ng/ml) doses of IL-1β for 6 days from n = 8 per group isolated from 3 different cows with samples treated in duplicate or triplicate Scale bar, 100 µm.
Figure 7
Figure 7
Comparison of healthy bovine single cell morphology under persistent IL-1β conditions in low- and high-density cell cultures. Healthy bovine chondrocytes in high or low density cell cultures were treated with 0 (control), 0.1 ng/ml, or 10 ng/ml of IL-1β for 6 days. Data is representative of (A) area, (B) length, (C) width, (D) circularity, (E) aspect ratio, (F) roundness, and (G) solidity with 1181, 2024, and 2917 cells analyzed in the control, 1 ng/ml IL-1β, 10 ng/ml IL-1β-treated cells under low cell density culture conditions and 3604, 2583, and 1923 cells analyzed in the control, 0.1 ng/ml IL-1β, 10 ng/ml IL-1β-treated cells under high cell density culture conditions from n = 8 per group isolated from 3 different cows wit samples treated in duplicate or triplicate. Box plots: the boxes define the 25th and 75th percentiles, with a central line at the median; error bars define the 10th and 90th percentiles; and dots define the 5th and 95th percentiles. In the tables below each of the box plots, the percent changes (increase/decrease) between the specified conditions are provided, with the green color code indicating a significant difference (p<0.05) and the red color code indicating a non-significant difference the two conditions. (H) Percent increase/decrease values for each of the shape descriptors comparing the various conditions, with the green color code indicating a significant difference (p<0.05) and a red color code indicating a non-significant difference.
Figure 8
Figure 8
Pairwise comparisons of shape descriptors between human OA vs. healthy bovine chondrocytes under similar high density culture conditions. To allow this side-by-side comparison, data reported in Figure 2 was used as input human OA (hOA) chondrocyte data and data reported in Figure 6 was used as input bovine chondrocyte (bCH) data. Day 6 after treatment. (A): hOA chondrocytes were compared to bCHs under control conditions (without IL-1β). (B): hOA chondrocytes were compared to bCHs under low dose IL-1β (0.1 ng/ml) conditions. The horizontal lines represent the median and the boxes show the 25th and 75th percentiles, while the vertical lines represent the 10th and 90th percentiles and the black points illustrate the 5th and 95th percentiles. *p<0.05.
Figure 9
Figure 9
Correlograms depicting correlations between parameters in OA human and healthy bovine chondrocytes across all conditions and highlighting similar correlations found in both cell types. Correlation matrix plots of (A, B) human OA chondrocytes treated with or without 0.1 ng/ml IL-1β (n = 8 per group from 8 different donors) and (C, D) healthy bovine chondrocytes treated with or without 10 ng/ml IL-1β (n = 8 per group from 3 different cows with samples treated in duplicate or triplicate). Significant positive correlations between the two specified conditions are represented as black circles, while significant negative correlations are represented as white circles (p<0.05). A blue box indicates a lack of correlation. The strength of the relationship is indicated by the size of the circle with a larger circle indicative of a stronger correlation (higher correlation coefficient). (A, C) Data is representative of values obtained from individually measured chondrocytes for each of the cell morphology descriptors (n = 20777 OA human chondrocytes from n = 16 control and IL-1β-treated samples; n = 2917 healthy bovine chondrocytes from n = 16 control and IL-1β-treated samples). (B, D) Data is representative of the average cell morphology and gene expression values of n= 16 individual experiments for OA human and healthy bovine chondrocytes. The control class was coded as 0 and the IL-1β treatment class was coded as 1. The purple and green boxes indicate similarities in data between OA human and healthy bovine chondrocytes.
Figure 10
Figure 10
Clustered image map of cell morphology and gene expression values from individual samples of (A) OA human and (B) healthy bovine chondrocytes that were untreated or treated with IL-1β. Each horizontal row represents 16 biological samples treated with or without IL-1β as indicated in the figure (n=8 per group isolated from n = 8 different OA donors and n = 3 healthy bovine cows with samples treated in duplicate or triplicate). Rows are clustered using cell morphology and gene expression and color-coded according to experimental conditions: control cells vs. IL-1β incubation. A CIM visualizes scaled and centered data, with a color code that indicates the standard deviations away from the mean of each feature, whereas the dendrograms indicate clustering. The level of the parameters of a given category and their intensity of the red color denotes the number of standard deviations above the overall mean across all samples and intensity of the blue color denotes the number of standard deviations below the overall mean representing increases and decreases in the markers from the overall mean category. Based on the multi-feature signatures, the CIM revealed a discrimination of the control vs. IL-1β and revealed signature patterns.
Figure 11
Figure 11
PLS-DA of cell morphology descriptors and chondrogenic and inflammatory gene expression markers in (A) OA human and (B) healthy bovine chondrocytes. We used scaled data from Figure 8 for the PLS-DA. The length of the loading vector bars of the PLS-DA plots, represent the importance of a feature to discriminate between control and IL-1β incubation phenotypes. All data reported in Figure 8 was used as input data using the averages of the data. The control classes were coded as 0 and the IL-1β treated classes were coded as 1.

References

    1. Khella CM, Asgarian R, Horvath JM, Rolauffs B, Hart ML. An evidence-based systematic review of human knee post-traumatic osteoarthritis (PTOA): Timeline of clinical presentation and disease markers, comparison of knee joint PTOA models and early disease implications. Int J Mol Sci (2021) 22(4):1996. doi: 10.3390/ijms22041996 - DOI - PMC - PubMed
    1. Jacques C, Gosset M, Berenbaum F, Gabay C. The role of IL-1 and IL-1Ra in joint inflammation and cartilage degradation. Vitam Horm. (2006) 74:371–403. doi: 10.1016/S0083-6729(06)74016-X - DOI - PubMed
    1. Tseng C, Chen Y, Chang W, Tsai W, Ou T, Wu C, et al. . Dual role of chondrocytes in rheumatoid arthritis: The chicken and the egg. Int J Mol Sci (2020) 21(3):1071. doi: 10.3390/ijms21031071 - DOI - PMC - PubMed
    1. Daheshia M, Yao JQ. The interleukin 1β pathway in the pathogenesis of osteoarthritis. J Rheumatol (2008) 35(12):2306–12. doi: 10.3899/jrheum.080346 - DOI - PubMed
    1. Khella CM, Horvath JM, Asgarian R, Rolauffs B, Hart ML. Anti-inflammatory therapeutic approaches to prevent or delay post-traumatic osteoarthritis (PTOA) of the knee joint with a focus on sustained delivery approaches. Int J Mol Sci (2021) 22(15):8005. doi: 10.3390/ijms22158005 - DOI - PMC - PubMed

Publication types

LinkOut - more resources