. 2023 Feb 13:14:1089243.
doi: 10.3389/fimmu.2023.1089243. eCollection 2023.

An arrayed CRISPR screen of primary B cells reveals the essential elements of the antibody secretion pathway

Affiliations

An arrayed CRISPR screen of primary B cells reveals the essential elements of the antibody secretion pathway

Stephanie Trezise et al. Front Immunol. .

Abstract

Background: Humoral immunity depends on the differentiation of B cells into antibody secreting cells (ASCs). Excess or inappropriate ASC differentiation can lead to antibody-mediated autoimmune diseases, while impaired differentiation results in immunodeficiency.

Methods: We have used CRISPR/Cas9 technology in primary B cells to screen for regulators of terminal differentiation and antibody production.

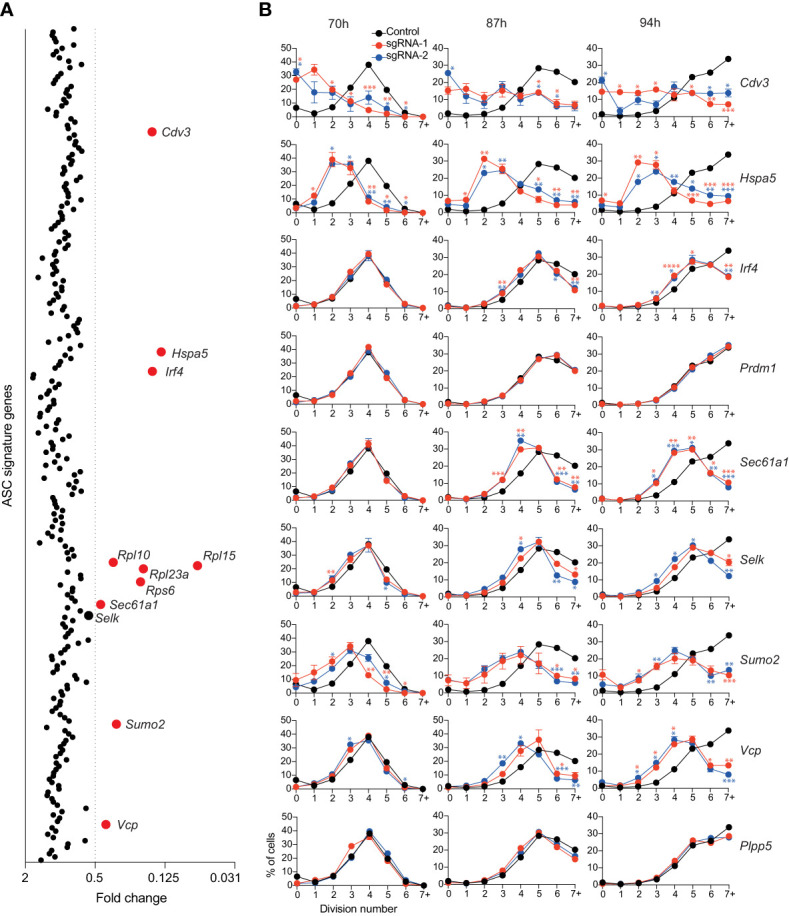
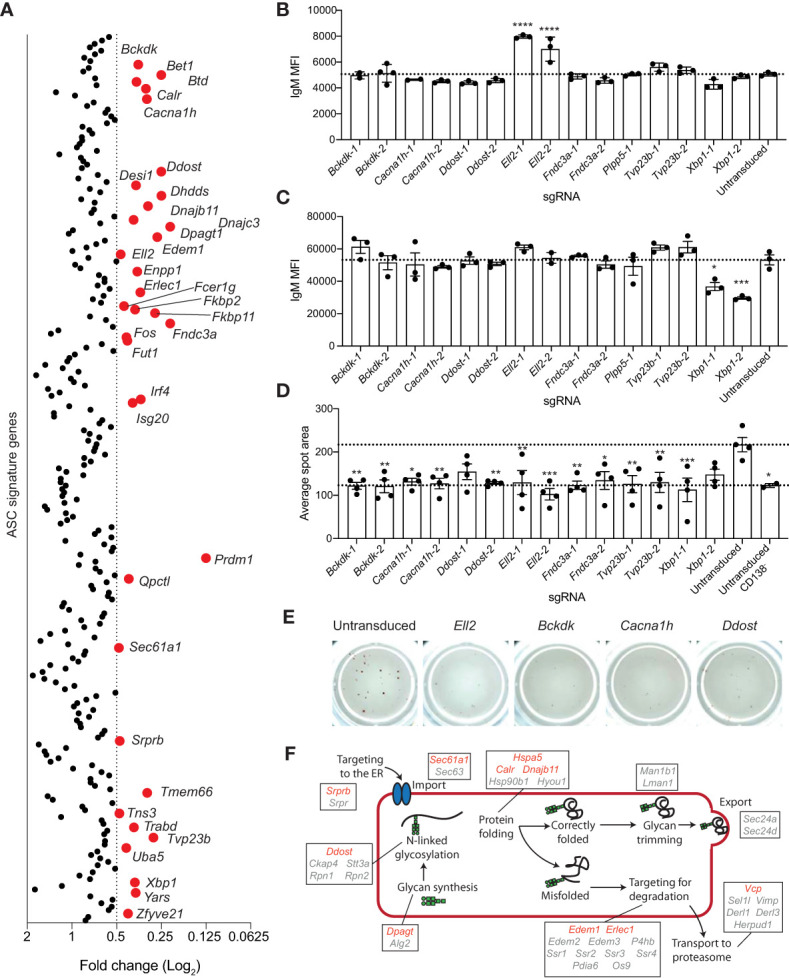
Results: We identified several new positive (Sec61a1, Hspa5) and negative (Arhgef18, Pold1, Pax5, Ets1) regulators that impacted on the differentiation process. Other genes limited the proliferative capacity of activated B cells (Sumo2, Vcp, Selk). The largest number of genes identified in this screen (35) were required for antibody secretion. These included genes involved in endoplasmic reticulum-associated degradation and the unfolded protein response, as well as post-translational protein modifications.

Discussion: The genes identified in this study represent weak links in the antibody-secretion pathway that are potential drug targets for antibody-mediated diseases, as well as candidates for genes whose mutation results in primary immune deficiency.

Keywords: ER associated degradation (ERAD); endoplasmic reticulum; humoral immunity; immunodeficiency; in vitro differentiation; plasma cell; unfolded protein response.


Conflict of interest statement

The authors declare that the research was conducted in the absence of any commercial or financial relationships that could be construed as a potential conflict of interest.

Figures

Figure 1
Figure 1
Identification of genes essential for LPS driven B cell differentiation in vitro. (A) Workflow of targeted CRISPR screen. Naïve splenic B cells were isolated from Cas9 expressing transgenic mice, activated with LPS and transduced with an arrayed lentiviral library that co-expressed specific sgRNAs and BFP. Three days after transduction, cells were analyzed by flow cytometry and culture supernatant by ELISA. (B) Average fold changes in the proportion of transduced cells (BFP+) that express CD138 for each targeted gene relative to the untransduced control. Genes with a fold change ≤0.5 are labelled and highlighted in red. Data points represent the mean of 2 independent sgRNAs from 2 replicate experiments. (C) Proportion of CD138+ cells among cells transduced with sgRNAs (BFP+) targeting Hspa5, Irf4, Prdm1, Sec61a1 or the Plpp5 control at the indicated time post-activation with LPS. Data points represent the mean of triplicate wells and error bars indicate the S.E.M. *p < 0.05, **p < 0.01, ***p < 0.001, ****p < 0.0001. Data in (C) is representative of 3 independent experiments.
Figure 2
Figure 2
Identification of genes that repress ASC differentiation in vitro. (A) Overview of experimental workflow for targeted arrayed CRISPR/Cas9 screen. Naïve splenic B cells were isolated from Cas9 expressing transgenic mice and transduced with an arrayed lentiviral sgRNA library. Following transduction, cells were cultured in LPS + IL-4 for 4 days before analysis by flow cytometry. (B) Each data point represents the average fold change in the proportion of transduced cells (BFP+) that are CD138+ for both sgRNAs targeting a particular gene relative to the untransduced controls on the same plate. Genes with a fold change of ≤0.5 or ≥2 are labelled and highlighted in red. Data points represent the mean of 2 independent sgRNAs from 2 replicate experiments. (C) Naïve B cells from Cas9 transgenic mice were transduced with sgRNAs targeting the indicated genes and cultured in LPS. At the indicated timepoints, the proportion of CD138+ cells within the transduced (BFP+) population was assessed by flow cytometry. (D) Naïve B cells from Cas9 transgenic mice were labelled with the division tracking dye CTY, transduced with sgRNAs targeting Pold1 and cultured in LPS. At the indicated timepoints, the dilution of CTY within the transduced (BFP+) population was assessed by flow cytometry. Data points represent the mean of triplicate wells and error bars indicate the S.E.M. (C, D) are representative of 2 independent experiments. *p < 0.05, **p < 0.01, ***p < 0.001.
Figure 3
Figure 3
Genes affecting total live cell number. (A) Experimental workflow is described in Figure 1A . Average fold changes in the total number of live cells for each targeted gene relative to the untransduced control. Genes with a fold change of ≤0.5 are labelled and highlighted in red. Data points represent the mean of 2 independent sgRNAs from 2 replicate experiments. (B) Naïve B cells from Cas9 transgenic mice were labelled with the division tracking dye CTY, activated with LPS and transduced with sgRNAs targeting Irf4, Prdm1, Cdv3, Sumo2, Sec61a1, Hspa5, Selk, Vcp or the Plpp5 control. At the indicated timepoints, the dilution of CTY was assessed by flow cytometry. Data points represent the mean proportion of cells in each division from triplicate wells. Error bars indicate the S.E.M. Representative of 3 independent experiments. *p < 0.05, **p < 0.01, ***p < 0.001, ****p < 0.0001.
Figure 4
Figure 4
Genes essential for antibody secretion. (A) Experimental workflow is described in Figure 1A . The concentration of IgM in the culture supernatant was measure by ELISA and normalized to the live cell number. Data are presented as average fold change in IgM per cell for each targeted gene relative to the untransduced control. Genes with a fold change of ≤0.5 are labelled and highlighted in red. Data points represent the mean of 2 independent sgRNAs from 2 replicate experiments. (B, C) Naïve B cells from Cas9 transgenic mice were activated with LPS, transduced with sgRNAs targeting Xbp1, Ell2, Bckdk, Cacna1h, Ddost, Fndc3a, Tvp23b, or the Plpp5 control, and cultured for a further 3 days before analysis. Mean fluorescence intensity (MFI) of IgM on the (B) plasma membrane or (C) total cellular IgM. (D, E) At 2 days post-transduction, transduced and untransduced cells were sorted and re-cultured overnight before transfer to ELISpot plates. (D) Average spot size formed and (E) representative wells are shown. Error bars indicate S.E.M. and dotted lines indicate the mean of the untransduced samples. Data in (B–E) are representative of 2-3 independent experiments. (F) Overview of the ER protein folding pathway (KEGG pathway: mmu04141) with genes within the ASC gene signature labelled. Red indicates secretion screen hits and grey indicates genes that did not reach the fold change cut-off. *p < 0.05, **p < 0.01, ***p < 0.001, ****p < 0.0001.

References

    1. Nutt SL, Hodgkin PD, Tarlinton DM, Corcoran LM. The generation of antibody-secreting plasma cells. Nat Rev Immunol (2015) 15(3):160–71. doi: 10.1038/nri3795 - DOI - PubMed
    1. Kwon H, Thierry-Mieg D, Thierry-Mieg J, Kim HP, Oh J, Tunyaplin C, et al. . Analysis of interleukin-21-induced Prdm1 gene regulation reveals functional cooperation of STAT3 and IRF4 transcription factors. Immunity (2009) 31(6):941–52. doi: 10.1016/j.immuni.2009.10.008 - DOI - PMC - PubMed
    1. Ochiai K, Maienschein-Cline M, Simonetti G, Chen J, Rosenthal R, Brink R, et al. . Transcriptional regulation of germinal center b and plasma cell fates by dynamical control of IRF4. Immunity (2013) 38(5):918–29. doi: 10.1016/j.immuni.2013.04.009 - DOI - PMC - PubMed
    1. Saito M, Gao J, Basso K, Kitagawa Y, Smith PM, Bhagat G, et al. . A signaling pathway mediating downregulation of BCL6 in germinal center b cells is blocked by BCL6 gene alterations in b cell lymphoma. Cancer Cell (2007) 12(3):280–92. doi: 10.1016/j.ccr.2007.08.011 - DOI - PubMed
    1. Sciammas R, Shaffer AL, Schatz JH, Zhao H, Staudt LM, Singh H. Graded expression of interferon regulatory factor-4 coordinates isotype switching with plasma cell differentiation. Immunity (2006) 25(2):225–36. doi: 10.1016/j.immuni.2006.07.009 - DOI - PubMed

Publication types