. 2023 Jan 22;14(3):322-335.
doi: 10.7150/jca.80977. eCollection 2023.

Bioinformatic analysis of the obesity paradox and possible associated factors in colorectal cancer using TCGA cohorts

Affiliations

Bioinformatic analysis of the obesity paradox and possible associated factors in colorectal cancer using TCGA cohorts

Dong Min Lim et al. J Cancer. .

Abstract

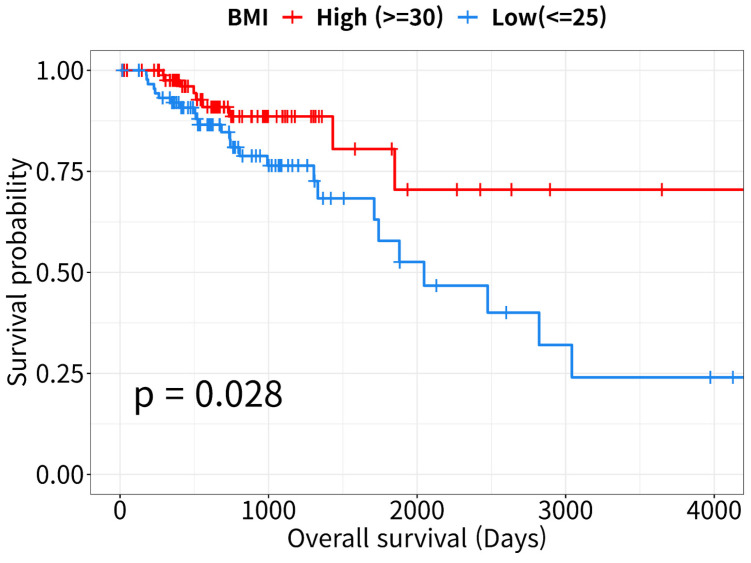
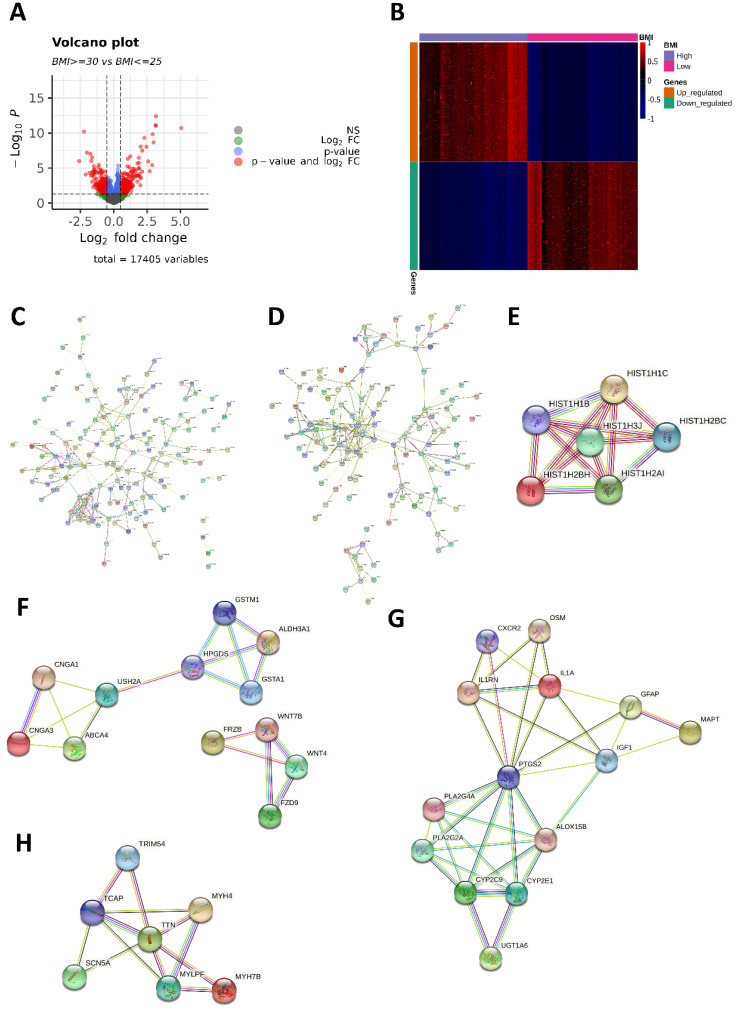
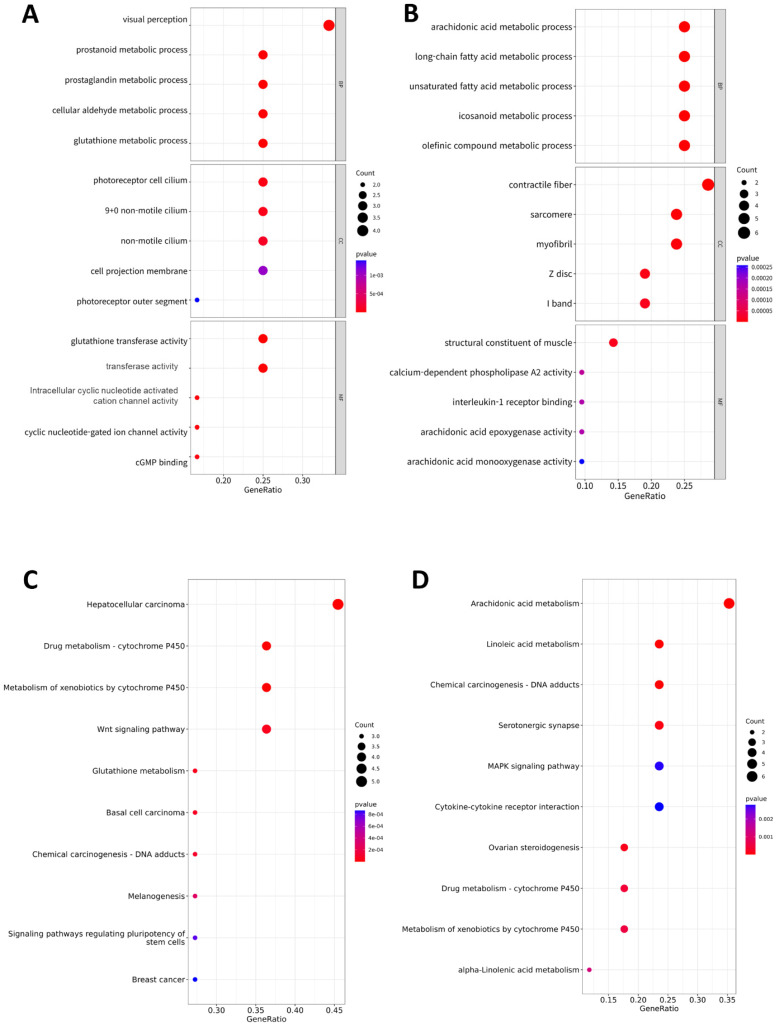
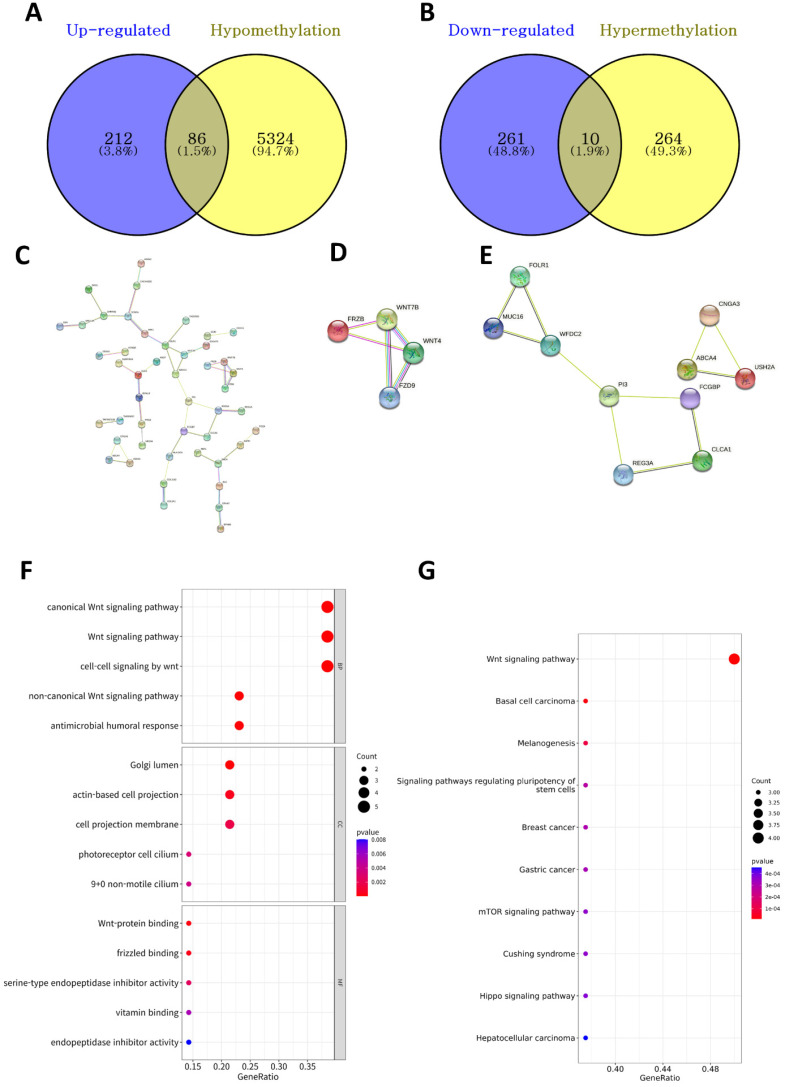
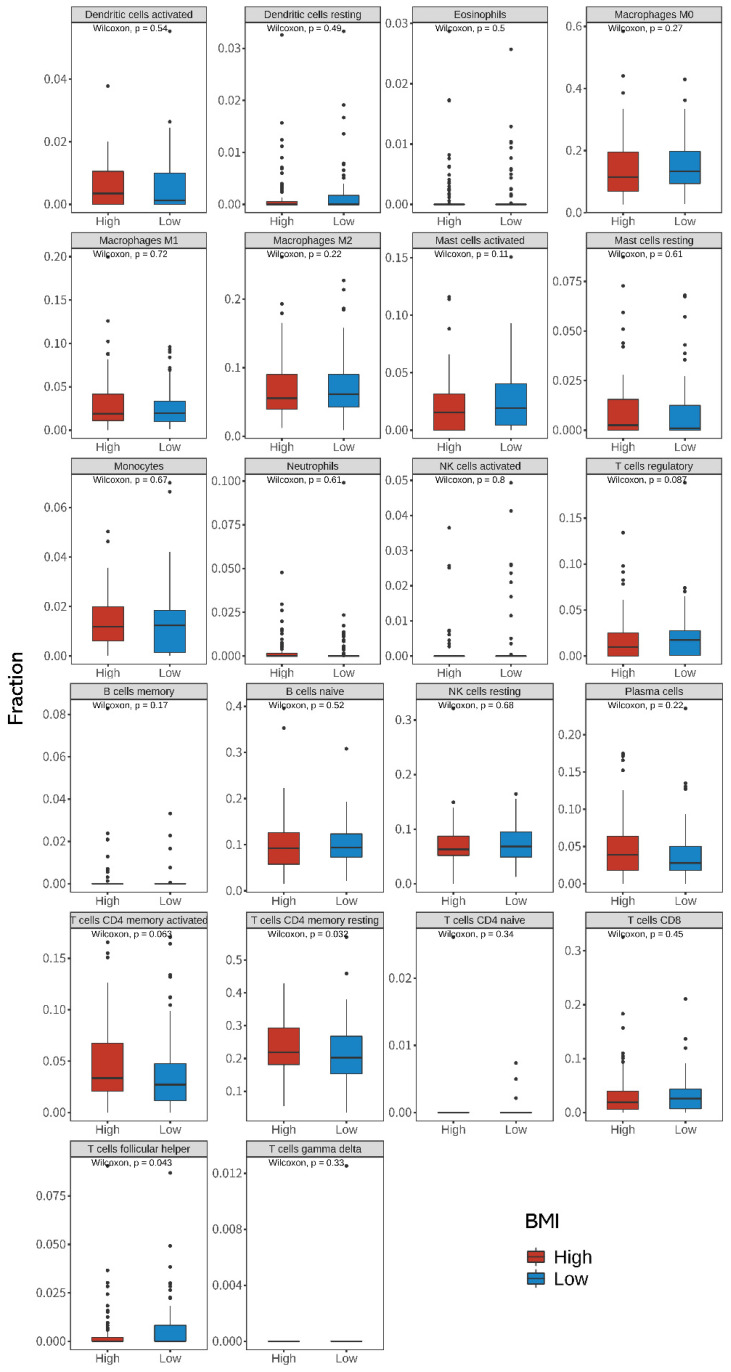
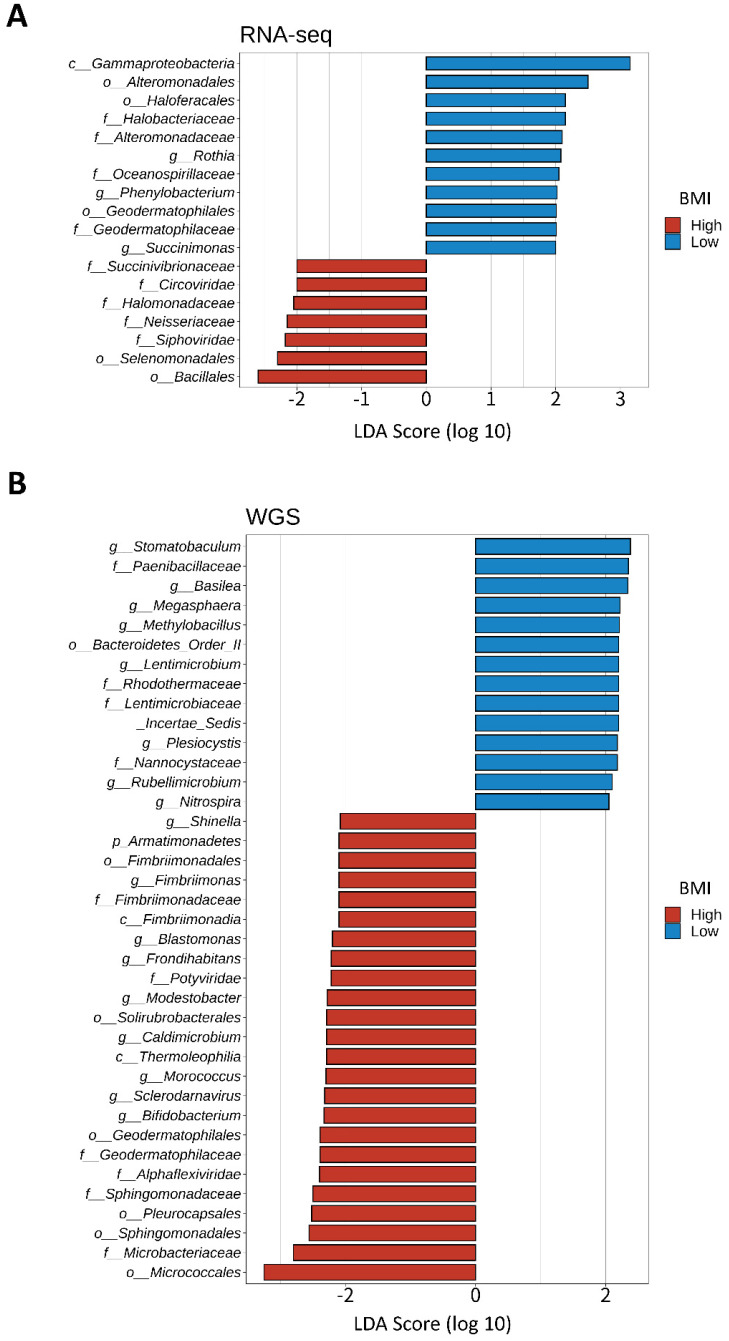
Colorectal cancer (CRC) is a common malignancy worldwide and the second leading cause of cancer-related deaths. Obesity is an important determinant of CRC incidence; however, obese patients have also shown better long-term survival than non-obese patients, suggesting that the development and progression of CRC are associated with different mechanisms. This study compares the expression of genes, tumor-infiltrating immune cells, and intestinal microbiota between high- and low-body mass index (BMI) patients at the time of CRC diagnosis. The results revealed that high-BMI patients with CRC have better prognosis, higher levels of resting CD4+ T cells, lower levels of T follicular helper cells, and different levels of intratumoral microbiota than low-BMI patients. Our study highlights that tumor-infiltrating immune cells and intratumoral microbe diversity are major features of the obesity paradox in CRC.

Keywords: Obesity paradox; TCGA; colorectal cancer; intratumoral microbiota; tumor-infiltrating immune cells.


Conflict of interest statement

Competing Interests: The authors have declared that no competing interest exists.

Figures

Figure 1
Figure 1
Kaplan-Meier curves for overall survival analysis. Survival curves of high- and low- body mass index (BMI) patients with colorectal cancer (CRC, n = 178). Data were downloaded from the UCSC Xena Browser (http://xena.ucsc.edu).
Figure 2
Figure 2
Differentially expressed genes (DEGs) and protein-protein interaction (PPI) network. (A) Volcano plot of the 569 DEGs (298 upregulated and 271 downregulated in the high-BMI group) between high- and low-BMI patients with CRC. Genes corresponding to the Benjamini-Hochberg adjusted P < 0.05 and log2 fold change > 2 are denoted in red; genes corresponding only to the adjusted P < 0.05 are denoted in blue; genes corresponding only to the log2 fold change > 2 are denoted in green; and genes not corresponding to either the p-value or log2 fold change are denoted in black. (B) Heatmap of 569 DEGs between high- and low-BMI patients with CRC based on the normalized Z-score. (C) PPI network of 298 genes with upregulated expressions. (D) PPI network of 271 genes with downregulated expressions. The module with the (E) highest and (F) second-highest Molecular Complex Detection (MCODE) value for the genes with upregulated expressions. The module with the (G) highest and (H) second-highest MCODE value for the downregulated genes.
Figure 3
Figure 3
Functional analysis. Gene ontology (GO) assay for the 39 genes comprising the significant modules in the PPI network: (A) 18 upregulated genes and (B) 21 downregulated genes. GO analysis considered the biological process (BP), cellular component (CC), and molecular function (MF) terms. Dot plots show the results corresponding to P < 0.05. Size of the circle indicates the number of genes corresponding to each term. The closer to red, the lower the p-value. Kyoto encyclopedia of genes and genomes (KEGG) assay of the 39 genes comprising the significant modules in the PPI network: (C) 18 upregulated genes and (D) 21 downregulated genes. The size of the circle indicates the number of genes corresponding to each term. Dot plots show the results corresponding to P < 0.05. The closer to red, the lower the p-value.
Figure 4
Figure 4
Analysis of DNA methylation-driven DEGs. (A) The Venn diagram shows the overlapping upregulated and hypomethylated DEGs. (B) The overlapping downregulated and hypermethylated DEGs. (C) PPI network of upregulated-hypomethylated genes. The module with the (D) highest and (E) second-highest MCODE value for upregulated-hypomethylated genes. (F) GO assay of 14 upregulated-hypomethylated genes comprising the module with the highest MCODE value. GO analysis considered the biological process (BP), cellular component (CC), and molecular function (MF) terms. Dot plots showing results corresponding to P < 0.05. Size of the circle indicates the number of genes corresponding to each term. The closer to red, the lower the p-value. (G) KEGG assay of 14 upregulated-hypomethylated genes comprising the module with the highest MCODE value. The size of the circle indicates the number of genes corresponding to each term. Dot plots showing results corresponding to P < 0.05. The closer to red, the lower the p-value.
Figure 5
Figure 5
Differences in the 22 immune cell fractions between high- and low-BMI patients with CRC. Differences in the expression of tumor-infiltrating immune cells (TIICs) between the high- and low-BMI groups were evaluated using the Wilcoxon sign-rank test (two-sided). CRC, colorectal cancer; BMI, body mass index.
Figure 6
Figure 6
LEfSe of the Kraken-TCGA dataset. Linear discriminant analysis effect size (LEfSe) and distribution of the associated microbiota by subtype using RNA and whole genome sequencing (WGS).

Similar articles

Cited by

References

    1. Xi Y, Xu P. Global colorectal cancer burden in 2020 and projections to 2040. Translational Oncology. 2021;14:101174. - PMC - PubMed
    1. Liu P-H, Wu K, Ng K, Zauber AG, Nguyen LH, Song M. et al. Association of Obesity with Risk of Early-Onset Colorectal Cancer Among Women. JAMA Oncology. 2019;5:37. - PMC - PubMed
    1. Aleksandrova K, Pischon T, Buijsse B, May AM, Peeters PH, Bueno-de-Mesquita HB. et al. Adult weight change and risk of colorectal cancer in the European Prospective Investigation into Cancer and Nutrition. European Journal of Cancer. 2013;49:3526–36. - PubMed
    1. Shahjehan F, Merchea A, Cochuyt JJ, Li Z, Colibaseanu DT, Kasi PM. Body Mass Index and Long-Term Outcomes in Patients with Colorectal Cancer. Front Oncol. 2018;8:620. - PMC - PubMed
    1. Li Y, Li C, Wu G, Yang W, Wang X, Duan L. et al. The obesity paradox in patients with colorectal cancer: a systematic review and meta-analysis. Nutr Rev. 2022;80:1755–68. - PubMed