. 2023 Mar 1;64(3):2.
doi: 10.1167/iovs.64.3.2.

Clinicopathologic Findings in Three Siblings With Geographic Atrophy

Affiliations

Clinicopathologic Findings in Three Siblings With Geographic Atrophy

Malia M Edwards et al. Invest Ophthalmol Vis Sci. .

Abstract

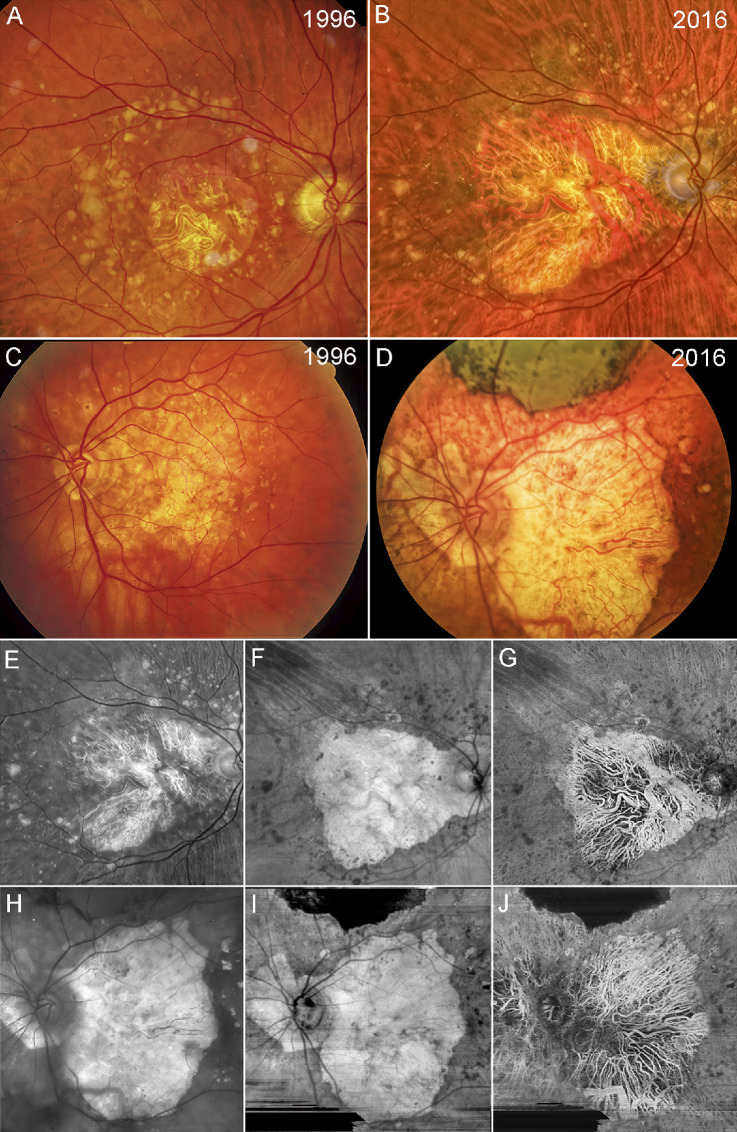
Purpose: Age-related macular degeneration (AMD) is a leading cause of blindness among the elderly worldwide. Clinical imaging and histopathologic studies are crucial to understanding disease pathology. This study combined clinical observations of three brothers with geographic atrophy (GA), followed for 20 years, with histopathologic analysis.

Methods: For two of the three brothers, clinical images were taken in 2016, 2 years prior to death. Immunohistochemistry, on both flat-mounts and cross sections, histology, and transmission electron microscopy were used to compare the choroid and retina in GA eyes to those of age-matched controls.

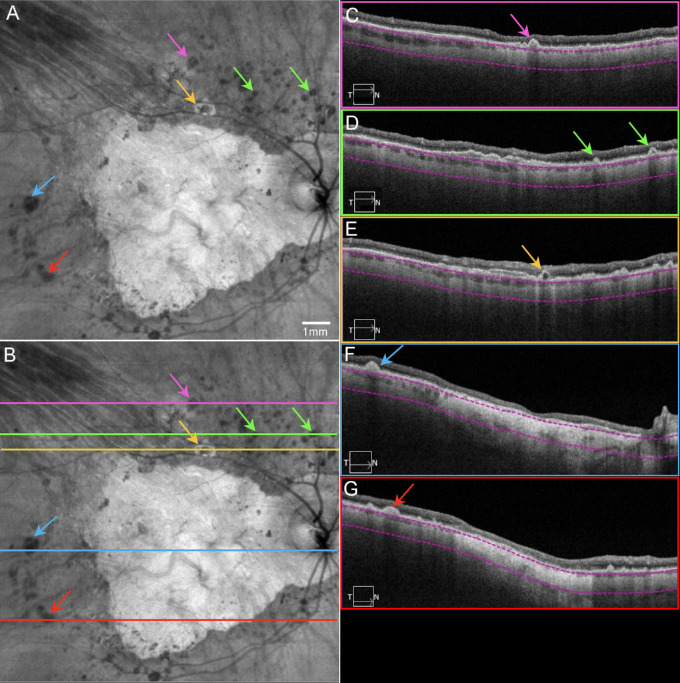
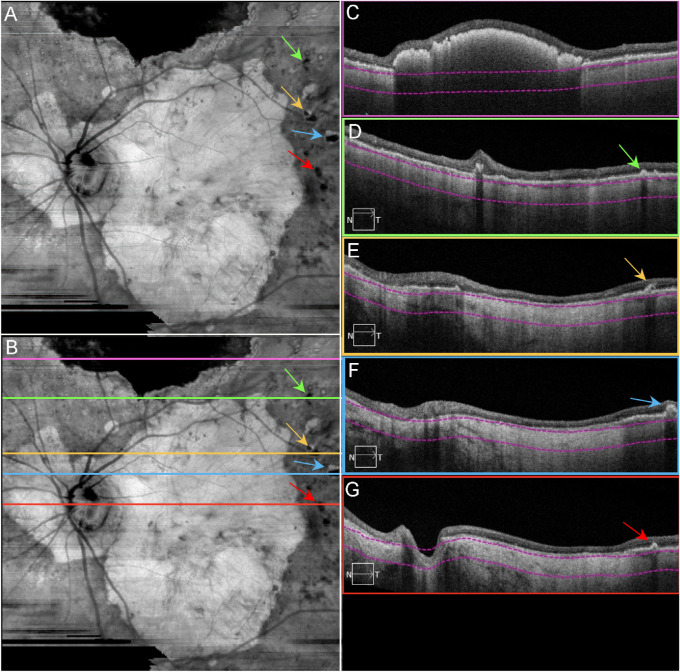
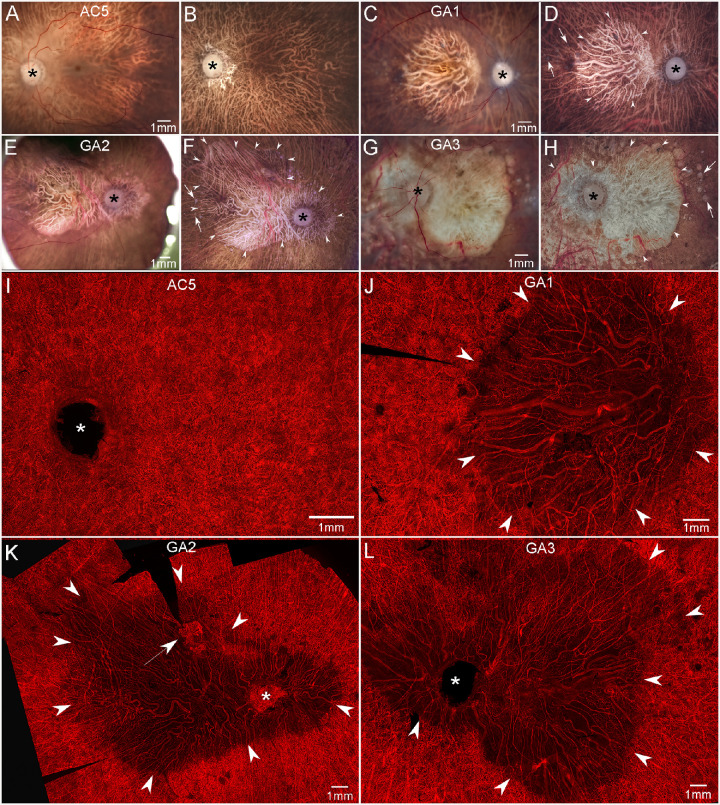
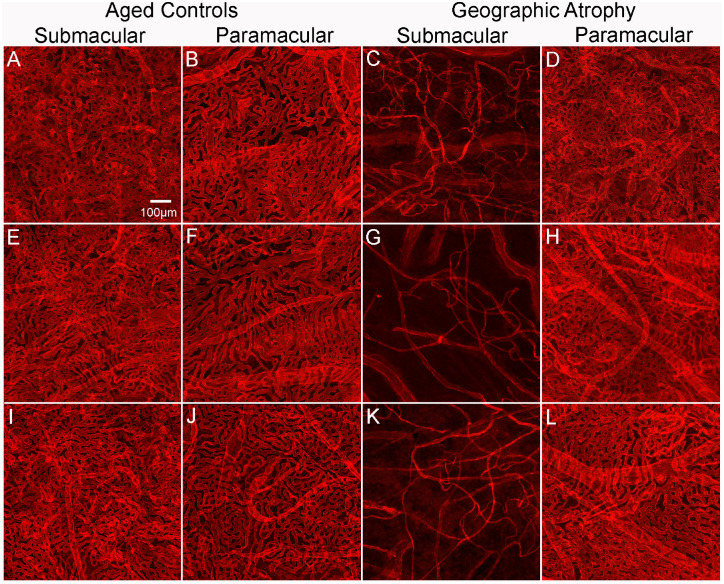
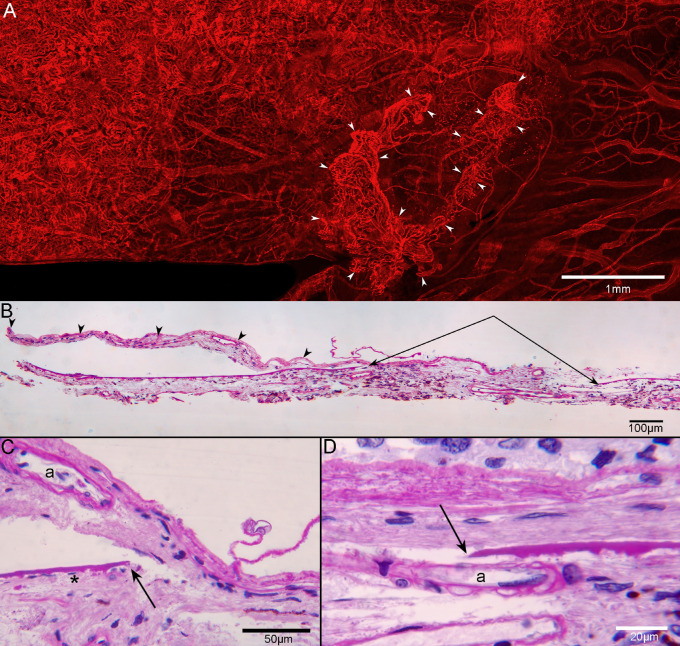
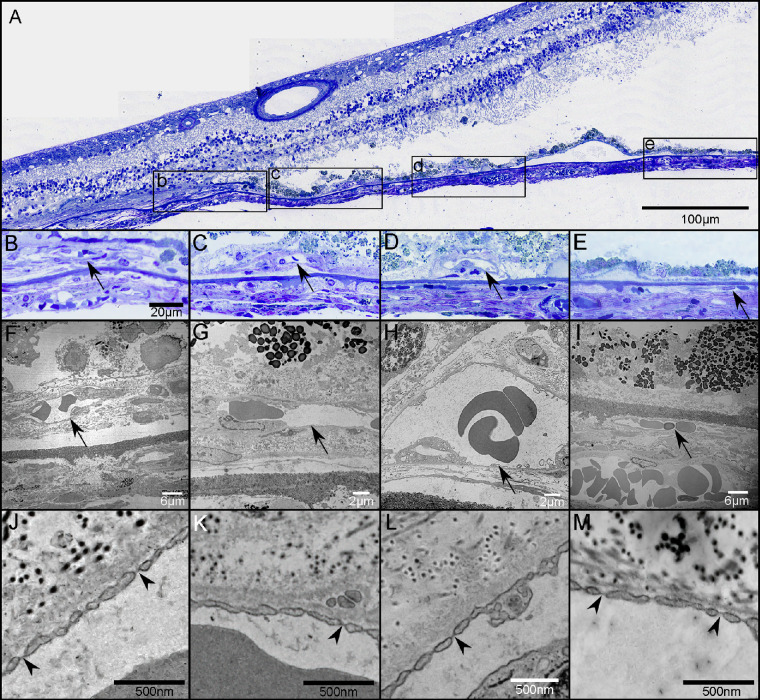
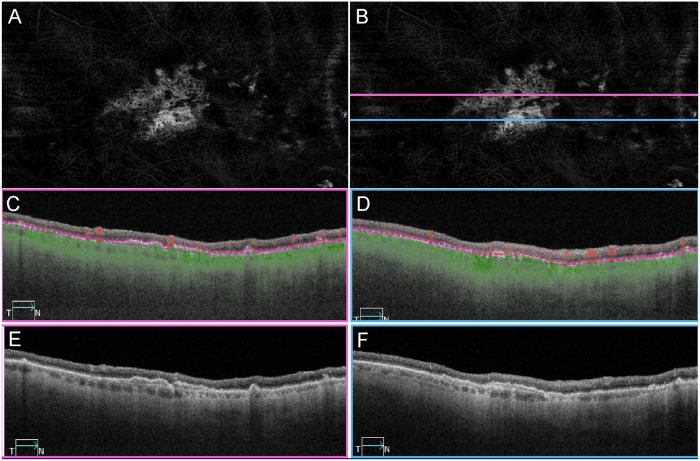
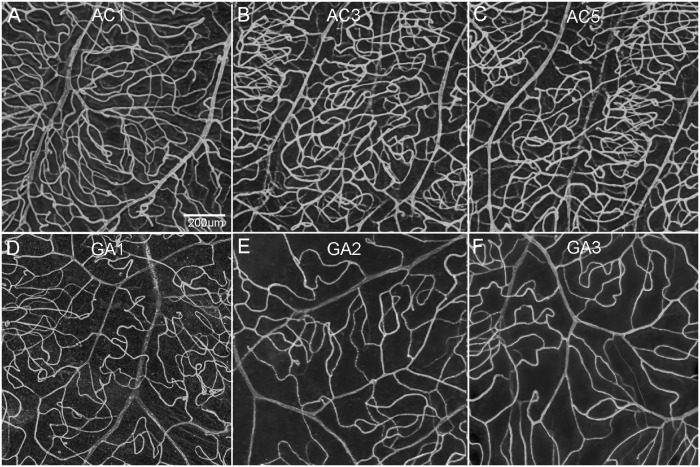
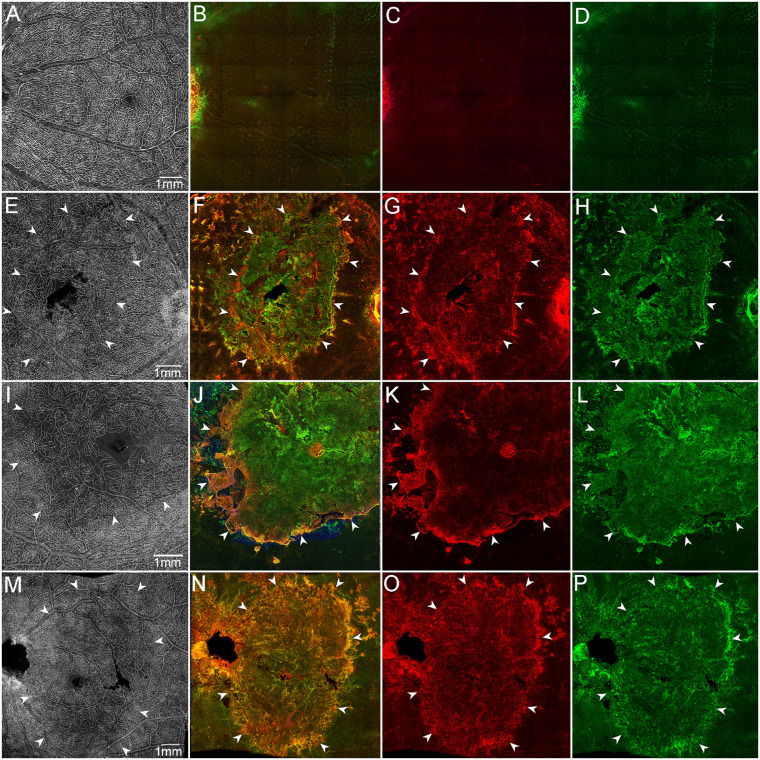
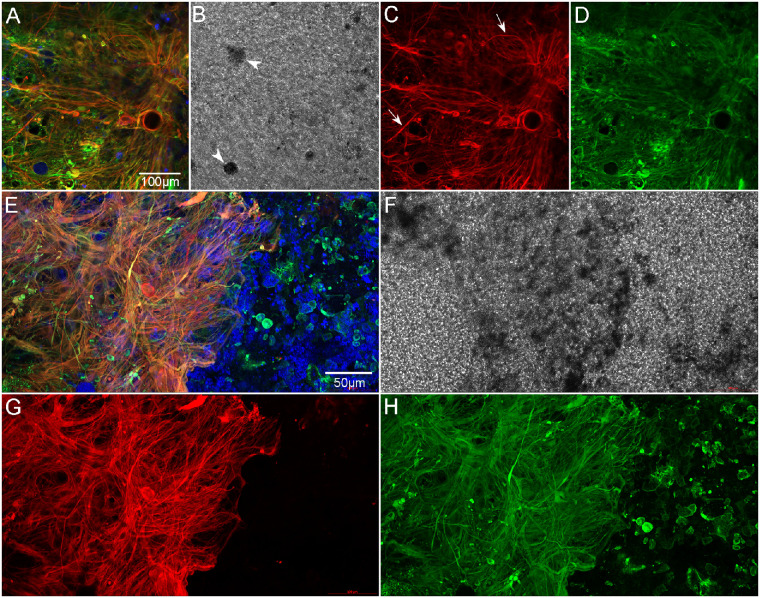
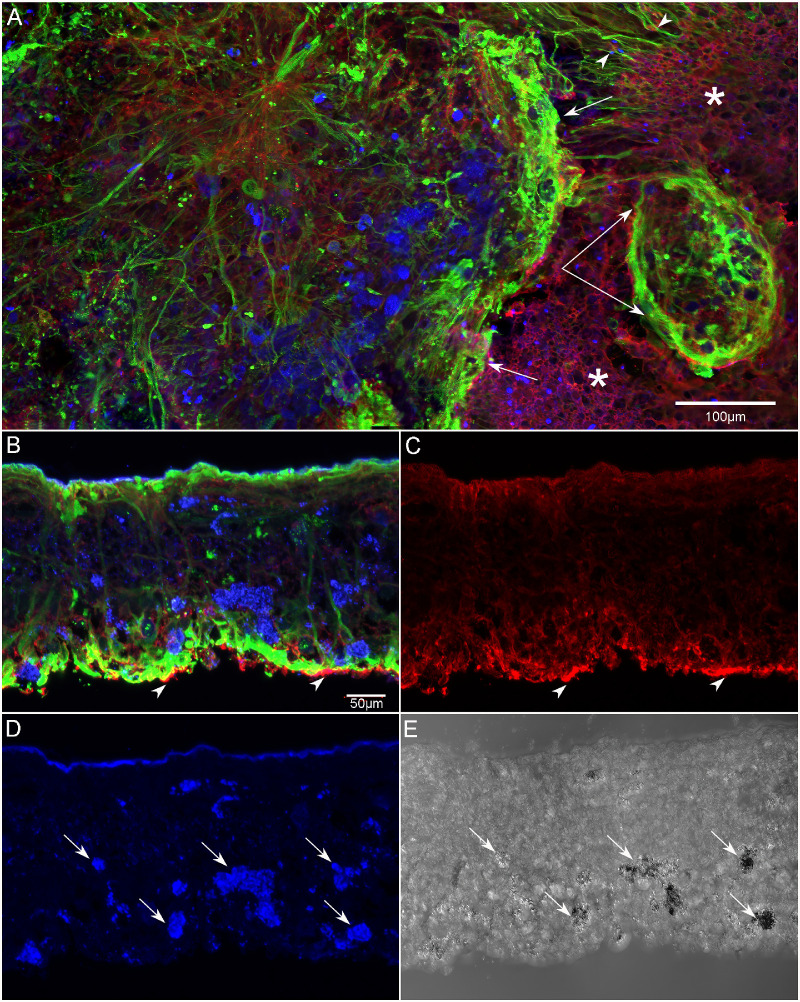
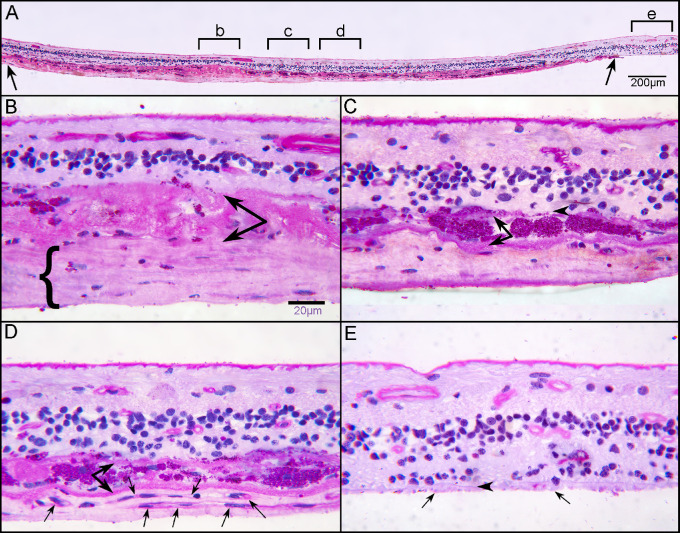
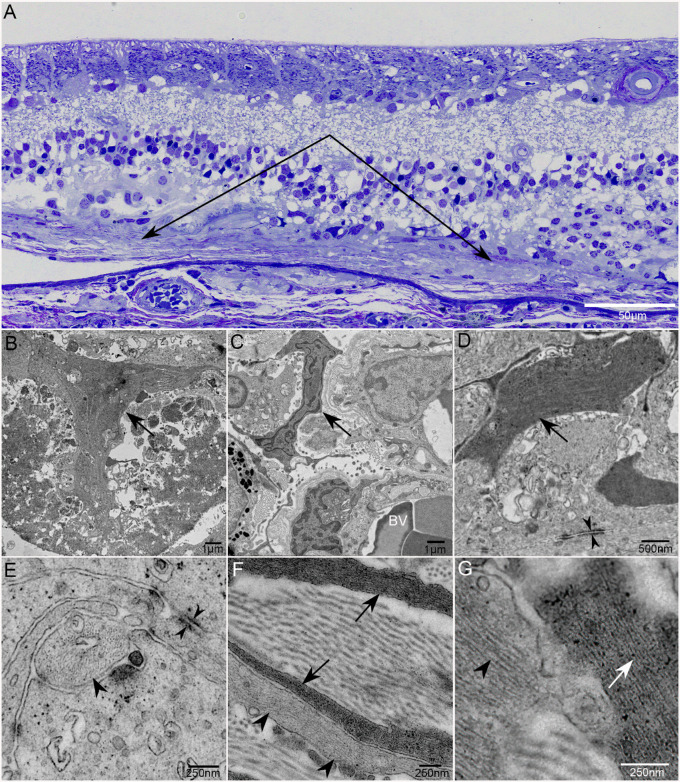
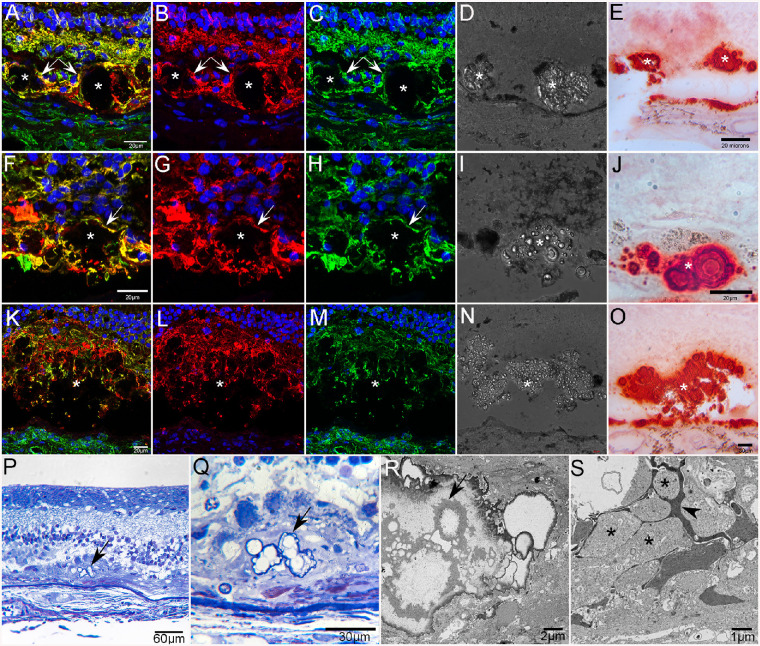
Results: Ulex europaeus agglutinin (UEA) lectin staining of the choroid demonstrated a significant reduction in the percent vascular area and vessel diameter. In one donor, histopathologic analysis demonstrated two separate areas with choroidal neovascularization (CNV). Reevaluation of swept-source optical coherence tomography angiography (SS-OCTA) images revealed CNV in two of the brothers. UEA lectin also revealed a significant reduction in retinal vasculature in the atrophic area. A subretinal glial membrane, composed of processes positive for glial fibrillary acidic protein and/or vimentin, occupied areas identical to those of retinal pigment epithelium (RPE) and choroidal atrophy in all three AMD donors. SS-OCTA also demonstrated presumed calcific drusen in the two donors imaged in 2016. Immunohistochemical analysis and alizarin red S staining verified calcium within drusen, which was ensheathed by glial processes.

Conclusions: This study demonstrates the importance of clinicohistopathologic correlation studies. It emphasizes the need to better understand how the symbiotic relationship between choriocapillaris and RPE, glial response, and calcified drusen impact GA progression.


Conflict of interest statement

Disclosure: M.M. Edwards, None; D.S. McLeod, None; M. Shen, None; R. Grebe, None; J.S. Sunness, Avoro (C), Bluebird Bio (C), Starlit (C), Acuta (C), Apellis (F); I.A. Bhutto, None; E. McDonnell, None; A.M. Pado, None; G. Gregori, Carl Zeiss Meditec (F); P.J. Rosenfeld, Alexion Pharmaceuticals (F), Carl Zeiss Meditec (F), Gyroscope Therapeutics (F), Stealth BioTherapeutics (F), Valitor (F), Verana Health (F), Annexon (C), Apellis (C, F), Boehringer-Ingelheim (C), Carl Zeiss Meditec (C), Chengdu Kanghong Biotech (C), Ocunexus Therapeutics (C), Ocudyne (C, F), Regeneron Pharmaceuticals (C), Unity Biotechnology; G.A. Lutty, None

Figures

Figure 1.
Figure 1.
Fundus photographs and swept source OCT angiography images. Color fundus imaging of patient GA2 (A, B) and patient GA3 (C, D) in 1996 and 2016. (A) Patient GA2 has a circular region of central foveal-involving GA with surrounding drusen along the vascular arcades. (B) The region of GA in patient GA2 has enlarged over 10 years with surrounding drusen beyond the vascular arcades. (C) Patient GA3 has an irregular region of GA involving the central macula with surrounding drusen and hyperpigmentation. (D) Over 10 years, the region of GA has enlarged with extension to the peripapillary area along with surrounding drusen and hyperpigmentation. Note that along the superior region of the macula, scarring has resulted from the area with the previous macular hemorrhage. Red-free fundus image and SS-OCTA en face imaging of patient GA2 (EG) and patient GA3 (HJ) in 2016. (E) Red-free imaging of the same eye as in B. (F) En face sub-RPE structural image showing GA corresponding to the hypertransmission defect (hyperTD) along with surrounding calcified drusen, which correspond to the dark regions or hypotransmission defects (hypoTDs). (G) En face sub-RPE SS-OCTA image showing the large choroidal vessels within the GA lesion that correspond with those shown in the color and red-free fundus photo. (H) Red-free fundus image of the same eye as in D. (I) En face sub-RPE structural image showing a hyperTD that corresponds to GA surrounded by hypoTDs that correspond to calcified drusen. The scarring corresponds to the dark hypoTD since it blocks the light from penetrating into the choroid. (J) En face sub-RPE angiographic image showing the large choroidal vessels within the region of GA that correspond to the choroidal vessels seen in the color and red-free fundus images.
Figure 2.
Figure 2.
Final OCT scans acquired from patient GA2. SS-OCT en face and B-scan images from patient GA2 in 2016, the same eye as in Figures 1A and 1B. (A) En face sub-RPE structural image showing GA as a hyperTD with surrounding calcified druse as hypoTDs (arrows). Note the yellow arrow pointing to a lesion described as a donut. (B) Same image as A with lines indicating the B-scan locations. (C) B-scan image corresponding to the pink line in B, showing a calcified drusen (pink arrow). (D) B-scan image corresponding to the green line in B, showing a calcified drusen (green arrows) and a double-layer sign (see Fig. 9). (E) B-scan image corresponding to the yellow line in B, showing a donut lesion (yellow arrow) as a hyperTD surrounding the hypoTD. Note this lesion has a hyporeflective core. (F) B-scan image corresponding to the blue line in B, showing a calcified druse (blue arrow) and GA as a hyperTD involving the fovea. (G) B-scan image corresponding to the red line in B, showing a calcified druse (red arrow) and other smaller drusen, as well as GA as a hyperTD in the middle. Note in CG, the choroid is significantly thin. The property of calcified drusen was confirmed by histopathology in Figure 15.
Figure 3.
Figure 3.
Final OCT scans acquired from patient GA3. SS-OCT en face and B-scan images from patient GA3 in 2016, the same eye in Figures 1C and D. (A) En face sub-RPE structural image showing GA lesion as a hyperTD with surrounding calcified drusen as hypoTDs (arrows). (B) Same image as A with lines indicating the B-scan locations. (C) B-scan image corresponding to the pink line in B, showing the hyperreflective scarring within the retina that blocks the light from penetrating into the choroid. (D) B-scan image corresponding to the green line in B, showing a calcified druse (green arrow). (E) B-scan image corresponding to the yellow line in B, showing a calcified druse with a hyporeflective core (yellow arrow) and GA as a hyperTD. (F) B-scan image corresponding to the blue line in B, showing a calcified druse (blue arrow) and GA as a hyperTD. (G) B-scan image corresponding to the red line in B, showing a calcified druse (red arrow) and GA as a hyperTD. Note in CG, the choroid is significantly thin. The property of calcified drusen was confirmed by histopathology in Figure 15.
Figure 4.
Figure 4.
Gross photographs and choroidal flat-mounts. Gross photos of posterior eyecups from an aged control and GA donors with retinas intact (A, C, E, G) and after retinal dissection (B, D, F, H). The control eye (A, B) is free of maculopathy, and no posterior pole drusen or RPE changes are observed. In GA eyes (CH), large areas of RPE atrophy (arrowheads in D, F, H) are present in the macula of GA1 (C, D) and extending beyond macula to the major retinal arcades and peripapillary regions of GA2 (E, F) and GA3 (G, H). Drusen are seen beyond the border of atrophy in all GA eyes (arrows in D, F, H). UEA-stained choroidal flat-mount from a 100-year-old control eye (I) demonstrates a dense, uniform, and freely interanatomosing pattern of CC in the posterior pole. In GA eyes (JL), severe CC dropout is evident in regions of RPE atrophy (arrowheads). In these areas, few capillaries remained viable and blood vessels were composed primarily of intermediate and large choroidal vessels. In GA2, CNV is present superiorly to macula near the border of CC dropout (arrow in K). Scale bars represent 1 mm in all panels. The asterisk shows the optic nerve head.
Figure 5.
Figure 5.
Percent VA in choroids in aged control and subjects with GA. Representative higher-magnification images of UEA-stained choroidal flat-mounts showing the submacular and paramacular choroidal vasculature in three aged control eyes and three GA donor eyes. Reduced vascular area is observed in the submacular region (C, G, K) of GA choroids compared to that in controls (A, E, I). In the paramacular region, the vascular area was similar in control (B, F, J) and GA (D, H, L) choroids. Remaining viable CC luminal diameters in GA submacula is also significantly constricted compared to aged controls. Scale bar in A indicates 100 µm for all panels.
Figure 6.
Figure 6.
CNV in flat-mounted and sectioned choroid. UEA flat-mount of the superior choroid from GA2 near the border of RPE atrophy and degenerating CC (A), showing CNV (arrowheads), which is 1.32 mm2 in area. The lesion is composed of some large vessels branching and extending outwardly, anastomotic and looping vessels in the periphery, and branching capillaries at its border, terminating in blind ends. In PAS/hematoxylin-stained JB-4 sections of this choroid, the CNV (arrowheads in B) extends from a large defect in BM (paired arrows in B). The CNV is fed via choroidal arterioles (“a” in C, D), which are seen traversing the discontinuous BM (arrows in C, D). Scale bars: 1 mm (A), 100 µm (B), 50 µm (D), and 20 µm (D).
Figure 7.
Figure 7.
Choroidal neovascularization in transmission electron micrographs. Thick section of an epoxy embedded region of superior retina/choroid from the atrophic border of G2 (A). Higher magnification of boxed regions in A showing CNV (arrows in BD) at the border of atrophy (B) and beyond the atrophic border (C, D). There is no CNV in region E. Low-magnification TEM images from the regions shown in BE showing CNV internal to BM (arrows in FH) and a choroidal capillary more peripherally (arrow in I). Many of the endothelial cells in the CNV had fenestrations (arrowheads in JL), some of which appeared typical for those found in surviving CC outside the area of RPE atrophy (arrowheads in M). Scale bars: 100 µm (A), 20 µm (BE), 6 µm (F, I), 2 µm (G, H), 500 µm (JM).
Figure 8.
Figure 8.
OCTA imaging of CNV in patient GA2. SS-OCTA en face and B-scan imaging of the same eye in Figures 2A–C and Figure 3 from patient GA2 in 2016. (A) En face angiography image using the RPE to BM slab to illustrate type 1 CNV. (B) Same image as A with lines indicating the B-scan locations. (C, D) Angiographic B-scan images with segmentation lines (purple) corresponding to the RPE and BM. The corresponding locations of the B-scan images were indicated as pink and blue lines in B. (E, F) Structural B-scan images at the same location as in C and D, showing a separation between the RPE and BM, known as a double-layer sign.
Figure 9.
Figure 9.
Retinal vascular changes. UEA staining of retinal flat-mounts from three age-matched controls (AC) and three GA donor eyes (DF) demonstrates reduced vascular area in the macular retina of patients with GA. Scale bar: 200 µm.
Figure 10.
Figure 10.
Retinal glia and vascular changes in areas of RPE atrophy. Aged control (AD), GA1 (EH), GA2 (IL), and GA3 (MP). Retinas were stained with UEA lectin (white), GFAP (red), and vimentin (green). Aged control retinal flat-mount imaged en face with the ILM uppermost exhibits a uniform vasculature in the posterior pole (A). Control retina imaged en face with the ELM uppermost was nondescript (BD). GA retinas imaged with the ILM uppermost (E, I, M) exhibit a clear reduction in retinal vascular density in the atrophic area (arrowheads) located in the posterior pole. GA retinas imaged with the ELM uppermost present a large subretinal GFAP/vimentin double-positive membrane-like structure (EP). Arrowheads indicate the atrophic areas. (AD) Control, (EH) GA1, (IL) GA2, and (MP) GA3. Scale bars: 1 mm.
Figure 11.
Figure 11.
Retina imaged with ELM uppermost, high magnification. Retina of GA2 shown here is representative of all three GA eyes. The retina is stained with GFAP (red), vimentin (green), and UEA lectin (blue). The center of the subretinal glial membrane is composed of glial cells positive for GFAP (red) and vimentin (green) (AD). A few cell processes that only express GFAP are also observed (arrows). DIC imaging demonstrates pigmented cells (arrowheads in B). At the membrane's border (EH), glial processes are very disorganized and intertwined, with some extending toward vimentin-positive cells outside the atrophic area. A band of UEA lectin-positive (or autofluorescent) pigmented cells is observed within the glial membrane at the border (E, F). Scale bars: 100 µm (AD) and 50 µm (EH).
Figure 12.
Figure 12.
Subretinal glial membrane at the border of geographic atrophy (patient GA2). The area of atrophy extended into the superior retina in GA2. Retinas were stained with CD44 (red), vimentin (green), and PNA (blue). A glial membrane creates a dense band at the border of RPE atrophy (arrows) and is positive for vimentin and CD44 (A). Blue cells within the membrane appear, based on their pigmentation, to be migrating RPE cells that are either binding PNA or autofluorescing at the 488 wavelength. Outside the glial membrane, the area marked by asterisks, the CD44-positive ELM has a normal staining pattern, and PNA-positive outer segments were observed (blue dots). At the top right, the Müller cell processes extend linearly within the nonatrophic area toward the glial membrane, disrupting the appearance of the ELM (arrowheads). Below this, a smaller, oval-shaped structure created by glial cell processes is also visible (paired arrow). These structures were observed in all three GA donors just outside the atrophic area. After imaging in the flat-mount, a portion of the superior retina was cryopreserved for cross-sectional analysis (BE). In cross section, the disorganization of Müller cell processes is clearly visible, as is the subretinal glial structure, which is positive for both CD44 and vimentin (arrowheads in B, C). CD44 staining was observed throughout Müller cell processes in the atrophic areas of all three GA donor eyes. In addition, PNA-positive (or autofluorescent at 488 wavelength) cells (arrows in D) are observed throughout the retina (D). DIC imaging demonstrated these cells were pigmented, suggesting they are migrating RPE (E). Scale bars: 100 µm (A) and 50 µm (BE).
Figure 13.
Figure 13.
Histologic analysis of retina at posterior pole. Transverse sections of flat-mounted retina embedded in JB-4 were stained with PAS and hematoxylin (H). At low magnification, a clear subretinal structure (between arrows) can be observed in the atrophic area where the outer nuclear layer is absent (A). Higher magnification of area “b” demonstrates a thick fibrous structure (bracket) below a thick basal laminar deposit (paired arrow) (B). This fibrous membrane represents the subretinal glial membrane observed in the flat perspective (Figures 10–12). Subducted RPEs in area “c” of panel A are observed between two membranes (C). In area “d” of panel A, neovascularization is observed with capillaries (arrows) below subducted RPE (paired arrows). Scale bars: 200 µm (A) and 20 µm (B, C).
Figure 14.
Figure 14.
Transmission electron micrographs of subretinal glia. Thick section of an epoxy-embedded region of superior retina/choroid from the atrophic border of G2 demonstrates a thick subretinal membrane (A; paired arrows). At higher magnification, multiple Müller cell processes are visible. Müller cell processes also aligned to create a pattern reminiscent of endfeet (arrow) observed at the ILM (B). Müller cell processes extend into the choroid (C). Intracellular junctions are observed between Müller cell processes in the subretinal space (opposing arrowheads; D, E). Astrocyte processes, with lighter intermediate filaments (arrowheads), are also present in the subretinal structures, as are collagen bundles (F, G). Arrows indicate Müller cell processes in all images. Arrowheads indicate processes with lighter filament typical of astrocytes. BV indicates blood vessels in B. Scale bars: 50 µm (A), 1 µm (B, C), 500 µm (D), and 250 µm (EG).
Figure 15.
Figure 15.
Calcified drusen in GA donor eyes. Cross sections from the posterior pole of GA2 stained with GFAP (red), vimentin (green), and DAPI (blue) reveal subretinal deposits (asterisks in AO) ensheathed by glial processes (arrows in AC and FH) positive for GFAP and vimentin (AC, FH, KM). DIC of these same sections shows refractive spherules within these deposits (D, I, N). Adjacent sections stained with alizarin red S demonstrate that deposits contain calcium spherules (E, J, O). Calcium is also seen in BM. Toluidene blue–stained semithin sections from GA donor 2 taken near the border of RPE atrophy showing spherical calcium particles within a subretinal deposit (arrows) at low (P) and higher (Q) magnification. Ultrathin section (R) of calcium spherules (arrow) in the subretinal deposit shown in P and Q. The deposit (S) is surrounded by Müller cell (arrowhead) and astrocyte processes (asterisks).

References

    1. Fleckenstein M, Keenan TDL, Guymer RH, et al. Age-related macular degeneration. Nat Rev Dis Primers. 2021; 7: 31. - PubMed
    1. Jaffe GJ, Westby K, Csaky KG, et al. C5 inhibitor avacincaptad pegol for geographic atrophy due to age-related macular degeneration: a randomized pivotal phase 2/3 trial. Ophthalmology. 2021; 128: 576–586. - PubMed
    1. Liao DS, Grossi FV, El Mehdi D, et al. Complement C3 inhibitor pegcetacoplan for geographic atrophy secondary to age-related macular degeneration: a randomized phase 2 trial. Ophthalmology. 2020; 127: 186–195. - PubMed
    1. McLeod DS, Grebe R, Bhutto I, Merges C, Baba T, Lutty GA. Relationship between RPE and choriocapillaris in age-related macular degeneration. Invest Ophthalmol Vis Sci. 2009; 50: 4982–4991. - PMC - PubMed
    1. Seddon JM, McLeod DS, Bhutto IA, et al. Histopathological insights into choroidal vascular loss in clinically documented cases of age-related macular degeneration. JAMA Ophthalmol. 2016; 134: 1272–1280. - PMC - PubMed

Publication types