

The Health Care Utilization and Medical Costs in Long-Term Follow-Up of Children Diagnosed With Leukemia, Solid Tumor, or Brain Tumor: Population-Based Study Using the National Health Insurance Claims Data
- PMID: 36862495
- PMCID: PMC10020904
- DOI: 10.2196/42350
The Health Care Utilization and Medical Costs in Long-Term Follow-Up of Children Diagnosed With Leukemia, Solid Tumor, or Brain Tumor: Population-Based Study Using the National Health Insurance Claims Data
Abstract
Background: Childhood cancer survivors are at a high risk of medical consequences of their disease and treatment. There is growing information about the long-term health issues of childhood cancer survivors; however, there are very few studies describing the health care utilization and costs for this unique population. Understanding their utilization of health care services and costs will provide the basis for developing strategies to better serve these individuals and potentially reduce the cost.
Objective: This study aims to determine the utilization of health services and costs for long-term survivors of childhood cancer in Taiwan.
Methods: This is a nationwide, population-based, retrospective case-control study. We analyzed the claims data of the National Health Insurance that covers 99% of the Taiwanese population of 25.68 million. A total of 33,105 children had survived for at least 5 years after the first appearance of a diagnostic code of cancer or a benign brain tumor before the age of 18 years from 2000 to 2010 with follow-up to 2015. An age- and gender-matched control group of 64,754 individuals with no cancer was randomly selected for comparison. Utilization was compared between the cancer and no cancer groups by χ2 test. The annual medical expense was compared by the Mann-Whitney U test and Kruskal-Wallis rank-sum test.
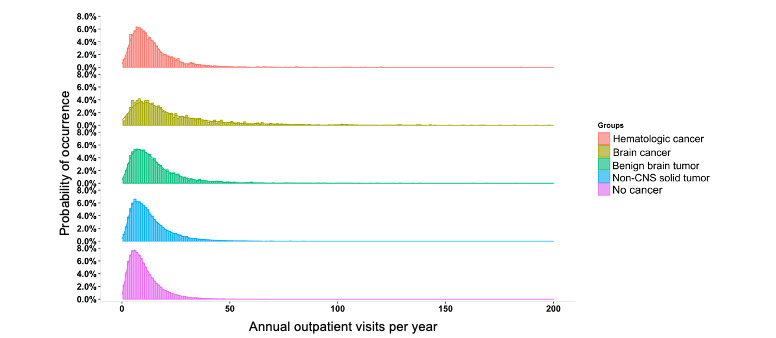
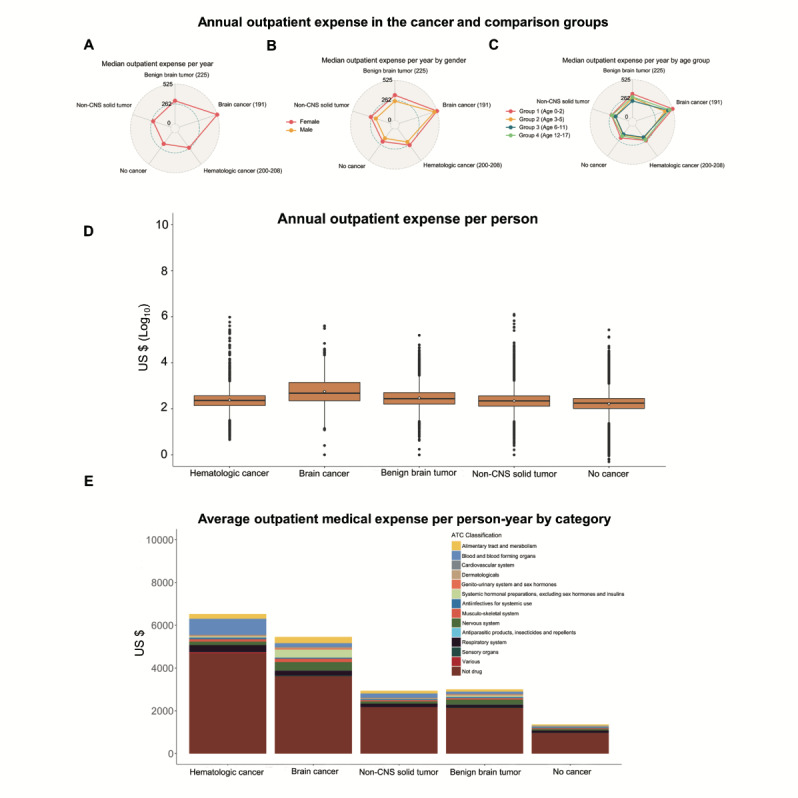
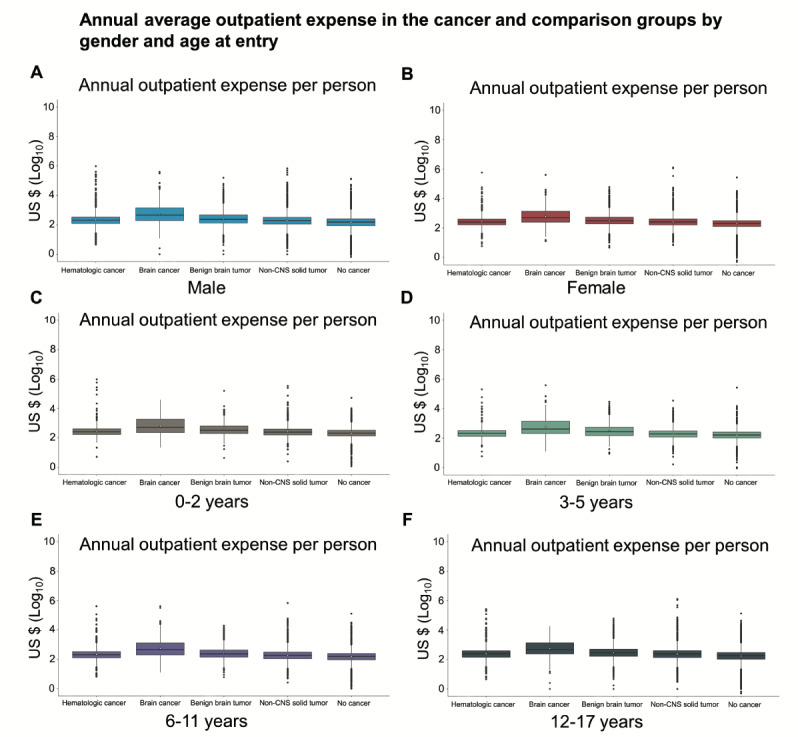
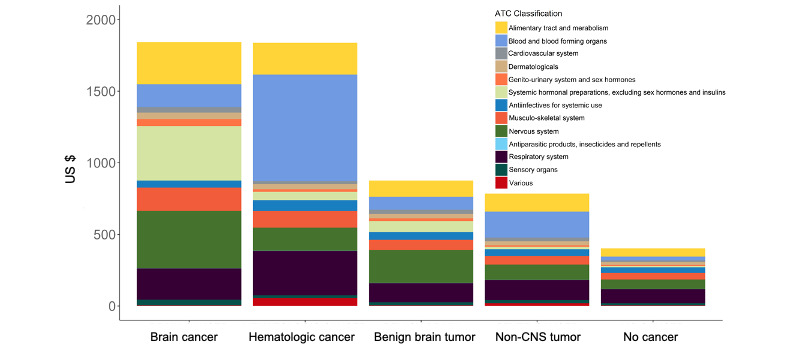
Results: At a median follow-up of 7 years, childhood cancer survivors utilized a significantly higher proportion of medical center, regional hospital, inpatient, and emergency services in contrast to no cancer individuals: 57.92% (19,174/33,105) versus 44.51% (28,825/64,754), 90.66% (30,014/33,105) versus 85.70% (55,493/64,754), 27.19% (9000/33,105) versus 20.31% (13,152/64,754), and 65.26% (21,604/33,105) versus 59.36% (38,441/64,754), respectively (all P<.001). The annual total expense (median, interquartile range) of childhood cancer survivors was significantly higher than that of the comparison group (US $285.56, US $161.78-US $535.80 per year vs US $203.90, US $118.98-US $347.55 per year; P<.001). Survivors with female gender, diagnosis before the age of 3 years, and diagnosis of brain cancer or a benign brain tumor had significantly higher annual outpatient expenses (all P<.001). Moreover, the analysis of outpatient medication costs showed that hormonal and neurological medications comprised the 2 largest costs in brain cancer and benign brain tumor survivors.
Conclusions: Survivors of childhood cancer and a benign brain tumor had higher utilization of advanced health resources and higher costs of care. The design of the initial treatment plan minimizing long-term consequences, early intervention strategies, and survivorship programs have the potential to mitigate costs of late effects due to childhood cancer and its treatment.
Keywords: brain tumor; cancer survivor; children; cost of care; health care; health resource; leukemia; long-term follow-up; population-based study; solid tumor.
©James S Miser, Ben-Chang Shia, Yi-Wei Kao, Yen-Lin Liu, Shih-Yen Chen, Wan-Ling Ho. Originally published in JMIR Public Health and Surveillance (https://publichealth.jmir.org), 02.03.2023.
Conflict of interest statement
Conflicts of Interest: None declared.
Figures
Similar articles
-
Burden of illness in patients with possible Lennox-Gastaut syndrome: A retrospective claims-based study.Epilepsy Behav. 2018 Nov;88:66-73. doi: 10.1016/j.yebeh.2018.08.032. Epub 2018 Sep 18. Epilepsy Behav. 2018. PMID: 30241056
-
Healthcare Service Utilization for Practicing Physicians: A Population-Based Study.PLoS One. 2016 Jan 11;11(1):e0130690. doi: 10.1371/journal.pone.0130690. eCollection 2016. PLoS One. 2016. PMID: 26752592 Free PMC article.
-
Long-term Health Care Utilization and Associated Costs After Dialysis-Treated Acute Kidney Injury in Children.Am J Kidney Dis. 2023 Jan;81(1):79-89.e1. doi: 10.1053/j.ajkd.2022.07.005. Epub 2022 Aug 17. Am J Kidney Dis. 2023. PMID: 35985371
-
Repaglinide : a pharmacoeconomic review of its use in type 2 diabetes mellitus.Pharmacoeconomics. 2004;22(6):389-411. doi: 10.2165/00019053-200422060-00005. Pharmacoeconomics. 2004. PMID: 15099124 Review.
-
The St. Jude Children's Research Hospital After Completion of Therapy Clinic.J Cancer Surviv. 2024 Feb;18(1):23-28. doi: 10.1007/s11764-023-01519-6. Epub 2024 Jan 31. J Cancer Surviv. 2024. PMID: 38294599 Free PMC article. Review.
Cited by
-
Financial burden faced by breastfeeding mothers caring for children diagnosed with cancer in Ghana; an exploratory qualitative study.BMC Womens Health. 2024 Mar 14;24(1):177. doi: 10.1186/s12905-024-02931-5. BMC Womens Health. 2024. PMID: 38486146 Free PMC article.
References
-
- Ward E, DeSantis C, Robbins A, Kohler B, Jemal A. Childhood and adolescent cancer statistics, 2014. CA Cancer J Clin. 2014 Jan 31;64(2):83–103. doi: 10.3322/caac.21219. https://onlinelibrary.wiley.com/doi/10.3322/caac.21219 - DOI - DOI - PubMed
-
- Landier W, Skinner R, Wallace WH, Hjorth L, Mulder RL, Wong FL, Yasui Y, Bhakta N, Constine LS, Bhatia S, Kremer LC, Hudson MM. Surveillance for Late Effects in Childhood Cancer Survivors. J Clin Oncol. 2018 Jul 20;36(21):2216–2222. doi: 10.1200/JCO.2017.77.0180. https://europepmc.org/abstract/MED/29874139 - DOI - PMC - PubMed
-
- Phillips S, Padgett L, Leisenring W, Stratton K, Bishop K, Krull K, Alfano Catherine M, Gibson Todd M, de Moor Janet S, Hartigan Danielle Blanch, Armstrong Gregory T, Robison Leslie L, Rowland Julia H, Oeffinger Kevin C, Mariotto Angela B. Survivors of childhood cancer in the United States: prevalence and burden of morbidity. Cancer Epidemiol Biomarkers Prev. 2015 Apr;24(4):653–63. doi: 10.1158/1055-9965.EPI-14-1418. https://europepmc.org/abstract/MED/25834148 24/4/653 - DOI - PMC - PubMed
-
- Trama A, Botta L, Foschi R, Ferrari A, Stiller C, Desandes E, Maule MM, Merletti F, Gatta G, EUROCARE-5 Working Group Survival of European adolescents and young adults diagnosed with cancer in 2000-07: population-based data from EUROCARE-5. Lancet Oncol. 2016 Jul;17(7):896–906. doi: 10.1016/S1470-2045(16)00162-5. http://hdl.handle.net/2318/1619238 S1470-2045(16)00162-5 - DOI - PubMed
Publication types
MeSH terms
LinkOut - more resources
Full Text Sources
Medical
