. 2023 May 1;133(9):e163627.
doi: 10.1172/JCI163627.

A parathyroid hormone/salt-inducible kinase signaling axis controls renal vitamin D activation and organismal calcium homeostasis

Affiliations

A parathyroid hormone/salt-inducible kinase signaling axis controls renal vitamin D activation and organismal calcium homeostasis

Sung-Hee Yoon et al. J Clin Invest. .

Abstract

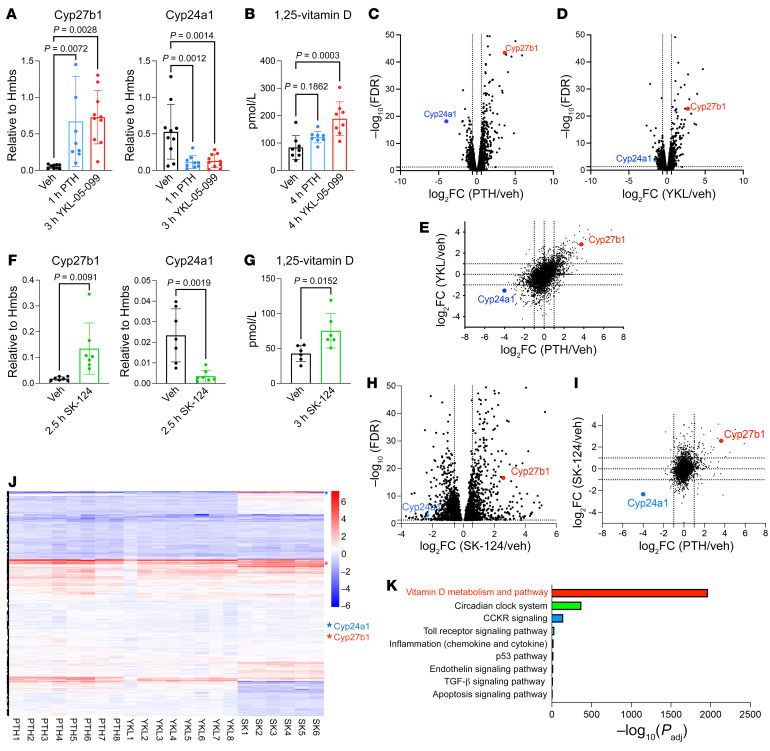
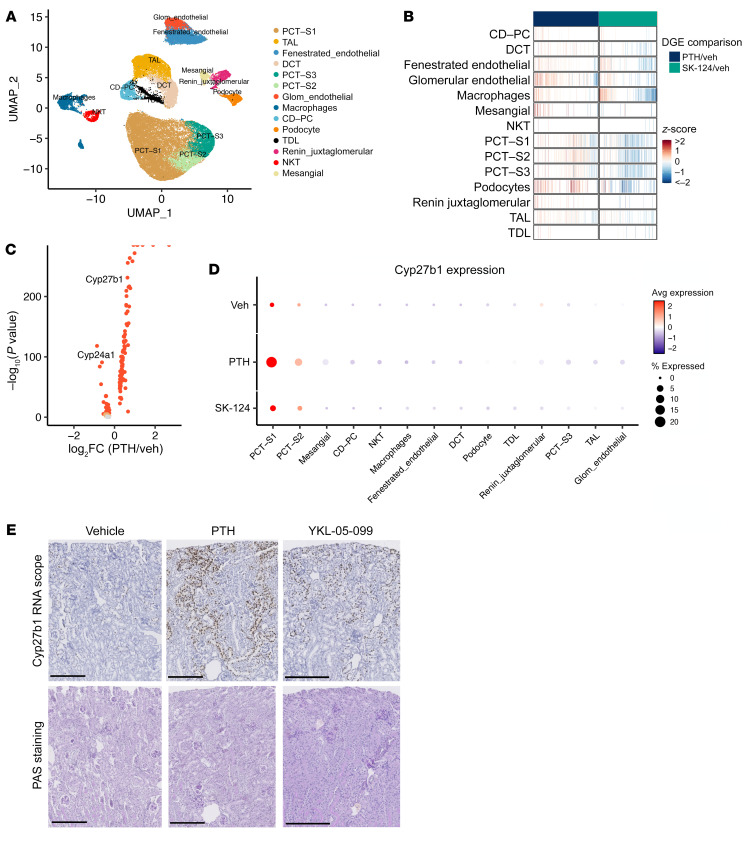
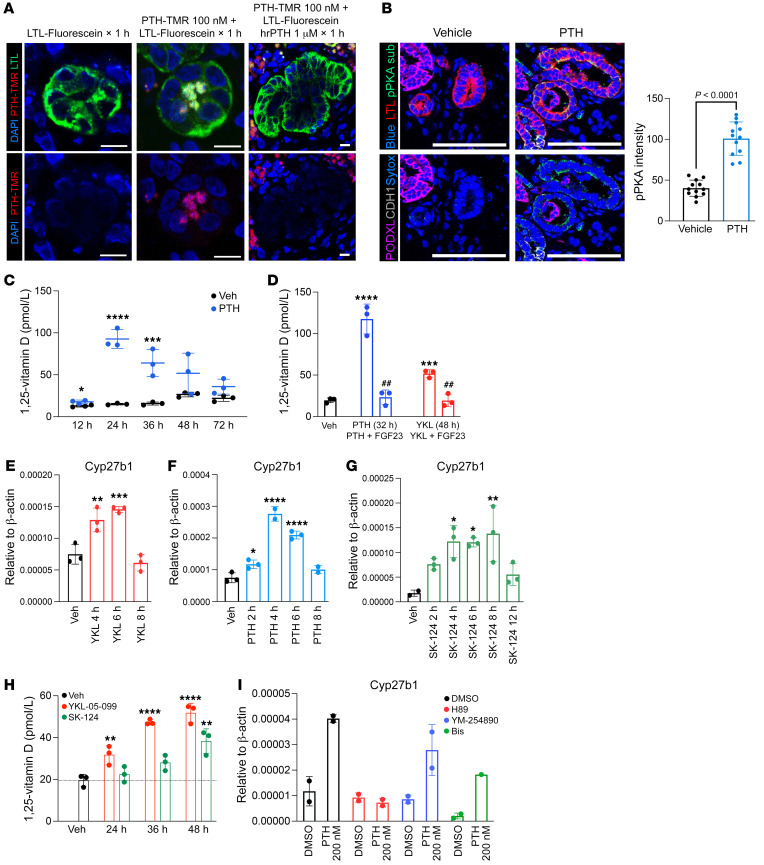
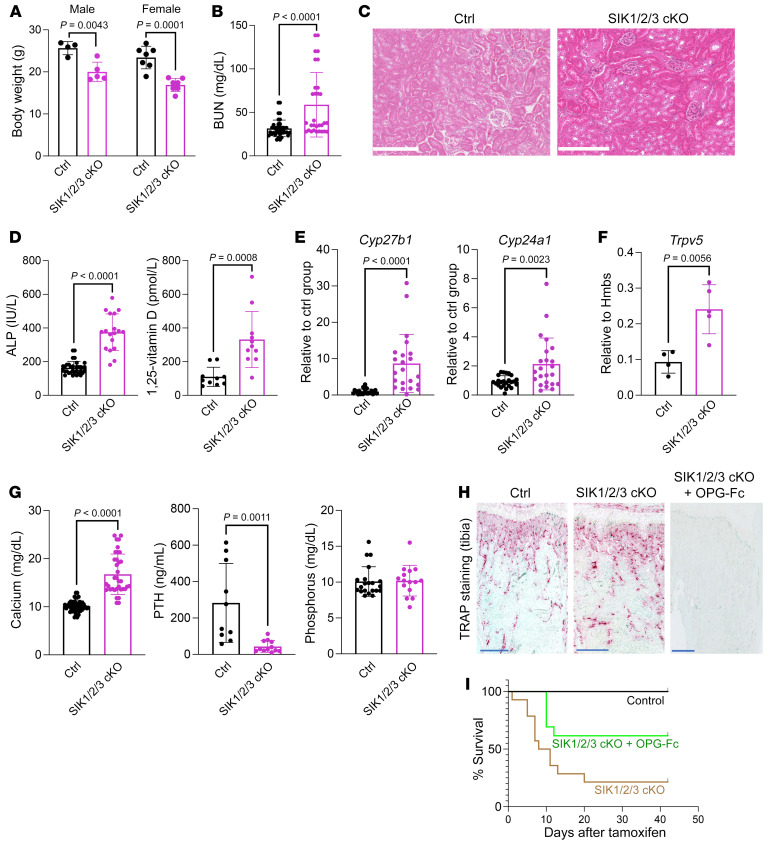
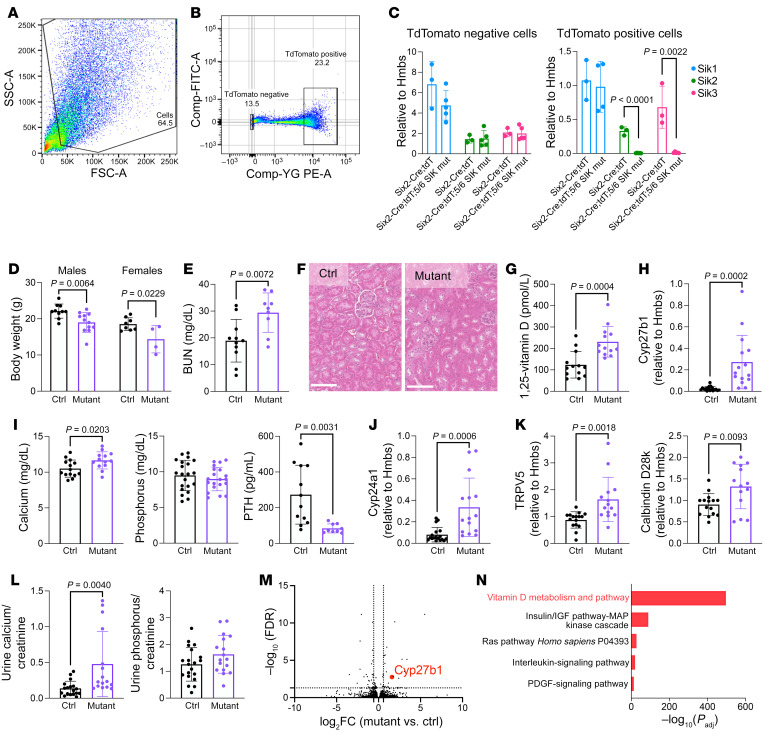
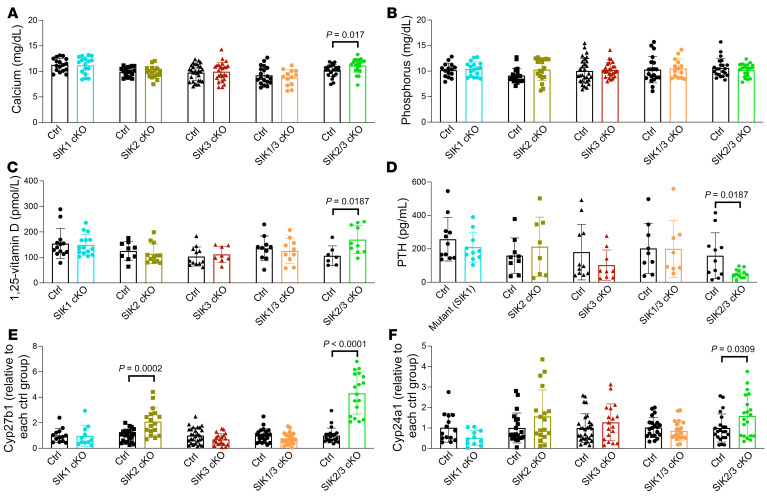
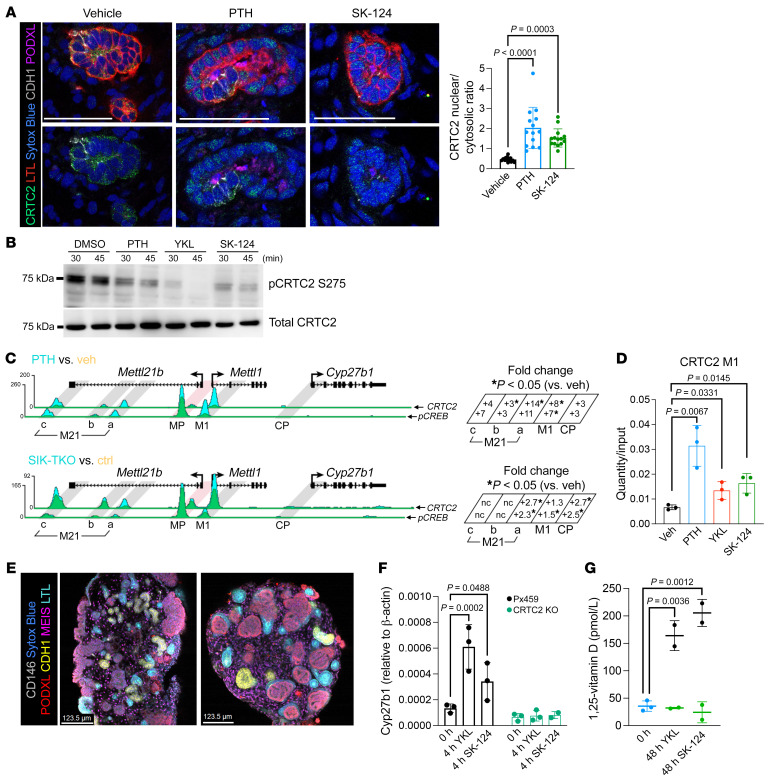
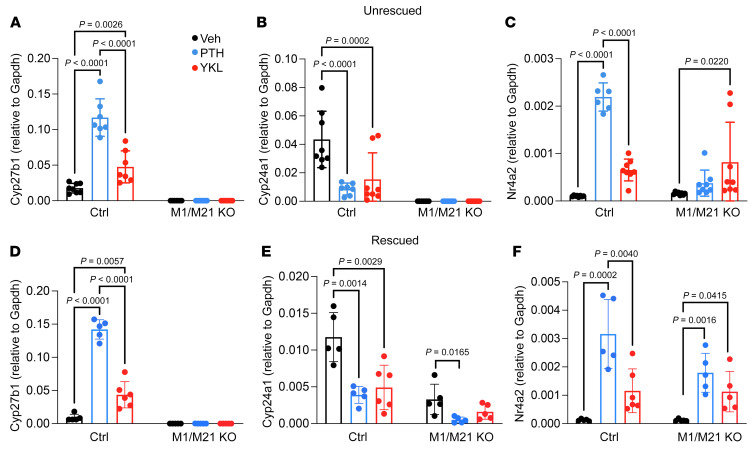
The renal actions of parathyroid hormone (PTH) promote 1,25-vitamin D generation; however, the signaling mechanisms that control PTH-dependent vitamin D activation remain unknown. Here, we demonstrated that salt-inducible kinases (SIKs) orchestrated renal 1,25-vitamin D production downstream of PTH signaling. PTH inhibited SIK cellular activity by cAMP-dependent PKA phosphorylation. Whole-tissue and single-cell transcriptomics demonstrated that both PTH and pharmacologic SIK inhibitors regulated a vitamin D gene module in the proximal tubule. SIK inhibitors increased 1,25-vitamin D production and renal Cyp27b1 mRNA expression in mice and in human embryonic stem cell-derived kidney organoids. Global- and kidney-specific Sik2/Sik3 mutant mice showed Cyp27b1 upregulation, elevated serum 1,25-vitamin D, and PTH-independent hypercalcemia. The SIK substrate CRTC2 showed PTH and SIK inhibitor-inducible binding to key Cyp27b1 regulatory enhancers in the kidney, which were also required for SIK inhibitors to increase Cyp27b1 in vivo. Finally, in a podocyte injury model of chronic kidney disease-mineral bone disorder (CKD-MBD), SIK inhibitor treatment stimulated renal Cyp27b1 expression and 1,25-vitamin D production. Together, these results demonstrated a PTH/SIK/CRTC signaling axis in the kidney that controls Cyp27b1 expression and 1,25-vitamin D synthesis. These findings indicate that SIK inhibitors might be helpful for stimulation of 1,25-vitamin D production in CKD-MBD.

Keywords: Bone Biology; Calcium; G protein–coupled receptors; Nephrology; Protein kinases.


Figures

Figure 1
Figure 1. Pharmacologic SIK inhibitors increase renal Cyp27b1 expression and vitamin D synthesis.
(A and B) 13-week-old male C57BL6 mice were treated with vehicle (Veh), hPTH1-34 (300 μg/kg, s.c.), or YKL-05-099 (45 mg/kg, i.p.), and the animals were sacrificed 1 hour (PTH) or 3 hours (YKL) later for kidney RT-qPCR and 4 hours later for serum 1,25-vitamin D measurements. (C and D) Whole-kidney bulk RNA-Seq was performed following acute PTH or YKL-05-099 treatment. Volcano plots demonstrating effects of PTH (versus vehicle) and YKL-05-099 (versus vehicle) based upon RNA-Seq show increased Cyp27b1 and decreased Cyp24a1 expression, and (E) the correlation between these treatments is illustrated in the scatter plot. In an independent study, 8-week-old male C57BL6 mice were treated with vehicle or SK-124 (40 mg/kg, i.p.) and sacrificed after injection at the indicated times for (F) gene expression and (G) serum 1,25-vitamin D measurement. (H and I) Bulk RNA-Seq analysis demonstrated increased Cyp27b1 and reduced Cyp24a1 expression by SK-124 versus vehicle. (J) Heatmap showing normalized expression values (z score for each gene versus vehicle) for differentially expressed genes (rows) across individual mice (columns). Cyp27b1 and Cyp24a1 are indicated with red and blue asterisks. (K) Gene Ontology analysis of up- and downregulated genes by all 3 treatments (PTH, YKL-05-099, and SK-124) showed vitamin D metabolism and pathway as the top GO term. One-way ANOVA with Dunnett’s post hoc test was used for A and B, and Student’s t test was used in F and G.
Figure 2
Figure 2. Single-cell RNA-Seq demonstrates cell type–specific renal PTH effects and proximal tubule segment 1–specific Cyp27b1 induction.
(A) 8-week-old male C57B6 mice were treated with a single dose of vehicle, PTH (300 μg/kg), or SK-124 (40 mg/kg) and sacrificed 90 minutes or 2.5–3 hours later for PTH or SK-124 treatment, respectively. Single-cell suspensions from kidneys were made for scRNA-Seq. UMAP projection demonstrating expected populations of kidney cells in aggregate data from all 12 samples. (B) Heatmap (each line is an individual gene) showing overall patterns of cluster-specific differential gene expression analysis. Distinct groups of genes are regulated by PTH and SIK inhibitors across different renal cell types. (C) Volcano plot showing differential gene expression analysis in PCT-S1 cells in response to PTH (versus vehicle). (D) Dot plot showing that segment 1 (S1) of proximal convoluted tubule (PCT) is where PTH-induced Cyp27b1 change is the most prominent. The color of the dots shows average gene expression level, while the size of the dots indicates the percentage of cells expressing the gene of interest in each cluster. (E) Cyp27b1 in situ hybridization (brown, RNAscope) in paraffin-embedded kidney sections. Periodic acid–Schiff stain was performed to mark tubular morphology. Scale bars: 250 μm.
Figure 3
Figure 3. PTH and SIK inhibitors increase Cyp27b1 expression and 1,25-vitamin D synthesis in human kidney organoids.
(A) H9 human embryonic stem cell–derived kidney organoids were treated with TMR-labeled PTH and then stained with LTL. (B) Kidney organoids were treated with PTH1-34 for 30 minutes and immunostained with pPKA substrate antibody to show PTH responsiveness (Lotus Tetragonolobus Lectin [LTL] for proximal tubule; CDH1 for distal tubule; podocalyxin [PODXL] for podocytes; Sytox Blue as the nuclear dye). Scale bars: 100 μm. Quantification is shown in the histogram on the right. Student’s t test was performed for statistical analysis. (C) Day 28 organoids were treated for the indicated times with vehicle or PTH (242 nM), and 1,25-vitamin D was measured in the culture media by ELISA. (D) PTH-induced 1,25-vitamin D production was inhibited by cotreatment with FGF23 (100 nM). (EG) Cyp27b1 gene expression was measured by RT-qPCR in response to treatment for the indicated times with PTH (242 nM) and SIK inhibitors, YKL-05-099 (10 μM) and SK-124 (20 μM). (H) Similar experiments in which 1,25-vitamin D was measured in the culture media by ELISA. (I) Pretreatment with H89 (10 μM), YM-254890 (10 μM), and bisindolylmaleimide I (10 μM) for 1 hour prior to 4-hour PTH treatment (242 nM) showed that cAMP/PKA pathway is responsible for PTH-induced Cyp27b1 upregulation. Data are shown as the mean ± SD, and each dot represents independent sample of 3–4 organoids pooled together. For C, Student’s t test were performed between PTH and Veh at each time point. For D, Student’s t test was performed against Veh (indicated by ***P < 0.001, ****P < 0.0001) and to test the effect of FGF23 (indicated by ##P < 0.001). For EH, 1-way ANOVA was performed, with Dunnett’s post hoc test, against Veh (*P < 0.05; **P < 0.01, ***P < 0.001, ****P < 0.0001).
Figure 4
Figure 4. Global/inducible deletion of all 3 SIK isoforms causes PTH-independent hypercalcemia and lethality.
(A) 6-week-old mice of the indicated genotypes were treated with tamoxifen. Body weights of male and female inducible SIK triple-KO (iTKO) mice were obtained at the time of sacrifice. (B) Blood urea nitrogen (BUN) measurement in control and iTKO mice. (C) Renal histology (H&E stain) from control and iTKO animals revealing no obvious differences between genotypes. Scale bars: 250 μm. (D) Alkaline phosphatase (ALP) and 1,25-vitamin D measurement in control and iTKO mice. (E and F) Renal gene expression of Cyp27b1, Cyp24a1, and Trpv5 by RT-qPCR. (G) Serum analysis of calcium, PTH, and phosphorus in control and iTKO mice. (H) TRAP staining of decalcified, paraffin-embedded tibia sections reveals increased osteoclasts in iTKO mice. Osteoclasts are essentially absent following OPG-Fc treatment. Scale bars: 500 μm. (I) Survival curve of iTKO mice treated with or without OPG-Fc (200 μg/mouse) (n = 42 Ctrl, n = 14 iTKO, n = 13 iTKO + OPG-Fc). Data are shown as the mean ± SD, and each dot represents an individual mouse. Student’s t test was performed for statistical analysis, and P values are shown.
Figure 5
Figure 5. Renal pseudohyperparathyroidism upon kidney-specific SIK deletion.
(A and B) Six2-Cre and Six2-Cre;Sik1fl/+;Sik2fl/fl;Sik3fl/fl mice were crossed with Ai14 tdTomato reporter mice, and tdTomato-positive cells were sorted to assess gene deletion efficiency more accurately without other cell types, including blood and immune cells. Single-cell suspensions from kidneys were generated, and tdTomato-positive and -negative cells were sorted as shown. (C) tdTomato-positive cells showed approximately 98% Sik2 and Sik3 gene deletion efficiency in Six2-Cre;Sik1fl/+;Sik2fl/fl;Sik3fl/fl mice, and tdTomato-negative cells did not show any change in Sik mRNA expression levels. (D) Body weights and (E) serum blood urea nitrogen (BUN) are shown, (F) along with kidney histology (H&E stain) images from the indicated animals. No overt histologic differences were noted in mutants. Scale bars: 100 μm. (G) 1,25-vitamin D measurement in control and SIK mutant mice. (H) Renal Cyp27b1 expression by RT-qPCR. (I) Serum calcium, phosphorus, and PTH measurements are shown. (J and K) Renal RNA was isolated to measure 1,25-vitamin D–induced genes (Cyp24a1, TRPV5, and Calbindin D28k [Calb1]) by RT-qPCR. (L) Urine calcium and phosphorus are normalized to creatinine. (M) Bulk RNA-Seq from whole-kidney RNA from control and mutant mice showed increased Cyp27b1. (N) GO terms from dysregulated genes in SIK mutant mice. Data are shown as the mean ± SD, and each dot represents an individual mouse. Student’s t test was performed for statistical analysis, and P values are shown.
Figure 6
Figure 6. Allelic series of kidney-specific SIK mutant mice reveals a key role for SIK2 and SIK3 in controlling Cyp27b1 expression.
The indicated strains were analyzed. In all cases, littermate control mice were floxed for the indicated SIK mutant allele but negative for the Six2-Cre transgene. (A) Serum calcium, (B) phosphorus, (C) 1,25-vitamin D, and (D) PTH were measured, (E) along with kidney RNA for Cyp27b1 and (F) the 1,25-vitamin D target gene Cyp24a1. Only SIK2/SIK3 double-KO mice showed a comparable phenotype as Six2-Cre;Sik1fl/+; Sik2fl/fl; Sik3fl/fl animals, with increased Cyp27b1, mild hypercalcemia, 1,25-vitamin D, and suppressed PTH. Data are shown as the mean ± SD, and each dot represents an individual mouse. Student’s t test was performed against littermate controls for each genotype, and P values of less than 0.05 are shown. See also Supplemental Figure 10 for gDNA and mRNA gene deletion and urine data.
Figure 7
Figure 7. CRTC2 plays a crucial role in Cyp27b1 transcriptional control downstream of PTH/SIK signaling.
(A) Kidney organoids were treated with DMSO, PTH (242 nM), or SK-124 (10 μM) for 3 hours and immunostained to show CRTC2 nuclear translocation in Lotus Tetragonolobus Lectin–positive (LTL-positive) proximal tubules. Images on the top and bottom are identical with the exception that images on the lower row are shown without the LTL channel (LTL for proximal tubule; CDH1 for distal tubule; podocalyxin [PODXL] for podocytes; Sytox Blue as the nuclear dye). Scale bars: 50 μm. Quantification is shown in the histogram on the right, with P values from 1-way ANOVA followed by Tukey’s post hoc test. (B) Opossum kidney (OK) cells were treated for the indicated times with PTH (242 nM), YKL-05-099 (10 μM), and SK-124 (20 μM), followed by total and phospho-CRTC2 S275 immunoblotting. (C) Top: Mice were treated with PTH (230 ng/g, 30 min, i.p.) or vehicle followed by ChIP-Seq for CRTC2 or phospho-CREB (n = 3 per treatment). Bottom: Control and inducible/global SIK1/2/3 TKO mice (n = 3 per genotype) (see Figure 4) were treated with tamoxifen and sacrificed 48 hours later followed by kidney ChIP-Seq. Quantification of peak density is shown on the right for the various M21 enhancer subpeaks, along with the M1 enhancer and the Cyp27b1 promoter (CP). Fold change (versus vehicle) or peak density is shown, with asterisks indicating inducible binding of the indicated protein (CRTC2 on the top, pCREB on the bottom) at each site. (D) CRTC2 ChIP-qPCR using M1 enhancer primers was performed on kidneys from mice treated for 30 minutes as indicated. Recovered DNA relative to input samples is shown. (E) Representative images of Px459 and CRTC2-KO organoids show the development of nephron segments including proximal tubules by LTL staining. (MEIS for stromal cells; CDH1 for distal tubule; CD146 for vasculature; Sytox-Blue is for nucleic acid, staining all the cells.) Scale bars: 123.5 μm. (F and G) Cyp27b1 expression and 1,25-vitamin D secretion after SIK inhibitor treatment with YKL-05-099 (10 μM) and SK-124 (20 μM) in PX459 and CRTC2-KO kidney organoids are shown. Blue dots in G indicate the baseline 0-hour control for both YKL-05-099 and SK-124 drugs.
Figure 8
Figure 8. M1 and M21 Cyp27b1 enhancers are required for SIK inhibitor–stimulated gene regulation.
(AC) Control and M1/M21 Cyp27b1 enhancer double-KO (DIKO) mice were treated with a single injection of vehicle, PTH (230 ng/g, 30 min, i.p.), or YKL-05-099 (45 mg/kg, 60 min, i.p.), and kidney RNA was isolated for RT-qPCR of the indicated gene. (DF) Mice were fed a rescue diet to normalize calcium, phosphorous, and PTH for 16 weeks and then treated with a single dose of Veh, PTH, or YKL-05-099, followed by kidney RNA isolation and RT-qPCR. Data are shown as the mean ± SD, and each dot represents an individual mouse. One-way ANOVA within the same genotype followed by Tukey’s post hoc test was performed for statistical analysis. Adjusted P values are shown.
Figure 9
Figure 9. SIK inhibitor treatment increases renal Cyp27b1 expression and 1,25-vitamin D levels in a mouse model of CKD-MBD.
(A) Schema of study timeline. In inducible CTCFpodocyte–/– mice, doxycycline administration (to induce chronic kidney disease) causes podocyte loss and development of CKD-MBD compared with sucrose water administration (control). After 6.5 weeks of doxycycline or sucrose water, mice were treated with a single dose of either vehicle or SK-124 (40 mg/kg, i.p.), and sera were collected 4 hours later. (BE) Serum parameters were measured in the indicated groups. (F and G) Kidney RNA was isolated for RT-qPCR. Data are shown as the mean ± SD, and each dot represents an individual mouse. Two-way ANOVA was performed, followed by post hoc t tests within each disease group (control group mice administered sucrose or CKD mice administered doxycycline) to determine if the SK-124 treatment effect was statistically significant.

Comment in

References

    1. Jeon SM, Shin EA. Exploring vitamin D metabolism and function in cancer. Exp Mol Med. 2018;50(4):1–14. doi: 10.1038/s12276-018-0038-9. - DOI - PMC - PubMed
    1. Berridge MJ. Vitamin D deficiency and diabetes. Biochem J. 2017;474(8):1321–1332. doi: 10.1042/BCJ20170042. - DOI - PubMed
    1. Montenegro KR, et al. Mechanisms of vitamin D action in skeletal muscle. Nutr Res Rev. 2019;32(2):192–204. doi: 10.1017/S0954422419000064. - DOI - PubMed
    1. Goltzman D. Functions of vitamin D in bone. Histochem Cell Biol. 2018;149(4):305–312. doi: 10.1007/s00418-018-1648-y. - DOI - PubMed
    1. Lips P, van Schoor NM. The effect of vitamin D on bone and osteoporosis. Best Pract Res Clin Endocrinol Metab. 2011;25(4):585–591. doi: 10.1016/j.beem.2011.05.002. - DOI - PubMed

Publication types

MeSH terms