. 2023 Mar 2:12:e83618.
doi: 10.7554/eLife.83618.

Quantitative proteomic analysis of skeletal muscles from wild-type and transgenic mice carrying recessive Ryr1 mutations linked to congenital myopathies

Affiliations

Quantitative proteomic analysis of skeletal muscles from wild-type and transgenic mice carrying recessive Ryr1 mutations linked to congenital myopathies

Jan Eckhardt et al. Elife. .

Abstract

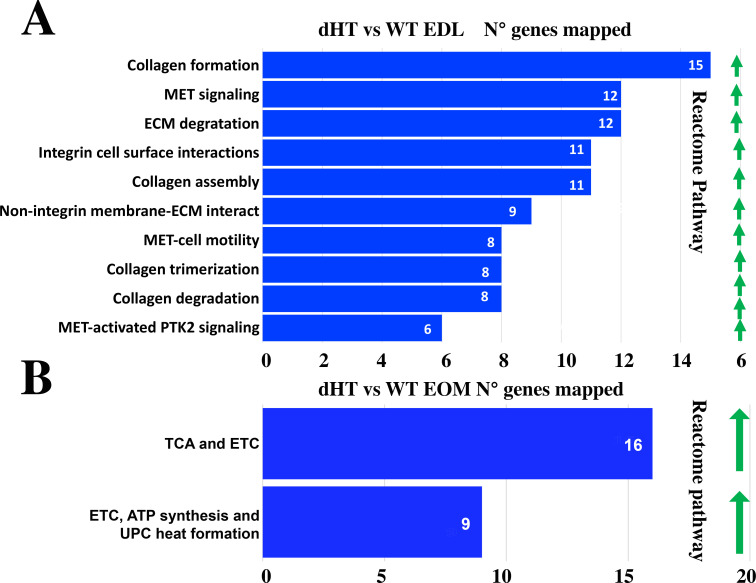
Skeletal muscles are a highly structured tissue responsible for movement and metabolic regulation, which can be broadly subdivided into fast and slow twitch muscles with each type expressing common as well as specific sets of proteins. Congenital myopathies are a group of muscle diseases leading to a weak muscle phenotype caused by mutations in a number of genes including RYR1. Patients carrying recessive RYR1 mutations usually present from birth and are generally more severely affected, showing preferential involvement of fast twitch muscles as well as extraocular and facial muscles. In order to gain more insight into the pathophysiology of recessive RYR1-congential myopathies, we performed relative and absolute quantitative proteomic analysis of skeletal muscles from wild-type and transgenic mice carrying p.Q1970fsX16 and p.A4329D RyR1 mutations which were identified in a child with a severe congenital myopathy. Our in-depth proteomic analysis shows that recessive RYR1 mutations not only decrease the content of RyR1 protein in muscle, but change the expression of 1130, 753, and 967 proteins EDL, soleus and extraocular muscles, respectively. Specifically, recessive RYR1 mutations affect the expression level of proteins involved in calcium signaling, extracellular matrix, metabolism and ER protein quality control. This study also reveals the stoichiometry of major proteins involved in excitation contraction coupling and identifies novel potential pharmacological targets to treat RyR1-related congenital myopathies.

Keywords: RYR1; congenital myopathy; excitation contraction coupling; genetics; genomics; mass spectrometry; mutations; proteomic profiling; ryanodine receptor mutations; skeletal muscle.


Conflict of interest statement

JE, AR, SK, MF, HM, AS, ST, FZ No competing interests declared

Figures

Figure 1.
Figure 1.. Schematic overview of the workflow.
(A) Skeletal muscles from 12 weeks old WT (5 mice) and dHT littermates (5 mice) were isolated and flash frozen. Three different types of muscles were isolated per mouse, namely EDL, soleus and EOMs. On the day of the experiment, muscles were solubilized and processed for LC-MS. (B) For absolute protein quantification, synthetic peptides of RyR1, Cav1.1, Stim1 and Orai1 were used. (C) Protein content in different muscle types and in the different mouse genotypes were analyzed and compared.
Figure 2.
Figure 2.. Proteomic analysis of EDL, soleus and EOM muscles from WT mice confirms the significant difference in content if proteins involved in the TCA cycle and electron transport chain, fatty acid metabolism and muscle contraction.
(A) Hierarchically clustered heatmaps of the relative abundance of proteins in EDL (columns 1–5) and soleus muscles (columns 6–10) from five mice. Blue blocks represent proteins which are increased in content, yellow blocks proteins which are decreased in content in EDL versus soleus muscles. Right pie chart shows overall number of increased (blue) and decreased (yellow) proteins. Areas are relative to their numbers. (B) Volcano plot of a total of 1866 quantified proteins which showed significant increased (blue) and decreased (yellow) content. The horizontal coordinate is the difference multiple (logarithmic transformation at the base of 2), and the vertical coordinate is the significant difference p value (logarithmic transformation at the base of 10). The proteins showing major change in content are abbreviated. Soleus: condition 2; EDL: condition 1(C) Reactome pathway analysis showing major pathways which differ between EDL and soleus muscles. (D) Hierarchically clustered heatmaps of the relative abundance of proteins in EDL (columns 1–5) and EOM muscles (columns 6–10) from five mice. Blue blocks represent proteins which are increased in content, yellow blocks proteins which are decreased in content in EDL versus EOM muscles. Right pie chart shows overall number of increased (blue) and decreased (yellow) proteins. Areas are relative to their numbers. (E) Volcano plot of a total of 1866 quantified proteins which showed significant increased (blue) and decreased (yellow) content. The horizontal coordinate is the difference multiple (logarithmic transformation at the base of 2), and the vertical coordinate is the significant difference p value (logarithmic transformation at the base of 10). The proteins showing major change in content are abbreviated. EOM: condition 2; EDL: condition 1 (F) Reactome pathway analysis showing major pathways which differ between EDL and EOM muscles. (G) Hierarchically clustered heatmaps of the relative abundance of proteins in soleus muscles (columns 1–5) and EOM (columns 6–10) from five mice. Blue blocks represent proteins which are increased in content, yellow blocks proteins which are decreased in content in soleus muscles versus EOM. Right pie chart shows overall number of increased (blue) and decreased (yellow) proteins. Areas are relative to their numbers. (H) Volcano plot of a total of 1866 quantified proteins which showed significant increased (blue) and decreased (yellow) content. The horizontal coordinate is the difference multiple (logarithmic transformation at the base of 2), and the vertical coordinate is the significant difference p value (logarithmic transformation at the base of 10). The proteins showing major change in content are abbreviated. EOM: condition 2; soleus: condition 1 (I) Reactome pathway analysis showing major pathways which differ between soleus and EOM muscles. A q-value of equal or less than 0.05 was used to filter significant changes prior to the pathway analyses. An additional filter was applied to the Heatmaps and Piecharts and only proteins showing a significant change ≥0.2 fold are included.
Figure 3.
Figure 3.. Proteomic analysis comparison of muscles from dHT and WT mice.
(A, C and E) Hierarchically clustered heatmaps of the relative abundance of proteins in EDL (A), soleus muscles (C) and EOMs (E) from three to five mice. Blue blocks represent proteins which are increased in content, yellow blocks proteins which are decreased in content in WT (columns 1–5 in A and E; 1–3 in C) versus dHT (5–10 in A and E; 4–8 in C). Right pie chart shows overall number of increased (purple) and decreased (yellow) proteins. Areas are relative to their numbers. (B, D and F) Volcano plots of total quantified proteins showing significant increased (blue) and decreased (yellow) content in dHT (condition 2) versus WT (condition 1) EDL (B), soleus (D) and EOMs (F). The horizontal coordinate is the difference multiple (logarithmic transformation at the base of 2), and the vertical coordinate is the significant difference p value (logarithmic transformation at the base of 10). The proteins showing major change in content are abbreviated. A q-value of equal or less than 0.05 was used to filter significant changes prior to the pathway analyses. An additional filter was applied to the Heatmaps and Piecharts and only proteins showing a significant change ≥0.2-fold are included.
Figure 3—figure supplement 1.
Figure 3—figure supplement 1.. Reactome pathway analysis showing major pathways which differ between EDL muscles (A) and EOM muscles (B) in dHT versus WT mice.
A q-value of equal or less than 0.05 and showing a significant change ≥0.2 fold was used to filter significant changes prior to the pathway analyses.
Figure 4.
Figure 4.. Changes in protein content in EDL, soleus and EOM between dHT vs WT mice.
(A) Venn diagram showing significantly decreased proteins (left) and increased proteins (right) in the three muscle types. (B) GO biological process analysis of common proteins that are downregulated and (C) upregulated in muscle from dHT mice. Left panels, common proteins showing significant changes in content in both EDL and soleus muscles. Central panels, common proteins showing significant changes in content in EDL and EOMs; right panels, common proteins showing significant changes in content in EOM and soleus muscles. (D) List of the 39 proteins whose content is increased in EDL, soleus and EOMs in dHT mice. (E) GO analysis annotated to Biological processes of the 39 proteins that are increased in muscles from dHT mice.
Figure 4—figure supplement 1.
Figure 4—figure supplement 1.. Gene Ontology annotated to Biological process genes showing significant differences in content between muscles from dHT and WT mice.
(A, B) and (C) Downregulated genes and (D, E) and (F) upregulated genes in EDL (A and C), soleus (B and E) and EOM (C and F) muscles. The N° of genes annotated to each category is indicated on the Y-axis. Only proteins showing a q-value equal to or less than 0.05 and showing a significant change ≥0.2 fold were included in the pathway analyses.
Figure 5.
Figure 5.. Correlation of the actual cellular abundances of four selected proteins (in µmol/kg wet weight) determined by PRM/SID (n=2) and the iBAQ values (n=5) determined by label-free/TMT quantification (both in logarithmic scale, base 2) from the global proteomics discovery dataset for EDL samples.
Error bars are indicated for the y-axis, but for the x-axis, due to their low scale (range from 0.058 to 0.086), they are not shown by the software PRISM, GraphPad Software, (v9). The simple linear regression results obtained by PRISM GraphPad Software, (v9) are shown on the right.
Figure 6.
Figure 6.. EOMs are enriched in Stim 1.
(A) Representative western blots showing Stim1 and Stim1L immunopositive bands. Forty and eighty micrograms of total homogenates from EOM, soleus, and EDL muscles isolated from WT mice were loaded onto a 7.5% SDS PAGE. Proteins were blotted onto nitrocellulose, probed with an antibody recognizing Stim1 and Stim1L, followed by incubation with an anti-rabbit IgG HRP-linked antibody. Bands were visualized by chemiluminescence. Blots were subsequently stripped and probed with anti-MyHC (all) for loading normalization (bottom panel). (B) Relative content of Stim1 in the three muscle types examined. Each symbol represents the value of a single mouse. *** p<0.001.
Author response image 1.
Author response image 1.. Western blot analysis of muscle homogenates from WT mice probed with anti- junctophilin-1 and anti-Collagen Ia1 antibodies.
Proteins in total muscle homogenates of EDL, soleus and EOM were separated on a 7.5% PAGE-SDS gel, transferred overnight onto nitrocellulose and probed with the following Ab: rabbit anti-Junctophilin-1 (1:2000, a generous gift of Takeshima, Kyoto University, Kyoto, Japan); mouse anti-collagen I alpha1 (1:2000 Novus Biological Catalog N° NBP2-92858); anti-MyHC all isoforms (1:5000; Millipore Catalog N° 41025). Western blots were incubated with the primary antibodies followed by peroxidase conjugated Protein G (Σ-Aldrich, 1:130000) or peroxidase-conjugated anti-mouse IgG (Fab Specific) Ab (Σ-Aldrich; 1:200 000). The immuno-positive bands were visualized by chemiluminescence using the WesternBright ECL HRP Substrate. For junctophilin-1 and Collagen Ia1 blots, 30 µg protein per lane were loaded; for MyHC, 5 µg protein per lane were loaded.
Author response image 2.
Author response image 2.. qPCR of Cacna1s and Stac3 in muscles from WT mice.
The expression levels of the transcripts encoding Cacna1s and Stac3 are the highest in EDL muscles and the lowest in soleus muscles (top panels). There are no significant changes in their relative expression levels in dHT vs WT. Each symbol represents the value from of a single mouse. * p=0.028 Mann Whitney test qPCR was performed as described in Elbaz et al., 2019 (Hum Mol Genet 28, 2987-2999).
Author response image 3.
Author response image 3.. Histological staining of EDL and soleus muscles from EDL and soleus.
Cross sectional area of HandE stained muscle sections from WT and dHT mice. No evidence of inflammation or necrosis is present in muscles from dHT mice. Bar = 100 µm. Muscles were isolated and embedded in OCT and deep-frozen in 2-methylbutane. Transver 10 µm thick muscle sections were made with a Leica Cryostat (CM1950).

Update of

  • doi: 10.1101/2022.09.26.509474

References

    1. Ahrné E, Glatter T, Viganò C, von Schubert C, Nigg EA, Schmidt A. Evaluation and improvement of quantification accuracy in isobaric mass tag-based protein quantification experiments. Journal of Proteome Research. 2016;15:2537–2547. doi: 10.1021/acs.jproteome.6b00066. - DOI - PubMed
    1. Amburgey K, Bailey A, Hwang JH, Tarnopolsky MA, Bonnemann CG, Medne L, Mathews KD, Collins J, Daube JR, Wellman GP, Callaghan B, Clarke NF, Dowling JJ. Genotype-Phenotype correlations in recessive RYR1-related myopathies. Orphanet Journal of Rare Diseases. 2013;8:117. doi: 10.1186/1750-1172-8-117. - DOI - PMC - PubMed
    1. Anderson K, Cohn AH, Meissner G. High-affinity [ 3H ] PN200-110 and [ 3H ] ryanodine binding to rabbit and frog skeletal muscle. The American Journal of Physiology. 1994;266:C462–C466. doi: 10.1152/ajpcell.1994.266.2.C462. - DOI - PubMed
    1. Bers DM, Stiffel VM. Ratio of ryanodine to dihydropyridine receptors in cardiac and skeletal muscle and implications for E-C coupling. The American Journal of Physiology. 1993;264:C1587–C1593. doi: 10.1152/ajpcell.1993.264.6.C1587. - DOI - PubMed
    1. Bethlem J, Wijngaarden GK. Benign myopathy, with autosomal dominant inheritance: A report on three pedigrees. Brain. 1976;99:91–100. doi: 10.1093/brain/99.1.91. - DOI - PubMed

Publication types

Substances