. 2023 May 3;111(9):1423-1439.e4.
doi: 10.1016/j.neuron.2023.02.004. Epub 2023 Mar 1.

A spinal muscular atrophy modifier implicates the SMN protein in SNARE complex assembly at neuromuscular synapses

Affiliations

A spinal muscular atrophy modifier implicates the SMN protein in SNARE complex assembly at neuromuscular synapses

Jeong-Ki Kim et al. Neuron. .

Abstract

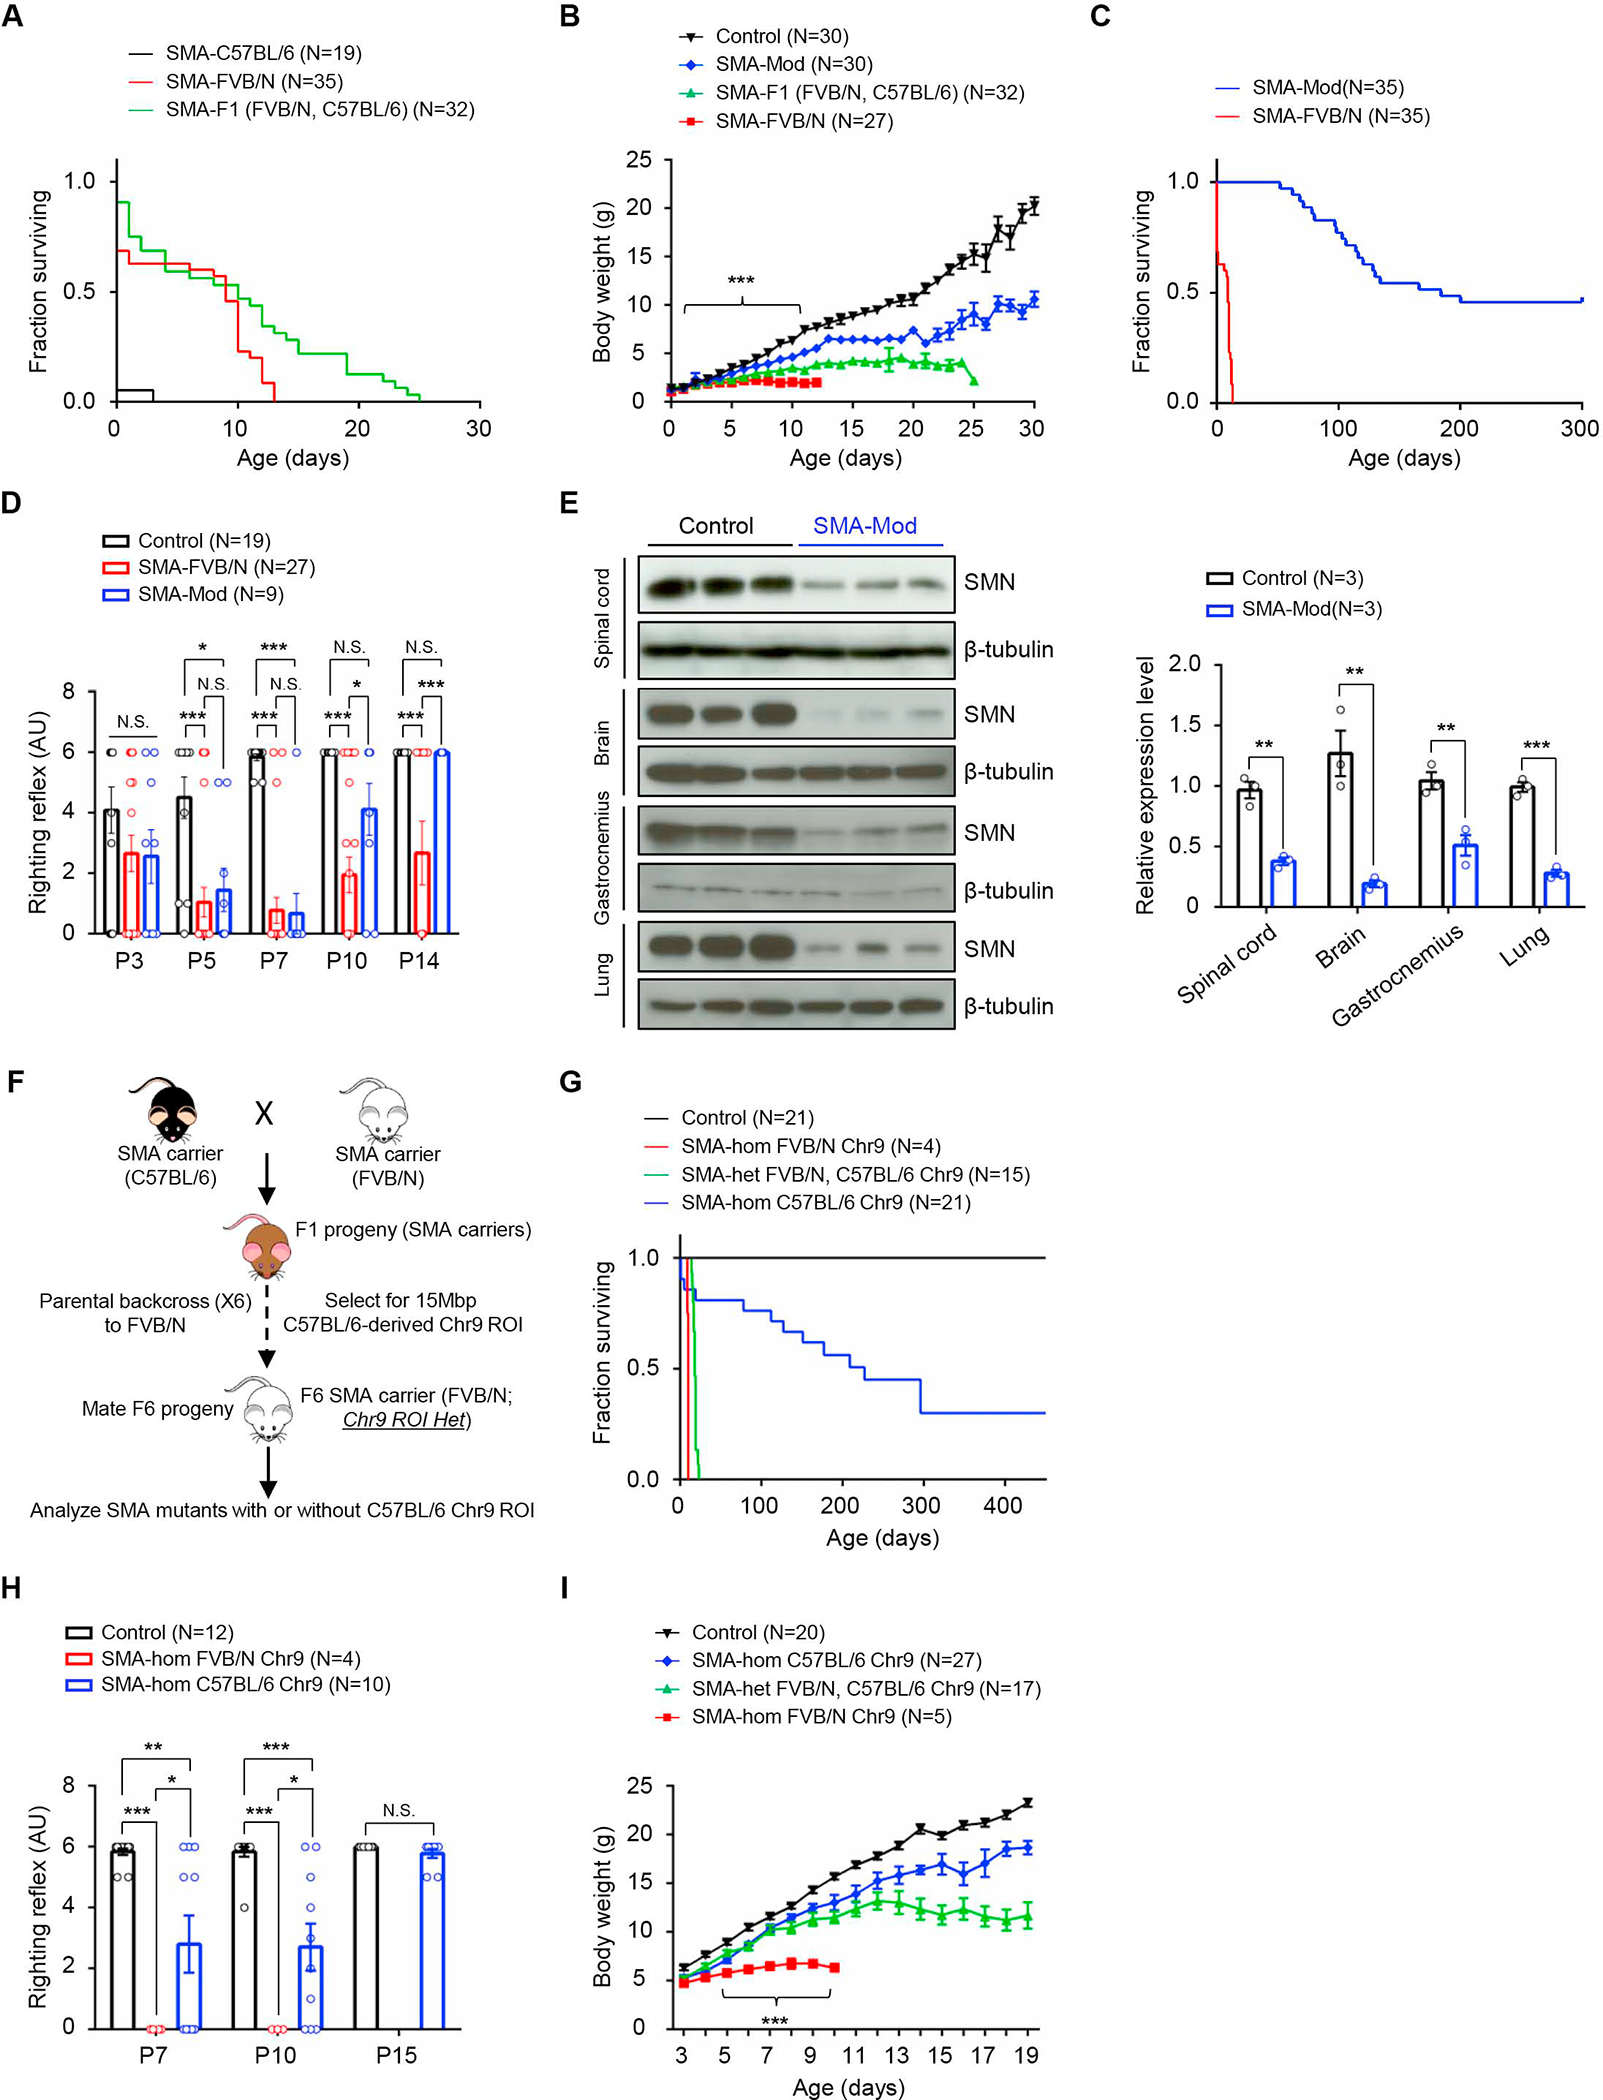
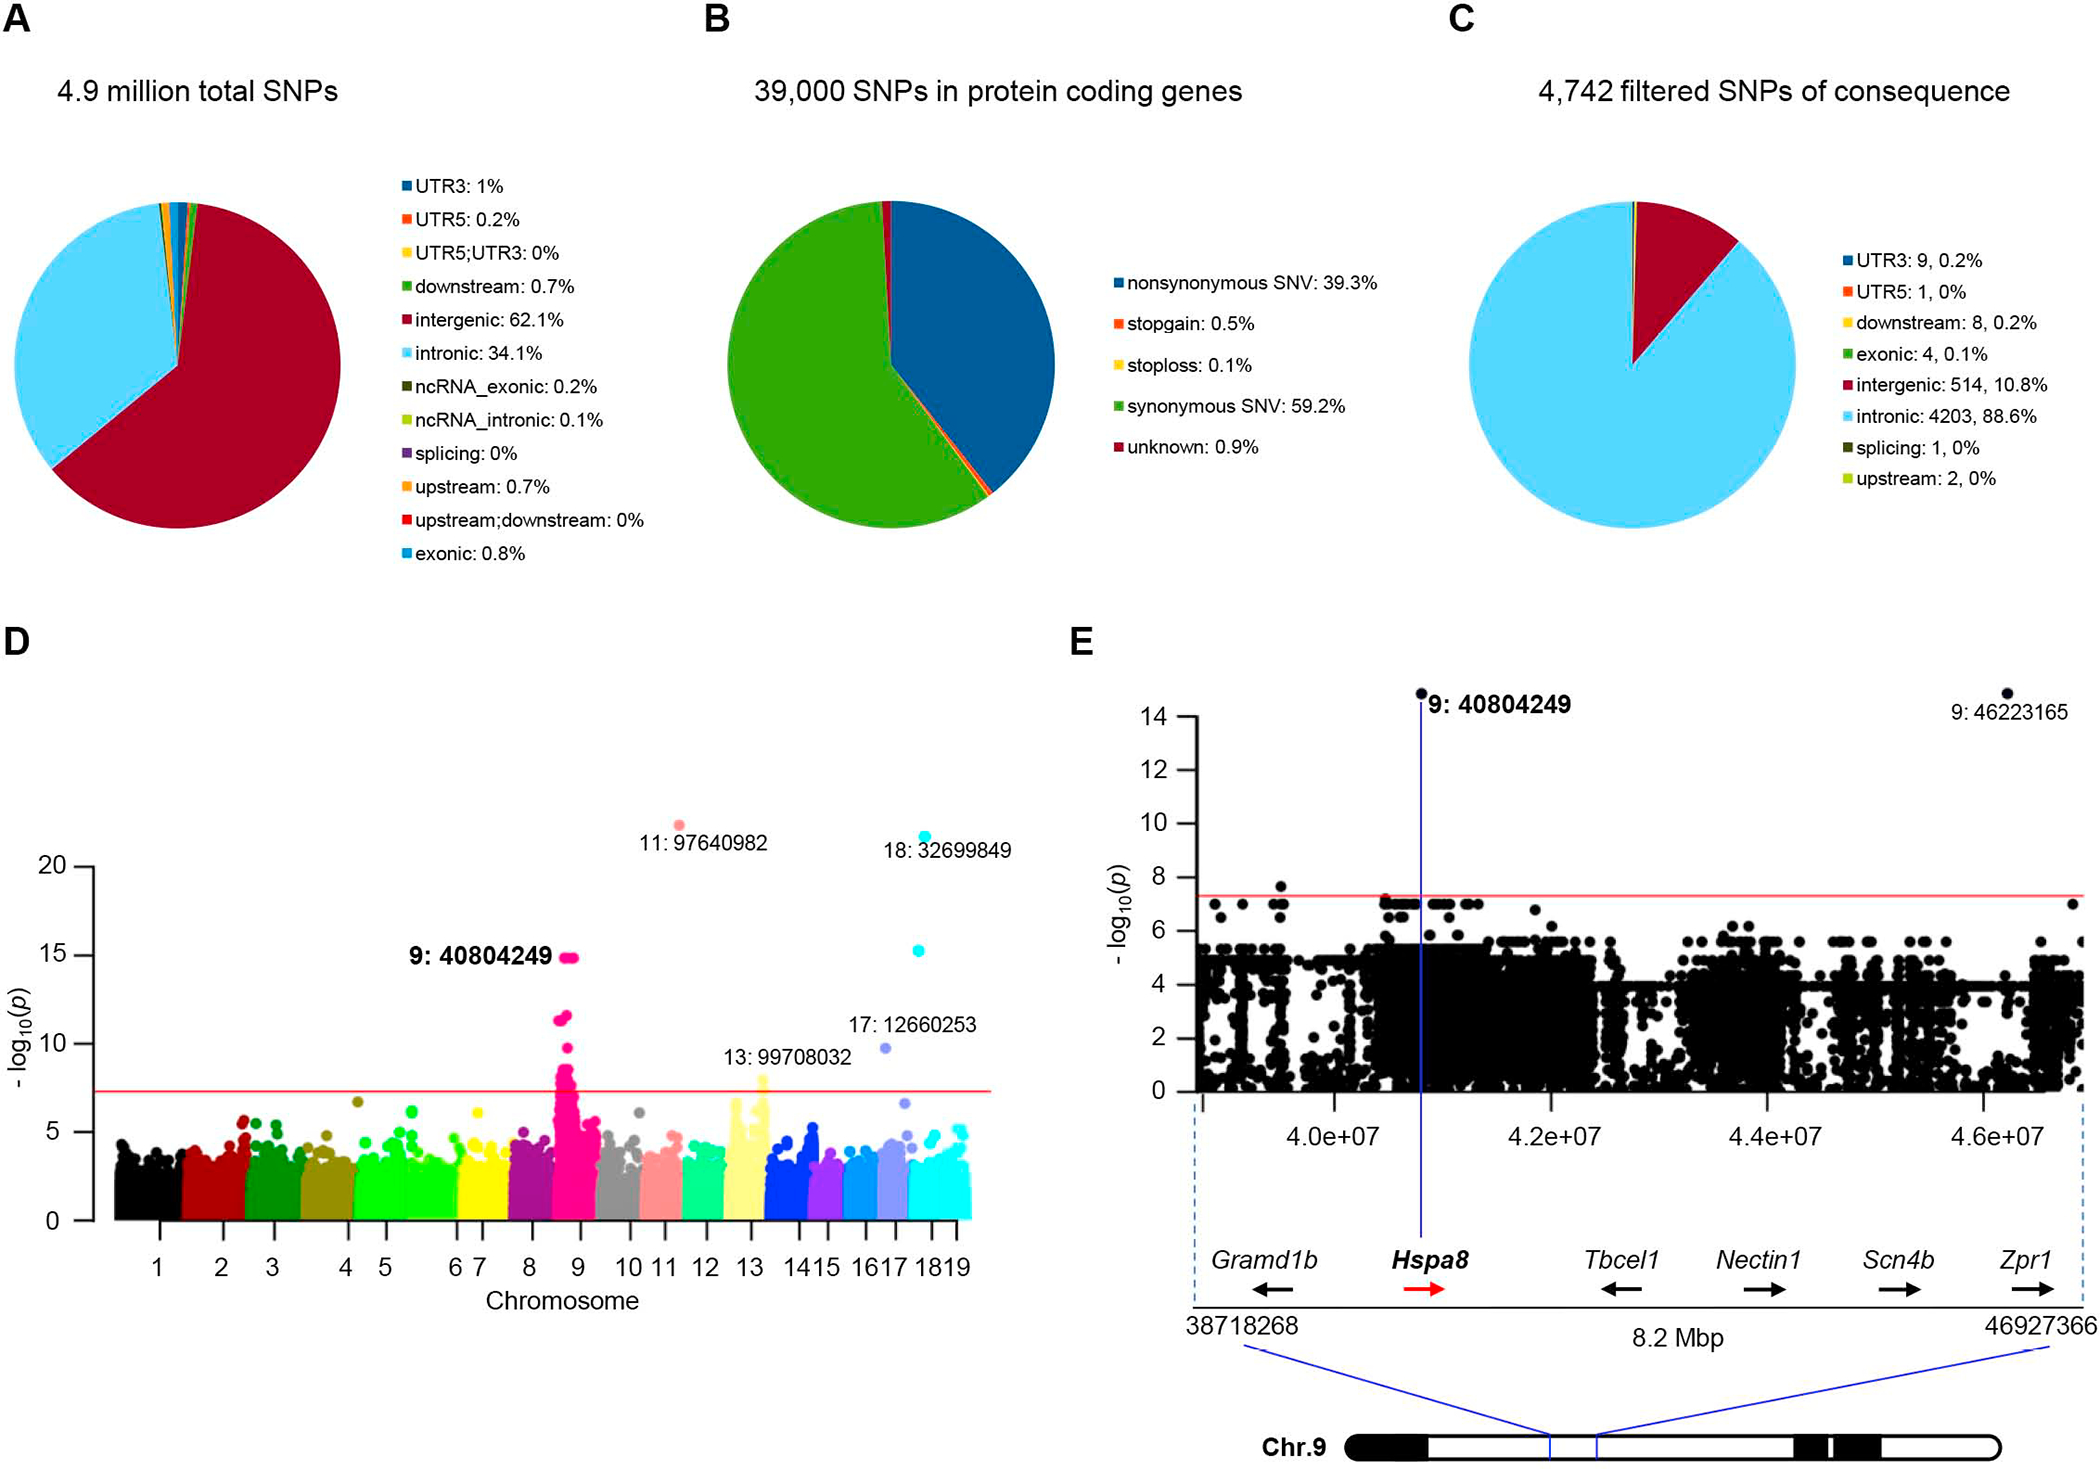
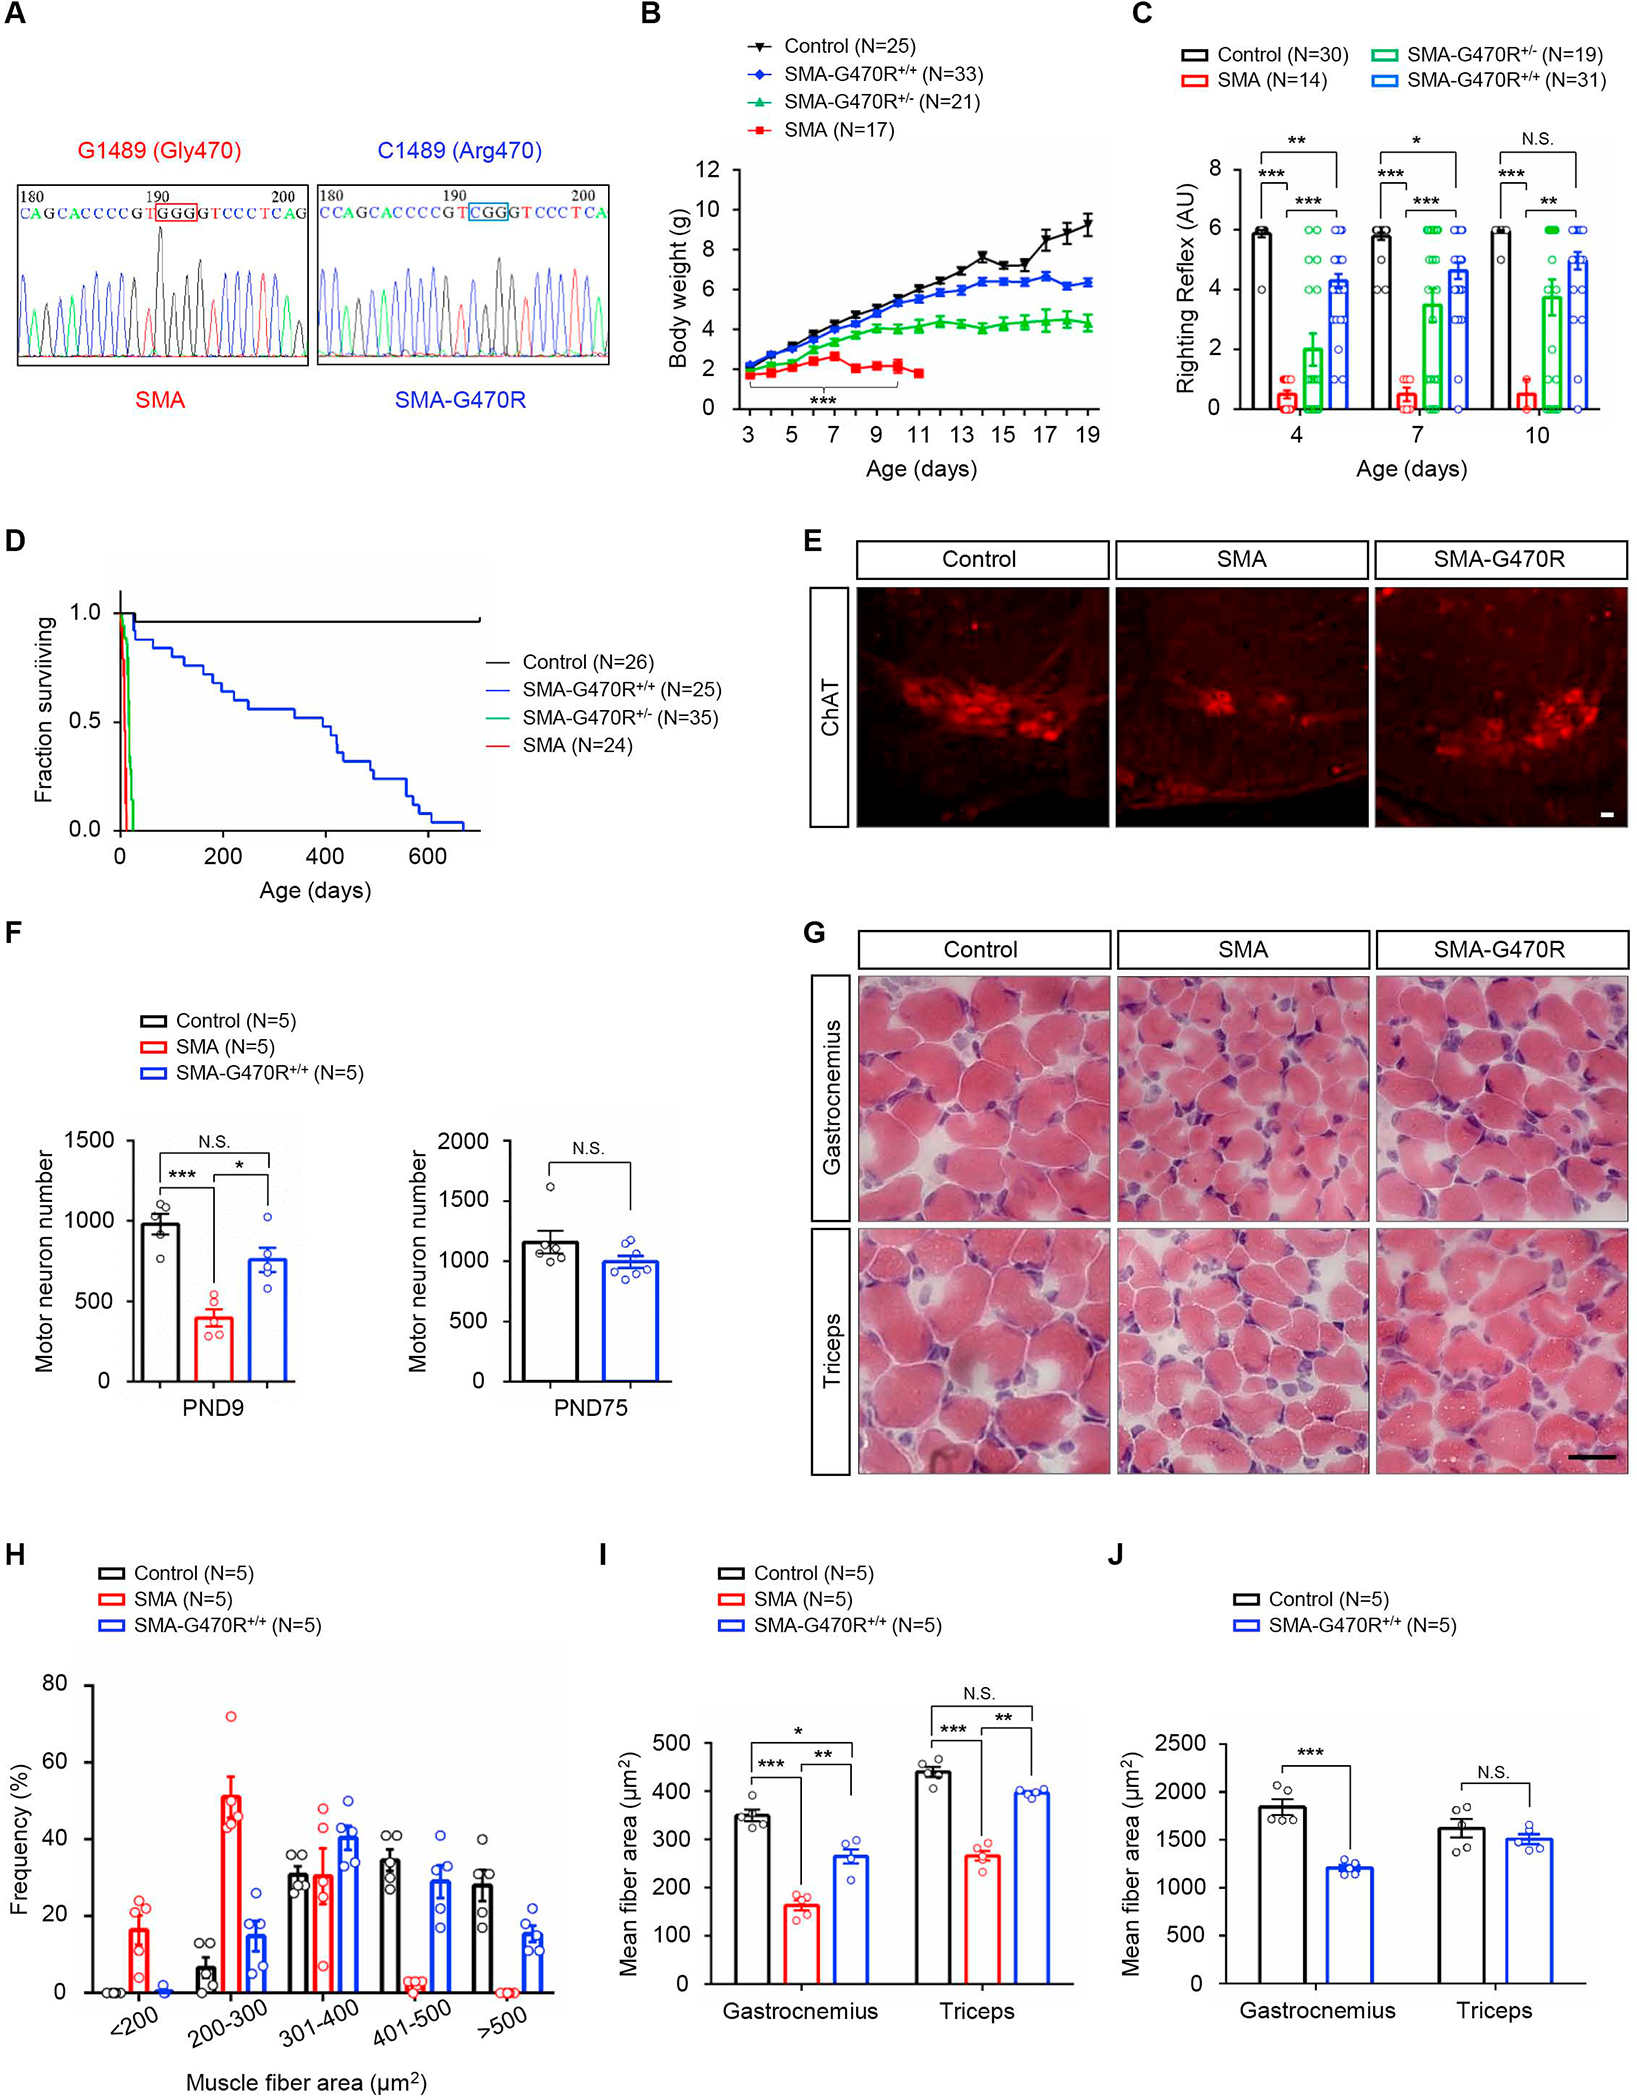
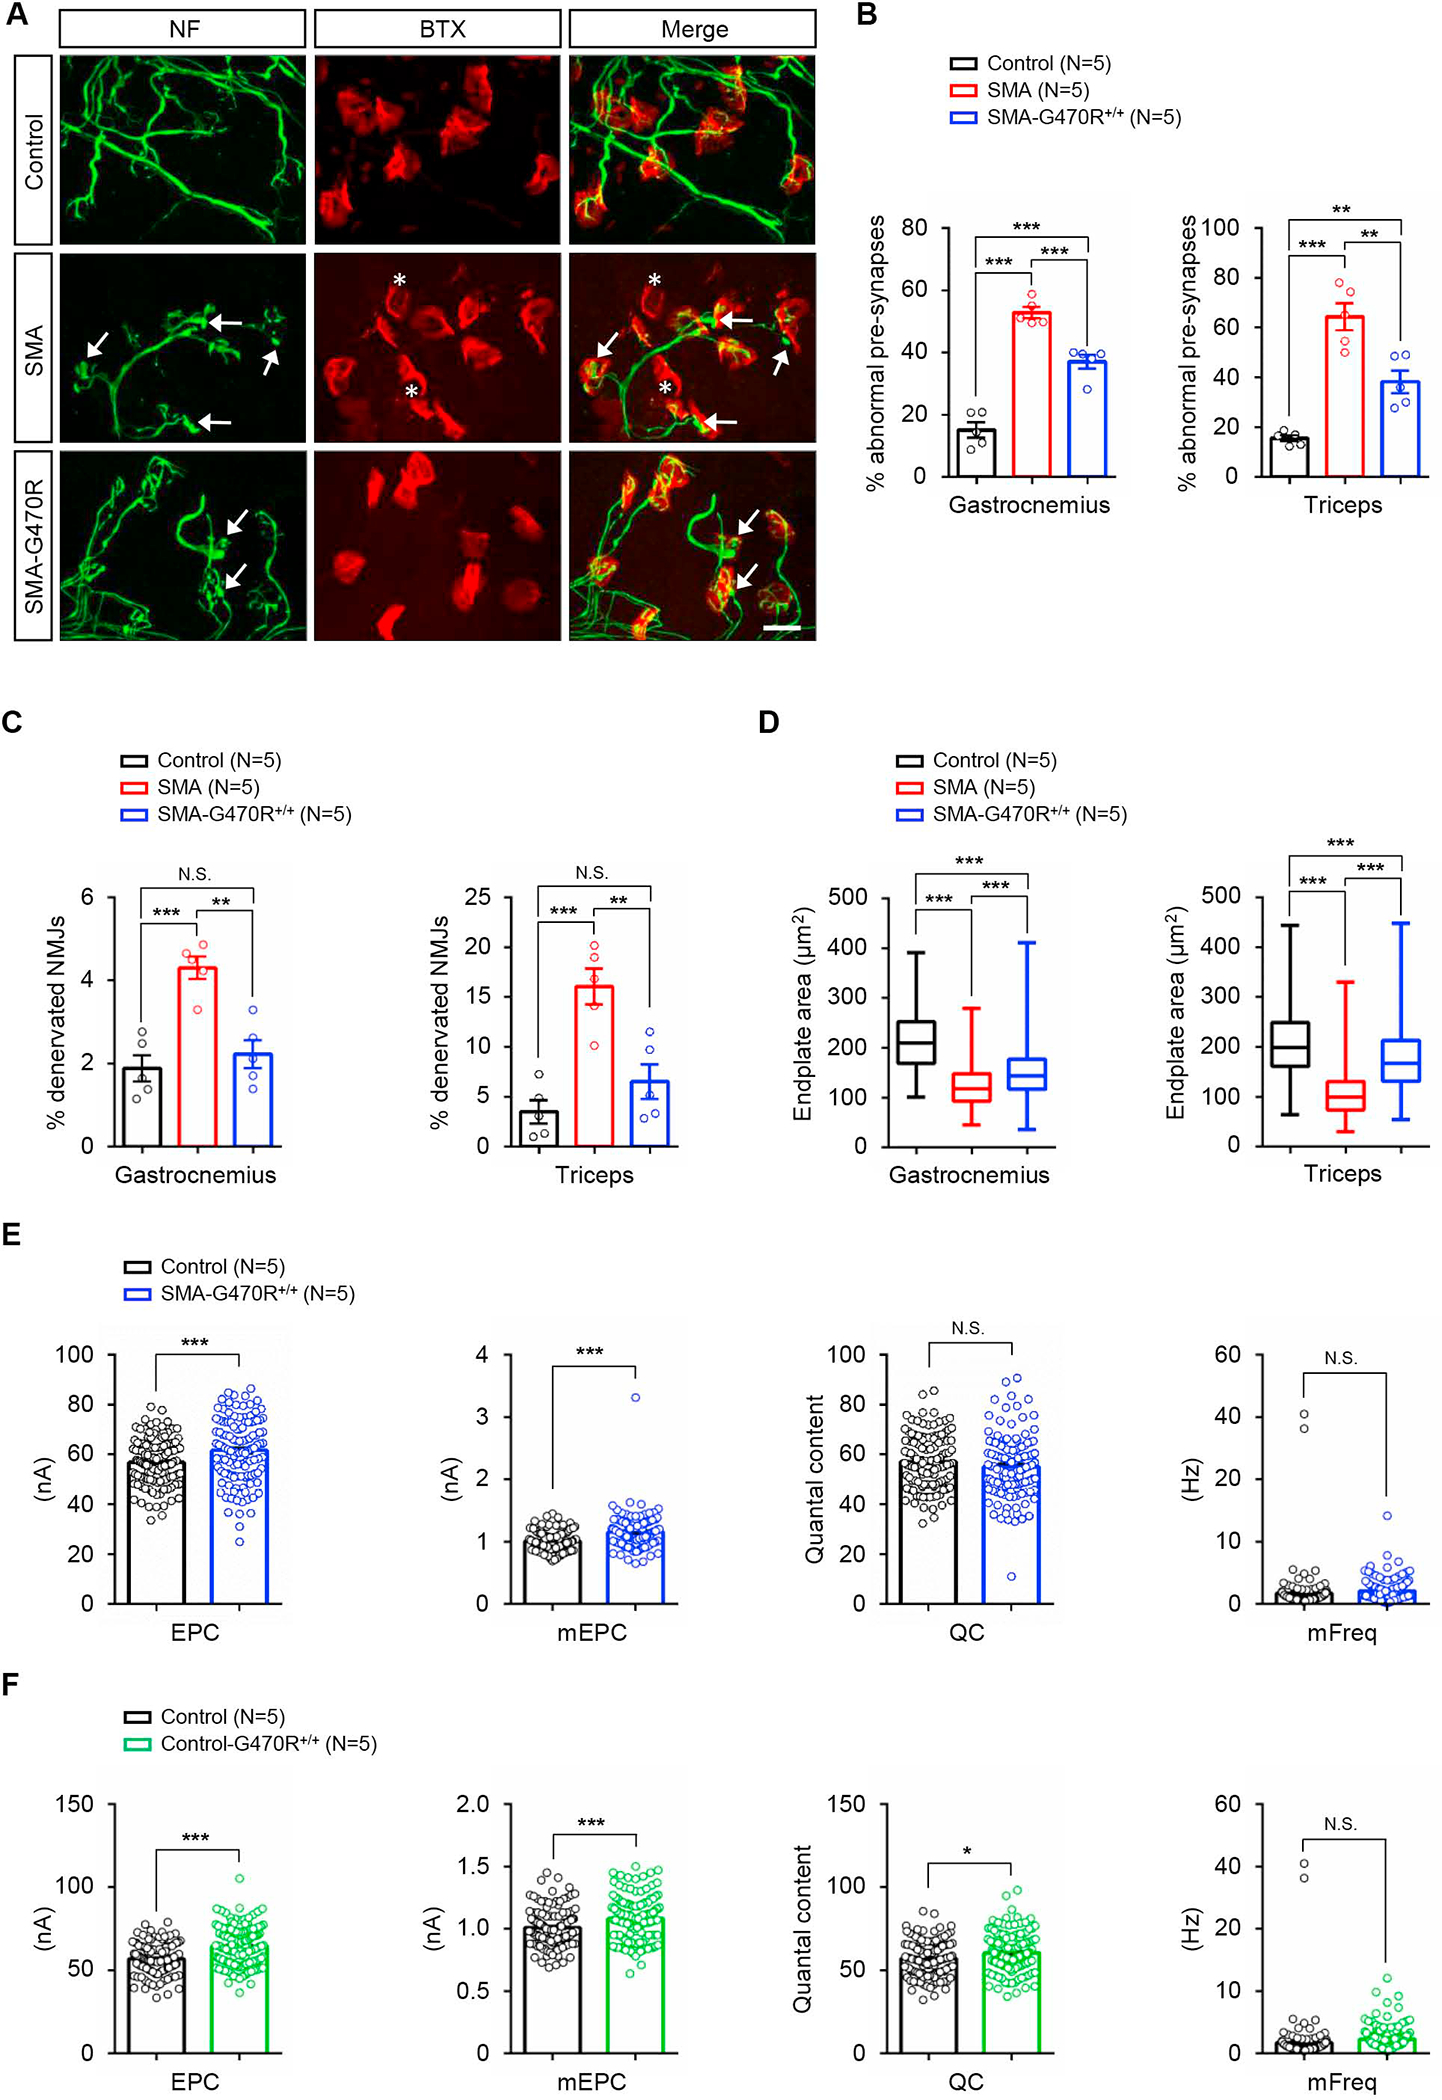
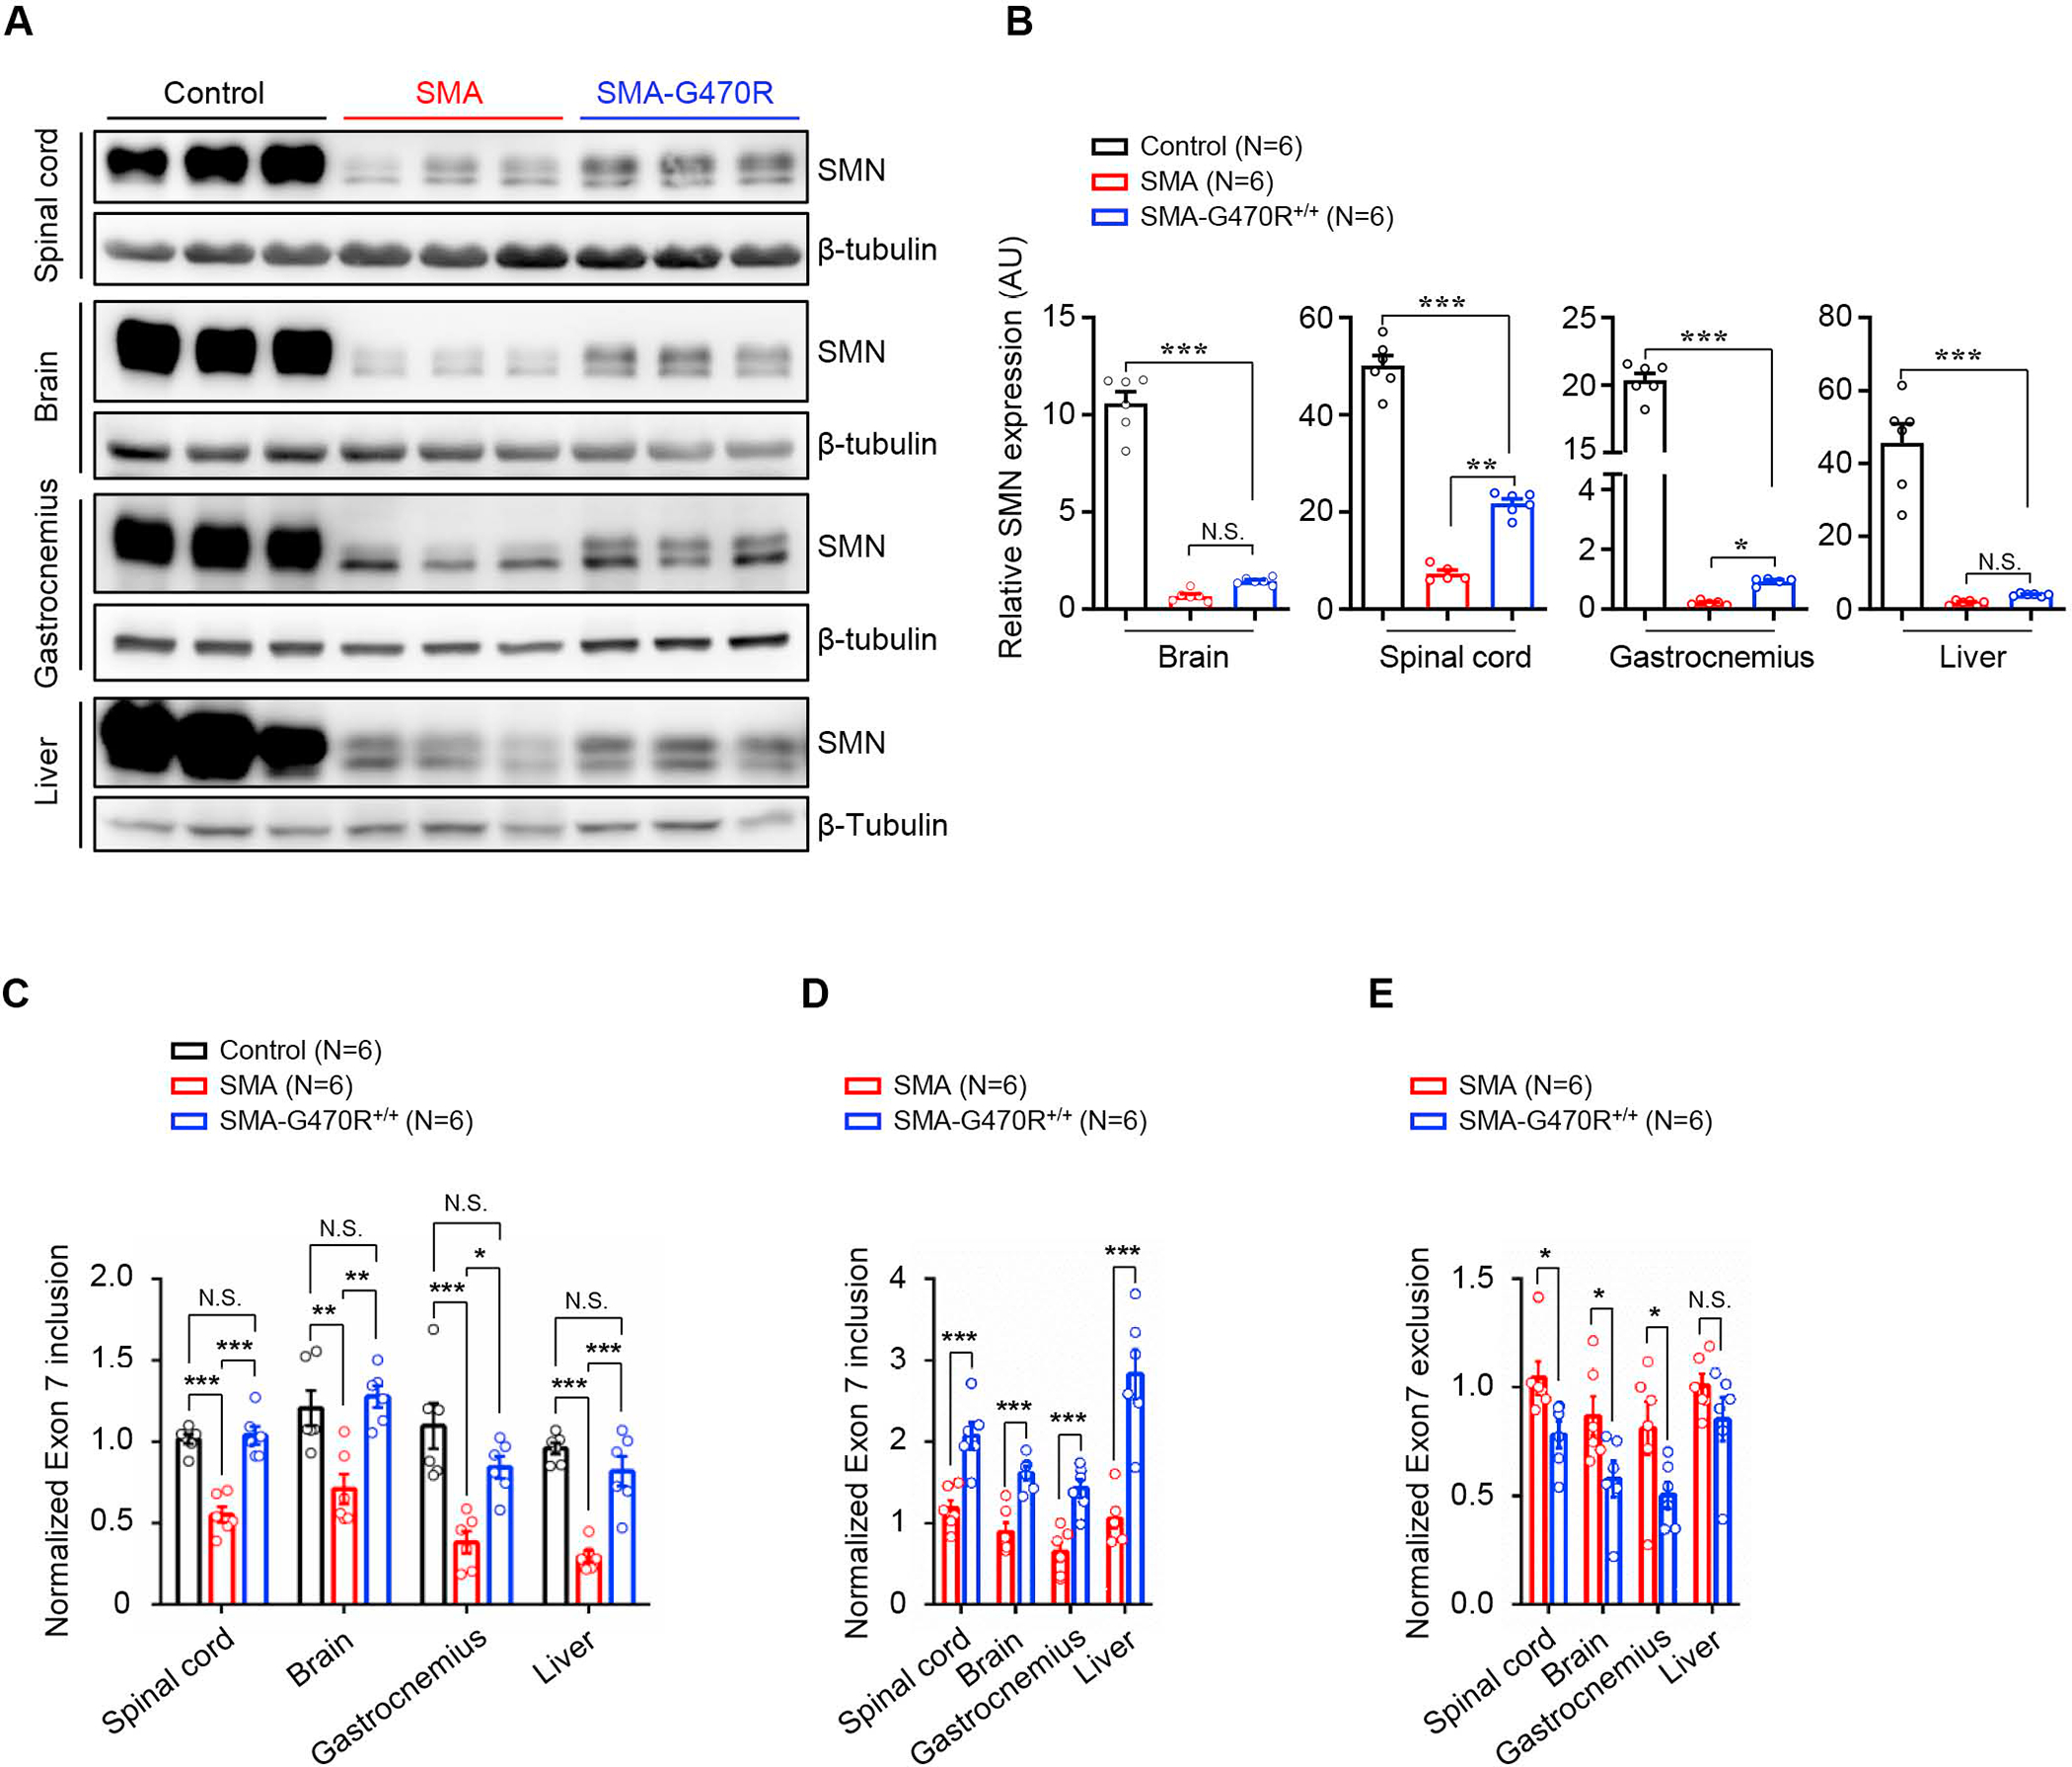
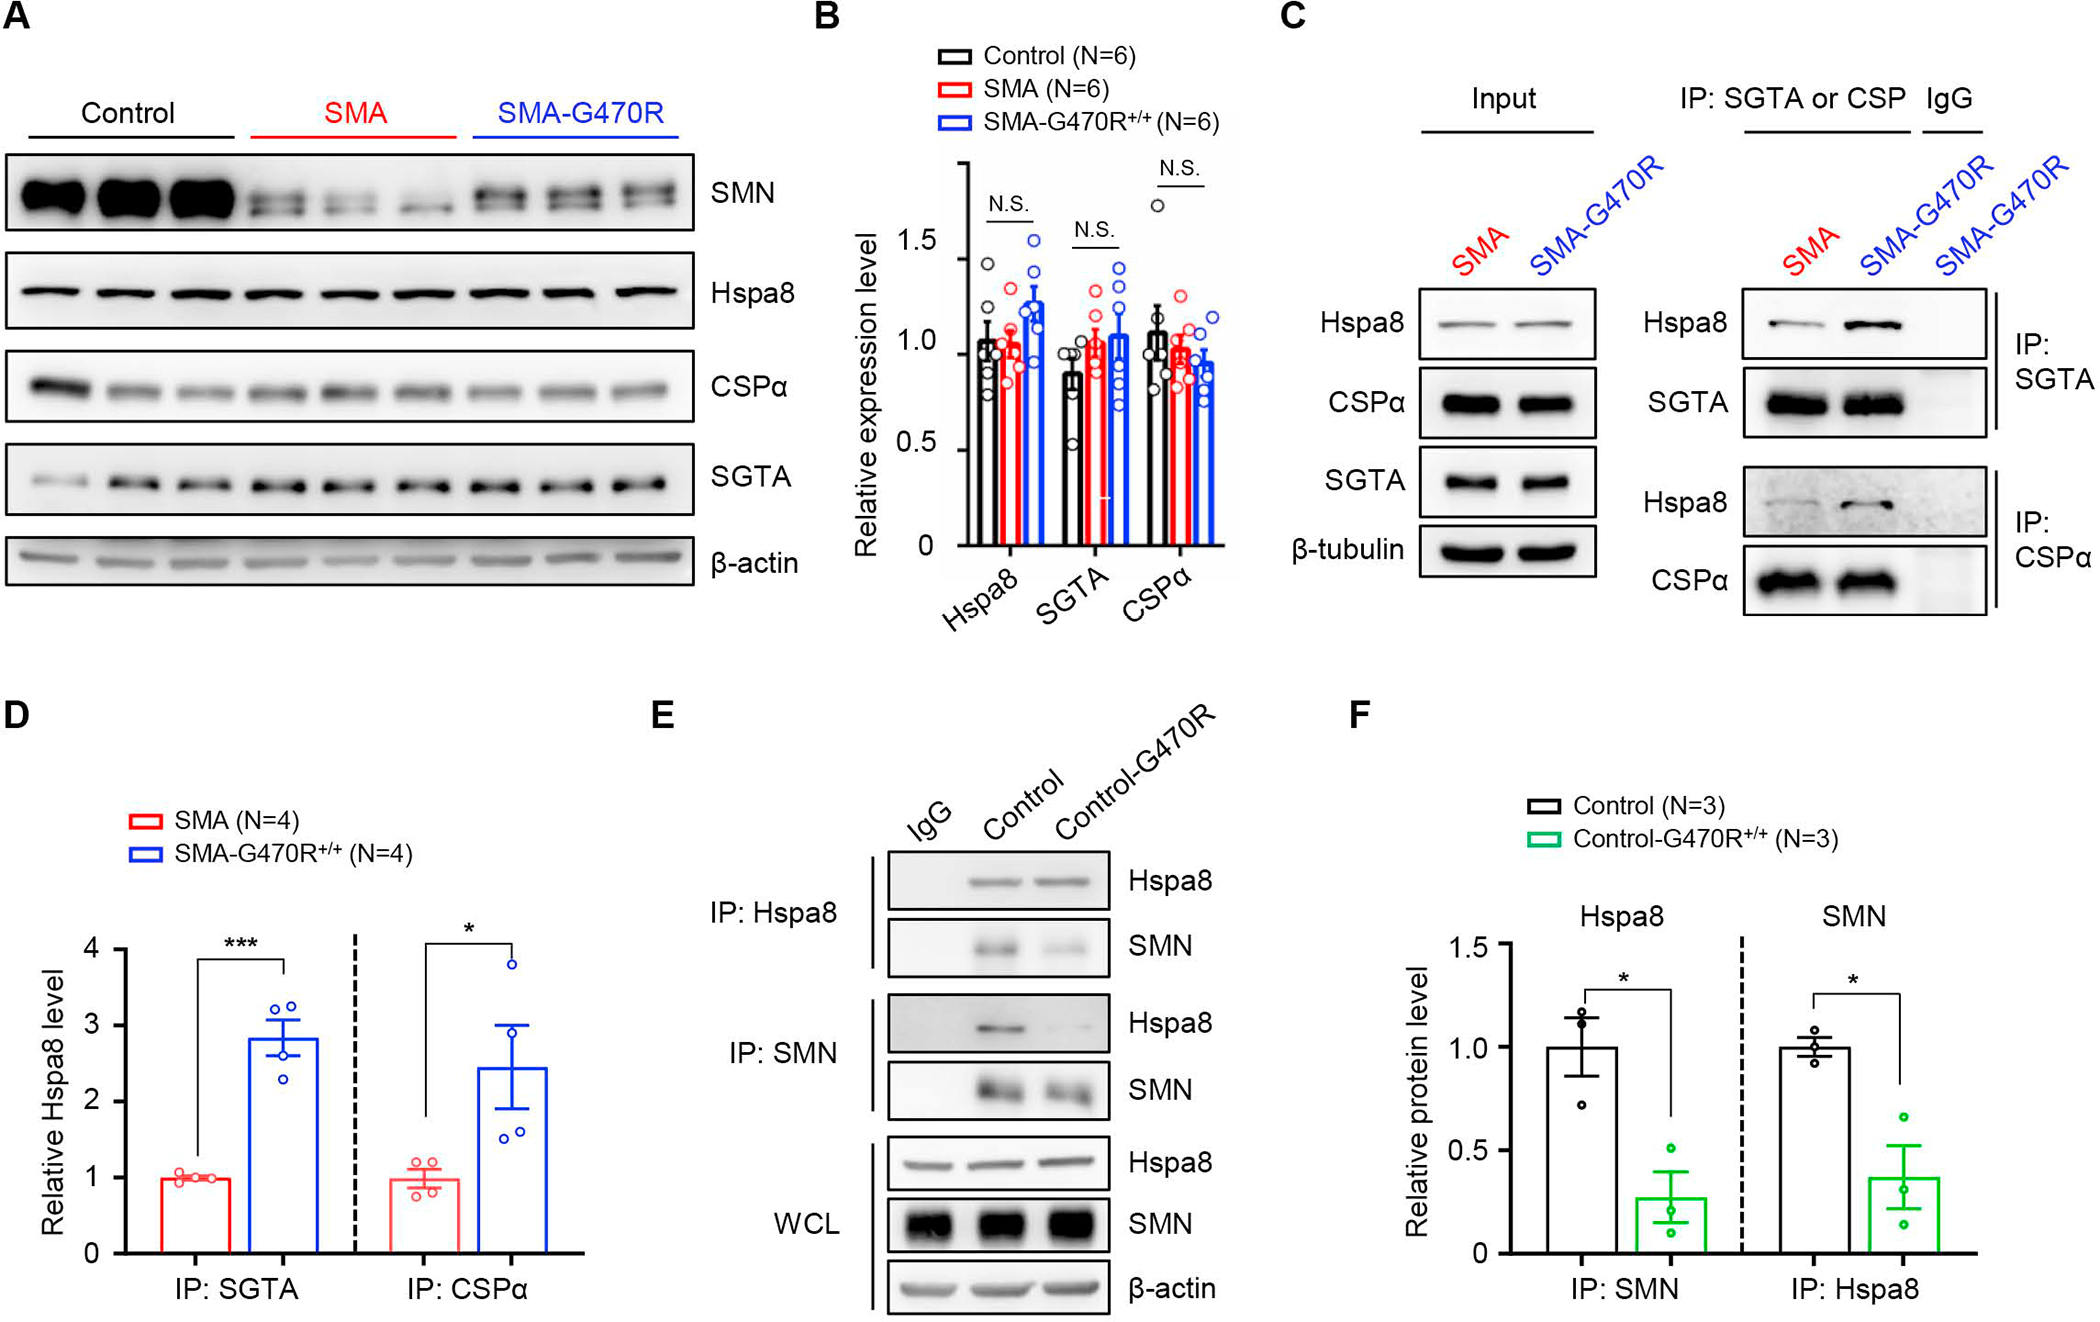
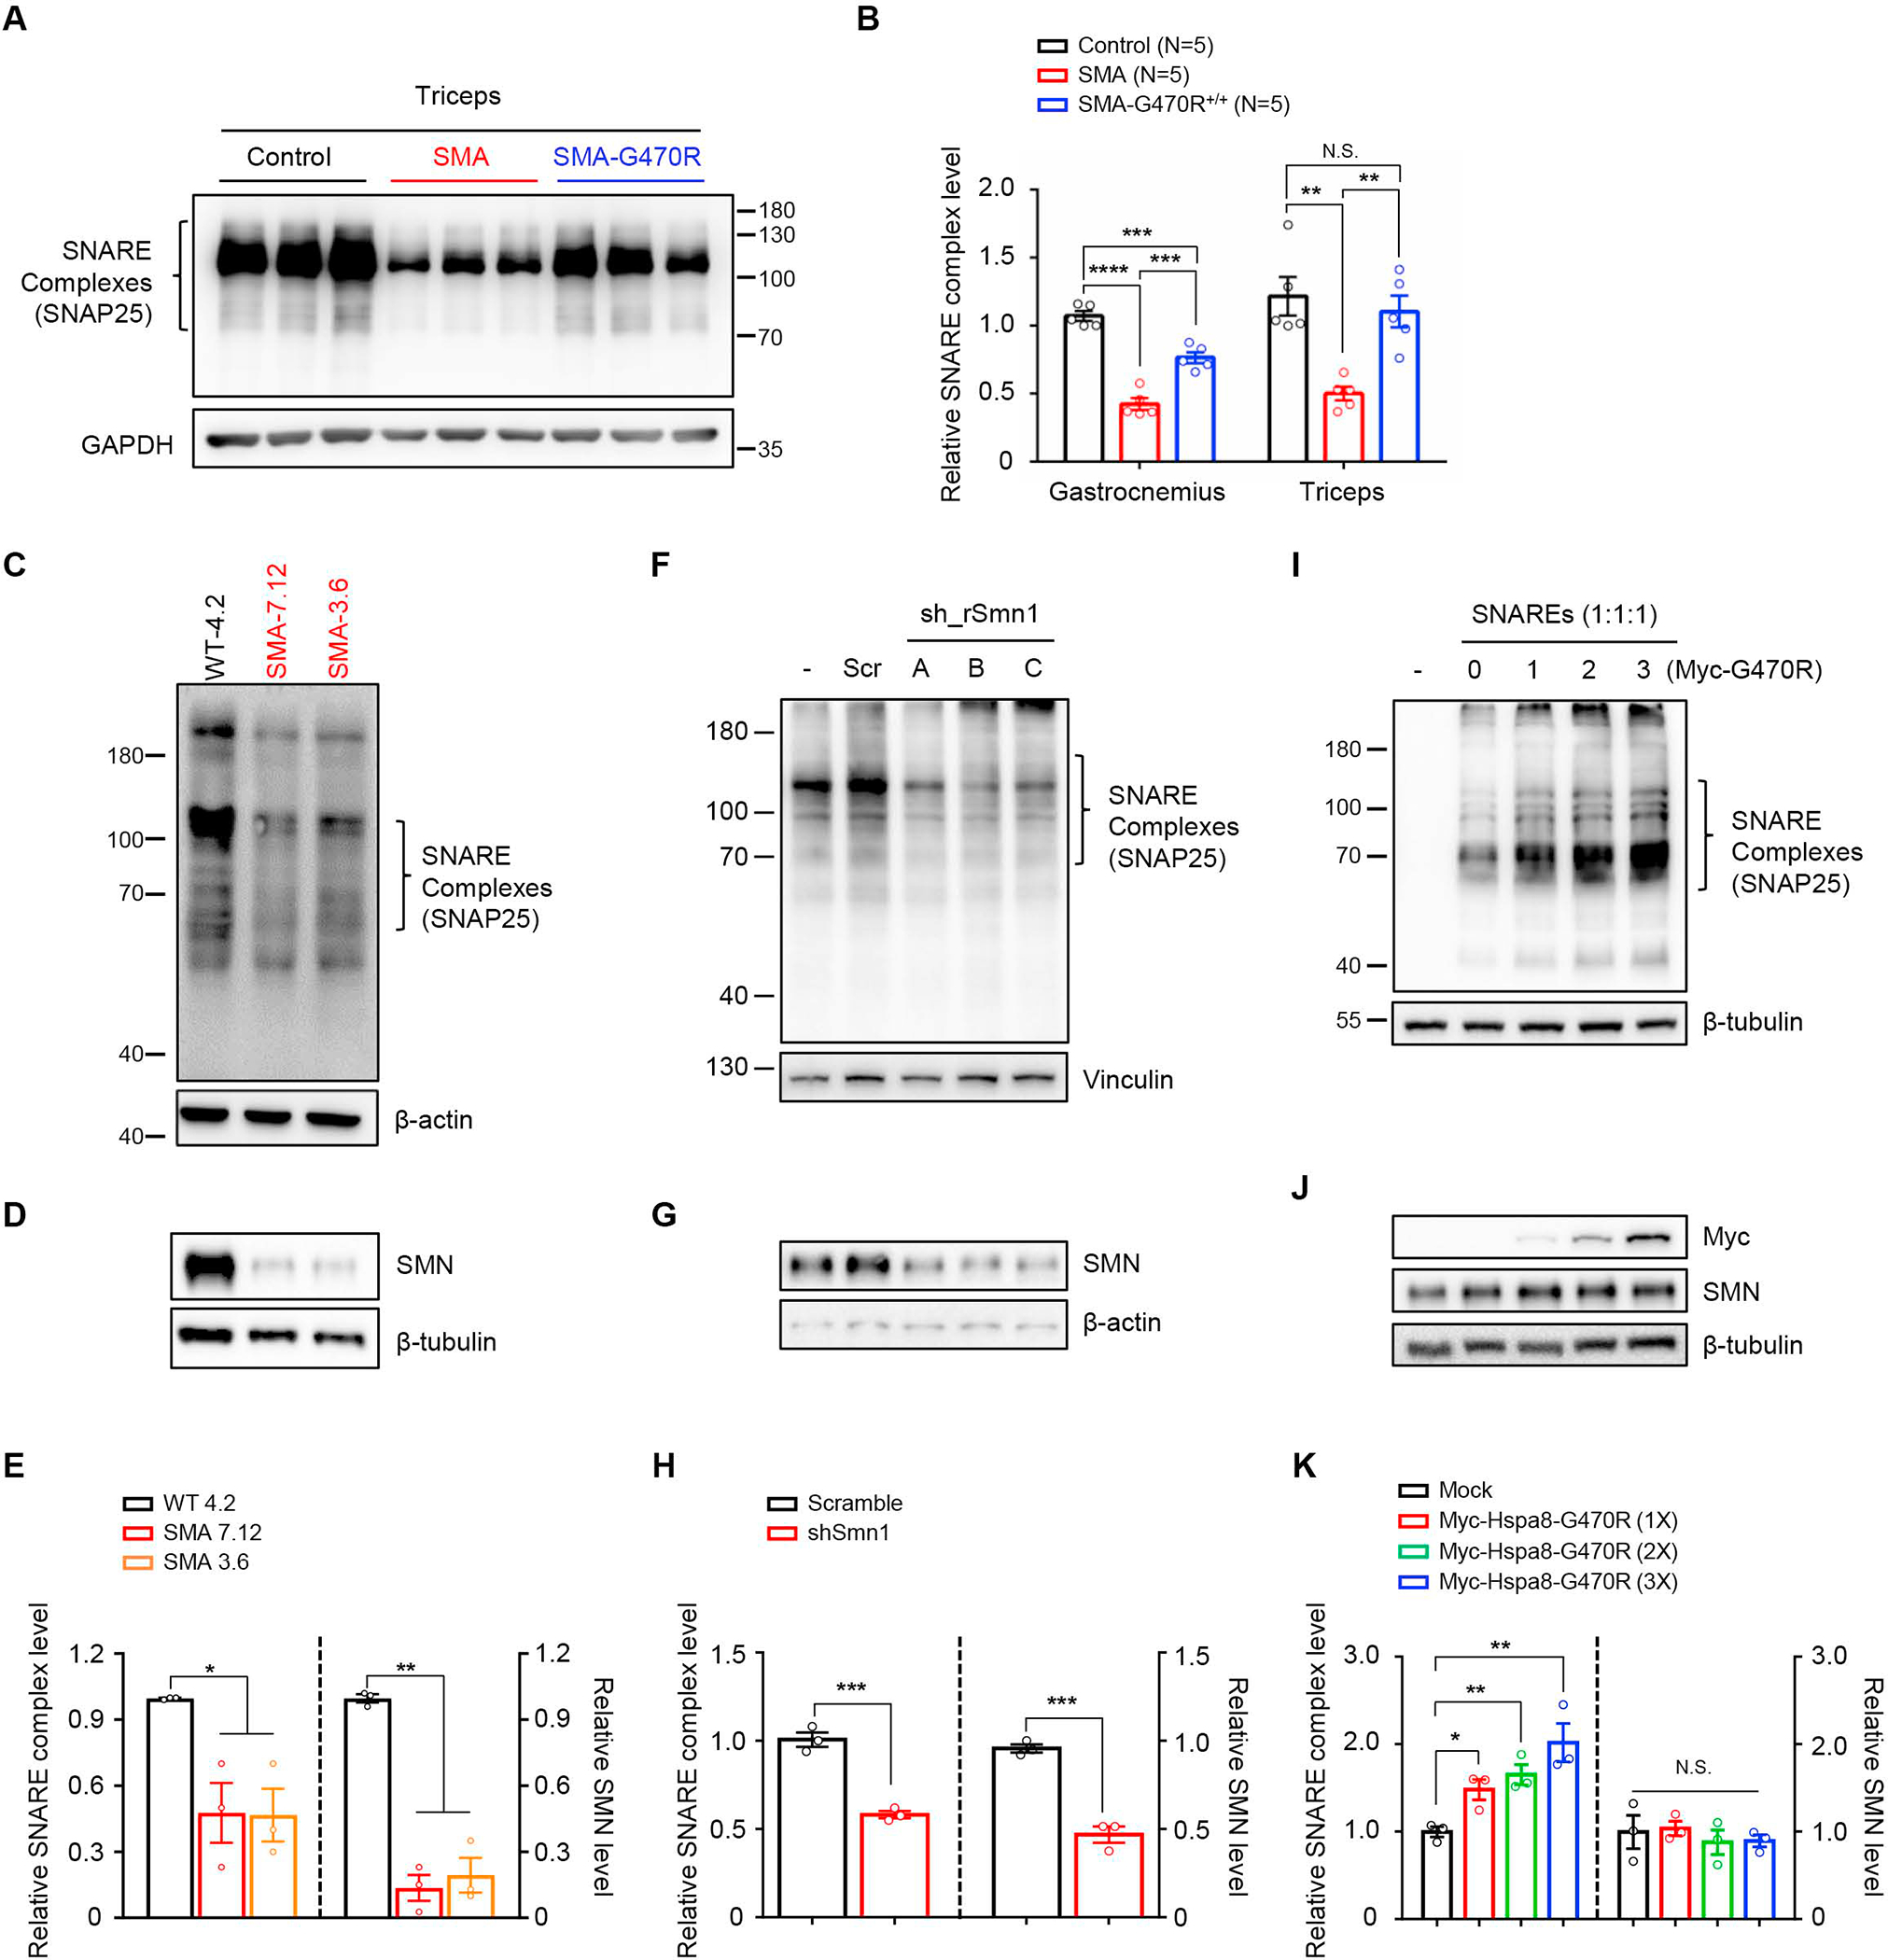
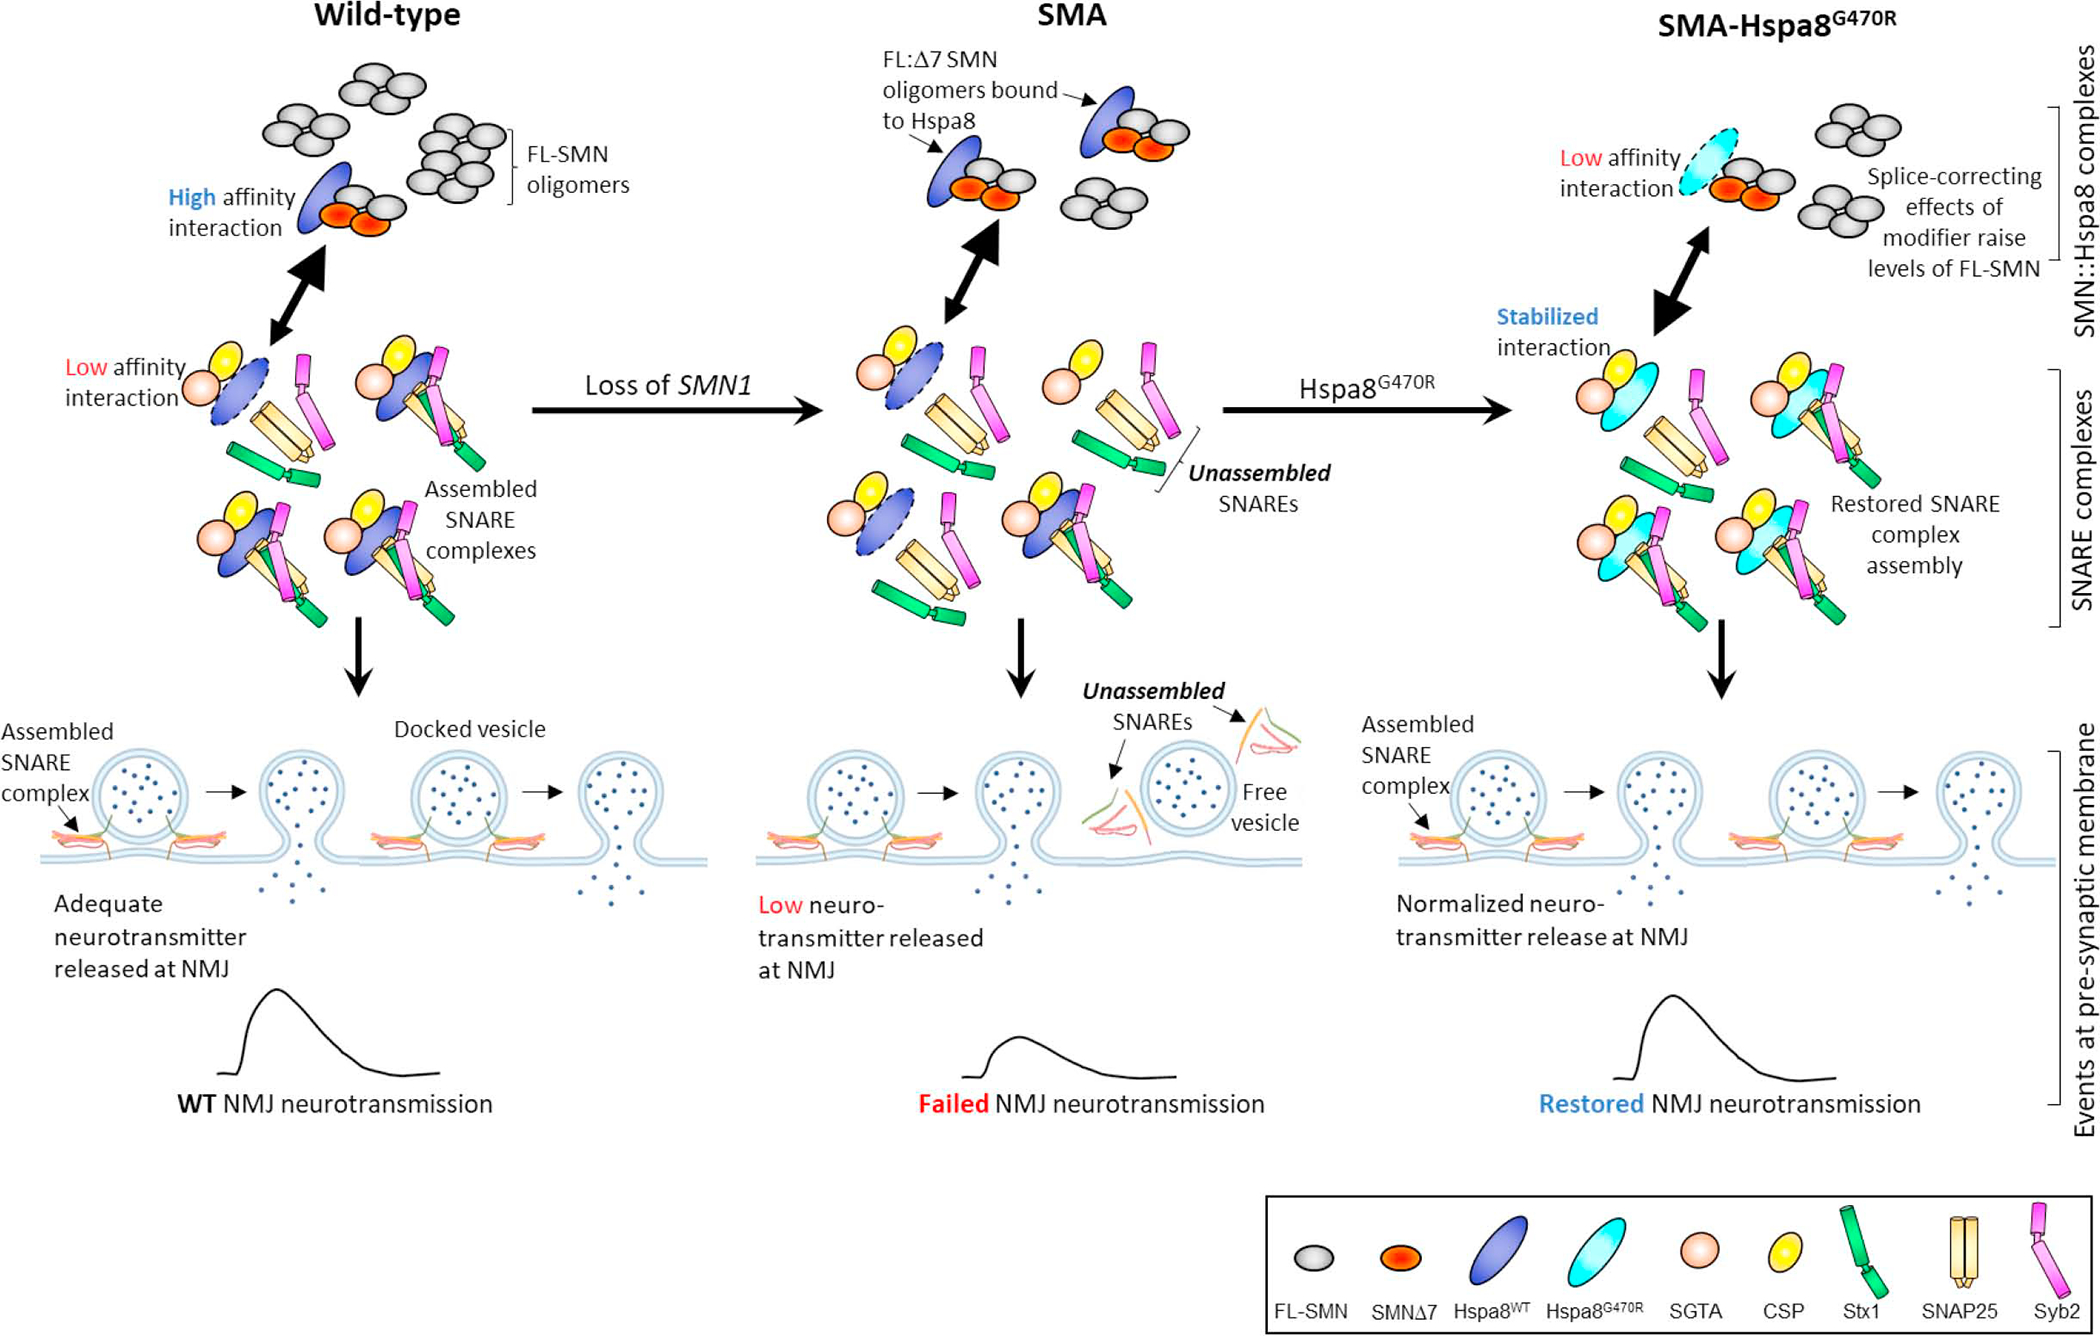
Reduced survival motor neuron (SMN) protein triggers the motor neuron disease, spinal muscular atrophy (SMA). Restoring SMN prevents disease, but it is not known how neuromuscular function is preserved. We used model mice to map and identify an Hspa8G470R synaptic chaperone variant, which suppressed SMA. Expression of the variant in the severely affected mutant mice increased lifespan >10-fold, improved motor performance, and mitigated neuromuscular pathology. Mechanistically, Hspa8G470R altered SMN2 splicing and simultaneously stimulated formation of a tripartite chaperone complex, critical for synaptic homeostasis, by augmenting its interaction with other complex members. Concomitantly, synaptic vesicular SNARE complex formation, which relies on chaperone activity for sustained neuromuscular synaptic transmission, was found perturbed in SMA mice and patient-derived motor neurons and was restored in modified mutants. Identification of the Hspa8G470R SMA modifier implicates SMN in SNARE complex assembly and casts new light on how deficiency of the ubiquitous protein causes motor neuron disease.

Keywords: Hspa8; SNARE complex assembly; modifiers; spinal muscular atrophy; survival motor neuron protein.


Conflict of interest statement

Declaration of interests J.-K.K. and U.R.M. are inventors on a provisional patent application filed by Columbia University on the use of Hspa8 as a means of treating neurodegenerative disease.

Figures

Figure 1.
Figure 1.. Evidence and mapping of a C57BL/6-derived modifier of SMA in model mice.
(A) Kaplan-Meier survival curves depicting altered lifespans of model mice on pure or hybrid strain backgrounds. P < 0.0001 between C57BL/6 and FVB/N mutants, log-rank test. (B) Weight curves of pure and hybrid strain SMA mutants. ***, P < 0.001, PND2 – PND12 between FVB/N and SMA-Mod mutants, t tests. Reduced disease severity in SMA-Mod mutants relative to FVB/N-derived mutants, as assessed by (C) increased lifespans and (D) improved motor performance. Note: P < 0.0001 for panel (C) log-rank test; *, **, ***, P < 0.05, P < 0.01 and P < 0.001 respectively, Kruskal-Wallis test (D). (E) Western blots and quantified results of blots depicting greatly reduced SMN in SMA-Mod mutants. **, ***, P < 0.01 and P < 0.001 respectively, t tests. (F) Diagrammatic representation of the strategy employed to map the SMA modifier to Chr.9. (G) Kaplan-Meier survival curves demonstrating that mutants harboring the C57BL/6-derived Chr.9 ROI are more mildly affected than those homozygous FVB/N for this genomic region. P < 0.0001 between SMA-hom C57BL/6 and SMA-hom FVB/N mutants, log-rank test. SMA-hom C57BL/6 Chr.9 mutants were also less severely affected based on (H) the righting reflex assay and (I) their tendency to gain more weight than their SMA-hom FVB/N Chr.9 counterparts. Note: *, **, P < 0.05 and P < 0.01, Kruskal-Wallis test for panel (H); ***, P < 0.001 between SMA-hom C57BL/6 and SMA-hom FVB/N mutants in panel (I). N.S. – not significant. SMA-Mod – SMN2+/+;SMNΔ7+/+;Hspa8G470R;Smn−/−, Controls – SMN2+/+;SMNΔ7+/+;Smn+/−. Data: mean ± SEM. See also Video S1, Table S1 and Figs. S1–S3.
Figure 2.
Figure 2.. GWAS links an Hspa8 variant to SMA disease suppression.
Graphical representations of (A) the total number of variant SNPs in the modified SMA mice, and (B) those in protein-coding genes. (C) Pie chart of SNPs filtered for P values < 5×10⁻⁸ and predicted for mutational consequences by ANNOVAR. (D) Manhattan plot of highly significant variant SNPs linked to the modified SMA phenotype, emphasizing those clustered in the Chr. 9 ROI; magenta line signifies P = 5×10⁻⁸. (E) Restricted view of the Manhattan Plot depicting the Chr. 9 Hspa8 c.G1408C SNP (id: 9:40804249, exon 7) underlying the Hspa8G470R variant (P = 1.5×10⁻¹⁵). See also Tables S2, S3.
Figure 3.
Figure 3.. Editing of WT Hspa8 to the G470R variant is sufficient to protect against severe SMA.
(A) Sequence chromatograms highlighting the ancestral (GGG) and edited (CGG) codons in Hspa8 from severe and modified SMA mutants. Hspa8G470R-expressing mutants are (B) larger, (C) perform significantly better in a motor performance assay and (D) have markedly longer lifespans than do mutants expressing the WT protein. Note: *, **, ***, P < 0.05, P < 0.01, P < 0.001 respectively; t tests (SMA and SMA-G470R+/+), one-way ANOVA and log-rank test respectively for panels B, C and D. (E) Representative immunostains of lumbar spinal cord sections depicting normal numbers of motor neurons in the SMA-G470R mutant at PND9. (F) Morphometric counts of lumbar motor neurons in SMA and littermate controls. (G) H&E-stained muscle sections from PND9 SMA mutants with or without the G470R variant and a littermate control; myofibers in the SMA-G470R+/+ mouse are larger than those of the SMA mutant. (H) Frequency distributions and (I) average sizes of myofiber in PND9 SMA and littermate controls. (J) Graph of mean myofiber areas in young adult (PND75) SMA-G470R+/+ mutants and littermate controls. Note: *, **, ***, P < 0.05, P < 0.01, P < 0.001 respectively; one-way ANOVA for comparisons at PND9 and t tests for comparisons at PND75 in panels F, I and J. N.S. – not significant. Scale bars: 20μm (panel E), 25μm (panel G). Data: mean ± SEM. See also Fig. S4.
Figure 4.
Figure 4.. NMJ defects in SMA mice are suppressed by the Hspa8G470R variant.
(A) Immunostains of NMJs in the triceps of PND9 controls and SMA mutants with or without Hspa8G470R; the modifier reduces denervation (asterisks) and the incidence of nerve terminals with abnormal NF varicosities (arrows). Scale bar: 20μm. Enumeration of NMJs in the three cohorts of mice displaying (B) nerve terminals abnormally swollen with NF protein and (C) denervated endplates. (D) Graphs depict relative enlargement of endplates in SMA-G470R+/+ versus SMA mutants. Note: **, ***, P < 0.01, P < 0.001, one-way ANOVA (panels B – D). Electrophysiological measures from EDL muscles of (E) PND75 SMA-G470R+/+ mutants and controls and (F) similarly aged controls with or without the variant illustrate the potentiating effect of the modifier on neurotransmission. Note: *, ***, P < 0.05, P < 0.001, t tests, N.S. – not significant. Data: mean ± SEM. See also Fig. S5.
Figure 5.
Figure 5.. Hspa8G470R alters SMN2 splicing and modestly raises SMN levels.
(A) Western blots of SMN protein in PND9 controls and SMA mutants with or without the G470R modifier and (B) quantified results of the blots in the three cohorts of mice. (C) Analysis of FL-SMN transcript levels by Q-PCR at PND9 in the three cohorts of mice. Two-way comparisons of (D) FL-SMN transcript levels and (E) the SMNΔ7 isoform in the two sets of SMA mutants illustrate an increase in the intact transcript and a corresponding drop in the truncated form. Note: *, **, ***, P < 0.05, P < 0.01, P < 0.001 respectively, one-way ANOVA (panels B and C), t tests, panels (D and E). Data: mean ± SEM. See also Figs. S5, S6.
Figure 6.
Figure 6.. An enhanced affinity of Hspa8G470R for synaptic co-chaperone proteins.
(A) Western blot analysis depicting equivalent levels of Hspa8 and other constituent members of a synaptic chaperone complex in PND9 brain tissue of controls and SMA mutants expressing WT or the G470R Hspa8 variant. (B) Quantified results of blot; N.S. – not significant, one-way ANOVA. (C) Co-immunoprecipitation (co-IP) analysis of relative affinities of WT Hspa8 or the G470R variant for its co-chaperones, SGTA and CSPα; the variant binds better to SGTA and CSPα. (D) Graph depicting the affinities of Hspa8WT and Hspa8G470R for their interacting partners. (E) Reciprocal co-IP analysis of brain-derived Hspa8 and SMN illustrates that the two interact and that there is weakened affinity of the G470R variant for SMN. (F) Quantification of relative affinities of WT Hspa8 or the G470R variant for SMN. Note: *, ***, P < 0.05, P < 0.001 respectively, t tests for analyses in panels D and F; brain lysates from PND9 mice were used for co-IP experiments. Data: mean ± SEM. See also Fig. S7.
Figure 7.
Figure 7.. SNARE complex assembly is disrupted in SMA NMJs and restored by the Hspa8G470R variant.
(A) Representative immunoblot, probed for SNAP25, illustrating reduced high molecular weight SDS-resistant SNARE complexes in PND9 SMA NMJs derived from triceps; complex levels are restored in SMA-G470R mutants. Note: Samples were not boiled. (B) Quantified SNARE complex levels in triceps and gastrocnemius muscles of PND9 controls and SMA mutants with or without the G470R variant. Note: **, ***, P < 0.01, P < 0.001 respectively, one-way ANOVA. N.S. – not significant. (C) Representative immunoblot depicting reduced SNARE complexes in two iPSC-derived motor neuron lines from severe SMA patients; samples were not boiled. (D) Western blot analysis of boiled samples from panel c confirm low levels of SMN in the SMA lines. (E) Graph showing relative SNARE complex concentrations and SMN levels in panels C and D respectively. (F) Reduced SNARE complex assembly is observed in the immunoblot of samples from PC-12 cells expressing shRNAs against SMN; samples were not boiled. (G) Western blot analysis of boiled samples from panel F confirm low levels of SMN in shRNA-mediated knockdown lines. (H) Quantified SNARE complex and SMN levels in samples analyzed for study depicted in panels F and G. Note: ***, P < 0.001, respectively, t tests for analysis of data in panel (H). (I) Immunoblot depicting effect of raising Hspa8G470R levels (from a plasmid) on SNARE complex formation in HEK293 cells transfected with the core SNARE components; samples were not boiled. (J) Western blot analysis of boiled samples from panel (I) showing relatively stable levels of SMN notwithstanding increasing concentrations of Myc-Hspa8G470R, as detected with anti-myc antibody. (K)Quantified levels of SNARE complexes and SMN respectively in panels I and J. Note: *, **, P < 0.05, P < 0.01, respectively, one-way ANOVA. N.S. – not significant. Data: mean ± SEM. See also Figs. S8, S9.
Figure 8.
Figure 8.. Modulation of SNARE complex assembly by SMN and the G470R variant of Hspa8.
Depicted is a hypothetical model that encapsulates the relationship between SNARE complex assembly, SMN and the Hspa8G470R SMA modifier at NMJs. In the WT state, the preponderance of SMN exists as intact (FL), stable oligomeric complexes, SMNΔ7 isoforms being excluded from the complexes. Consequently, relatively little Hspa8 is required for SMN turnover in synapses. Hspa8 is therefore free to engage with its synaptic co-chaperones, CSPα and SGTA, notwithstanding a potentially weak affinity for these proteins. Still, this ensures proper SNARE complex assembly and efficient neurotransmission. In the absence of SMN1 (SMA), total FL-SMN levels fall and relative concentrations of oligomers of the protein containing the unstable SMNΔ7 species and proteins such as NF rise. Hspa8 is diverted away from the tripartite chaperone complex to effect turnover of dysregulated proteins such as the less stable FL-SMN:SMNΔ7 hybrid oligomeric complexes. Consequently, repeated cycles of SNARE complex assembly are disrupted. The G470R variant reverses this effect by stabilizing the interaction of Hspa8 with its co-chaperones and concomitantly weakening its association with SMN and perhaps other clients too. SNARE complex assembly is thus restored. A weak, SMN2 splice-switching property inherent in Hspa8G470R modestly raises levels of the intact SMN and combines with the effect of the variant on assembling SNAREs to potently suppress the SMA phenotype. Note: Larger arrowheads in double-headed arrows signify direction of preferred interaction.

Comment in

References

    1. Coovert DD, Le TT, McAndrew PE, Strasswimmer J, Crawford TO, Mendell JR, Coulson SE, Androphy EJ, Prior TW, and Burghes AH (1997). The survival motor neuron protein in spinal muscular atrophy. Hum Mol Genet 6, 1205–1214. 10.1093/hmg/6.8.1205. - DOI - PubMed
    1. Lefebvre S, Burglen L, Reboullet S, Clermont O, Burlet P, Viollet L, Benichou B, Cruaud C, Millasseau P, Zeviani M, and et al. (1995). Identification and characterization of a spinal muscular atrophy-determining gene. Cell 80, 155–165. 10.1016/0092-8674(95)90460-3. - DOI - PubMed
    1. Lefebvre S, Burlet P, Liu Q, Bertrandy S, Clermont O, Munnich A, Dreyfuss G, and Melki J (1997). Correlation between severity and SMN protein level in spinal muscular atrophy. Nat Genet 16, 265–269. 10.1038/ng0797-265. - DOI - PubMed
    1. Lorson CL, Hahnen E, Androphy EJ, and Wirth B (1999). A single nucleotide in the SMN gene regulates splicing and is responsible for spinal muscular atrophy. Proc Natl Acad Sci U S A 96, 6307–6311. 10.1073/pnas.96.11.6307. - DOI - PMC - PubMed
    1. Monani UR, Lorson CL, Parsons DW, Prior TW, Androphy EJ, Burghes AH, and McPherson JD (1999). A single nucleotide difference that alters splicing patterns distinguishes the SMA gene SMN1 from the copy gene SMN2. Hum Mol Genet 8, 1177–1183. 10.1093/hmg/8.7.1177. - DOI - PubMed

Publication types

MeSH terms

Substances