. 2023 Mar 10;4(3):191-215.e9.
doi: 10.1016/j.medj.2023.02.004. Epub 2023 Feb 16.

Evolution of long-term vaccine-induced and hybrid immunity in healthcare workers after different COVID-19 vaccine regimens

Shona C Moore  1 Barbara Kronsteiner  2 Stephanie Longet  3 Sandra Adele  2 Alexandra S Deeks  4 Chang Liu  5 Wanwisa Dejnirattisai  6 Laura Silva Reyes  7 Naomi Meardon  8 Sian Faustini  9 Saly Al-Taei  9 Tom Tipton  3 Luisa M Hering  1 Adrienn Angyal  10 Rebecca Brown  10 Alexander R Nicols  11 Susan L Dobson  1 Piyada Supasa  12 Aekkachai Tuekprakhon  12 Andrew Cross  13 Jessica K Tyerman  11 Hailey Hornsby  10 Irina Grouneva  10 Megan Plowright  14 Peijun Zhang  10 Thomas A H Newman  14 Jeremy M Nell  15 Priyanka Abraham  2 Mohammad Ali  2 Tom Malone  16 Isabel Neale  2 Eloise Phillips  16 Joseph D Wilson  17 Sam M Murray  16 Martha Zewdie  16 Adrian Shields  18 Emily C Horner  19 Lucy H Booth  19 Lizzie Stafford  12 Sagida Bibi  7 Daniel G Wootton  20 Alexander J Mentzer  21 Christopher P Conlon  22 Katie Jeffery  23 Philippa C Matthews  24 Andrew J Pollard  25 Anthony Brown  16 Sarah L Rowland-Jones  14 Juthathip Mongkolsapaya  5 Rebecca P Payne  11 Christina Dold  26 Teresa Lambe  27 James E D Thaventhiran  19 Gavin Screaton  5 Eleanor Barnes  28 Susan Hopkins  29 Victoria Hall  30 Christopher J A Duncan  31 Alex Richter  18 Miles Carroll  3 Thushan I de Silva  14 Paul Klenerman  32 Susanna Dunachie  33 Lance Turtle  34 PITCH Consortium
Affiliations

Evolution of long-term vaccine-induced and hybrid immunity in healthcare workers after different COVID-19 vaccine regimens

Shona C Moore et al. Med. .

Abstract

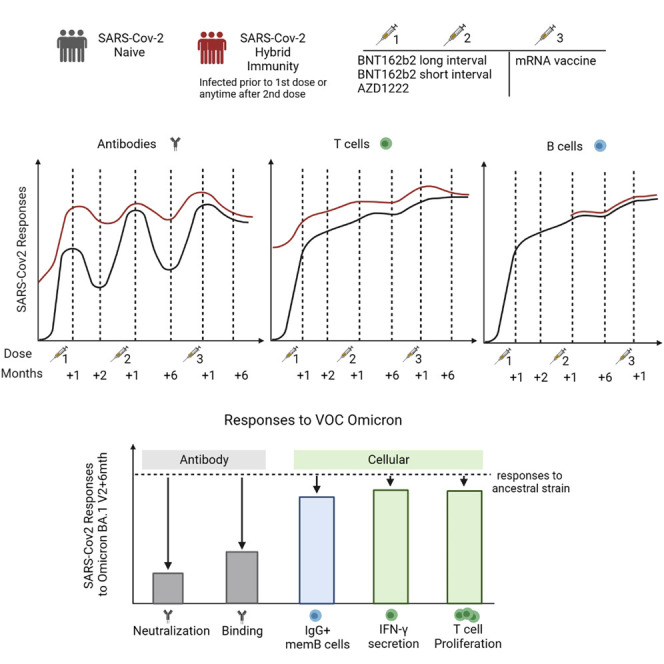
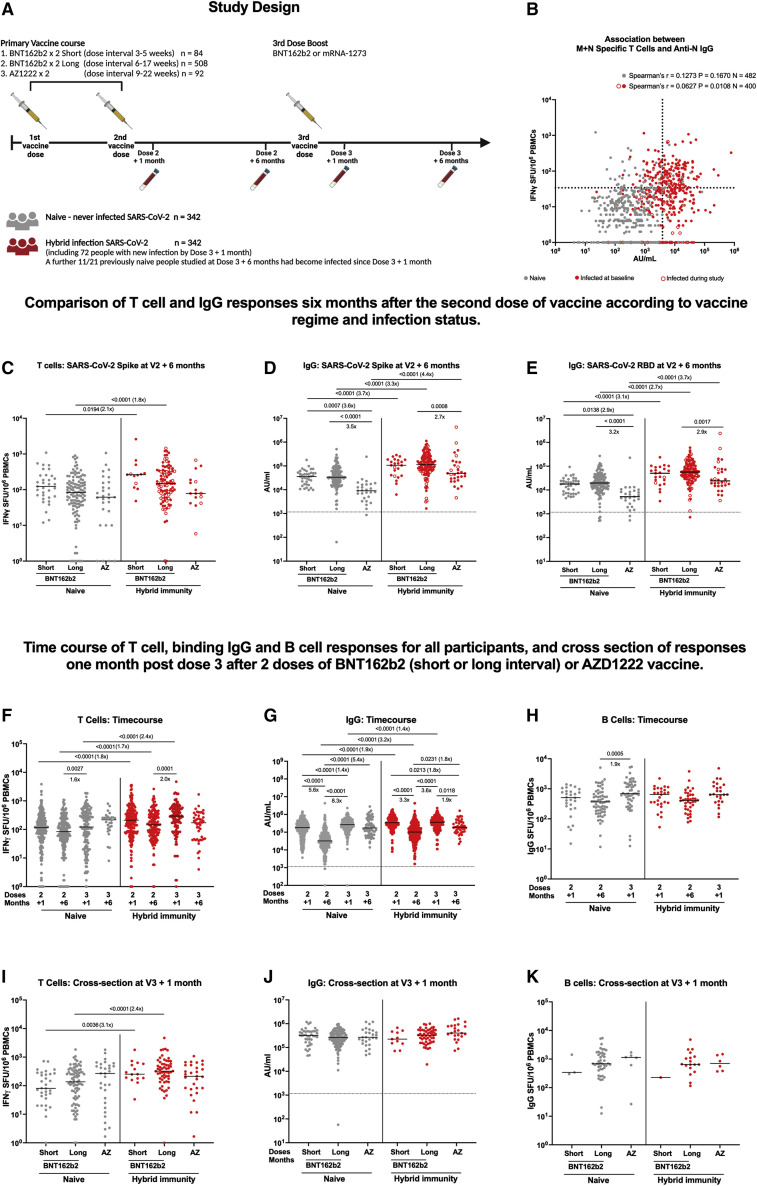
Background: Both infection and vaccination, alone or in combination, generate antibody and T cell responses against severe acute respiratory syndrome coronavirus 2 (SARS-CoV-2). However, the maintenance of such responses-and hence protection from disease-requires careful characterization. In a large prospective study of UK healthcare workers (HCWs) (Protective Immunity from T Cells in Healthcare Workers [PITCH], within the larger SARS-CoV-2 Immunity and Reinfection Evaluation [SIREN] study), we previously observed that prior infection strongly affected subsequent cellular and humoral immunity induced after long and short dosing intervals of BNT162b2 (Pfizer/BioNTech) vaccination.

Methods: Here, we report longer follow-up of 684 HCWs in this cohort over 6-9 months following two doses of BNT162b2 or AZD1222 (Oxford/AstraZeneca) vaccination and up to 6 months following a subsequent mRNA booster vaccination.

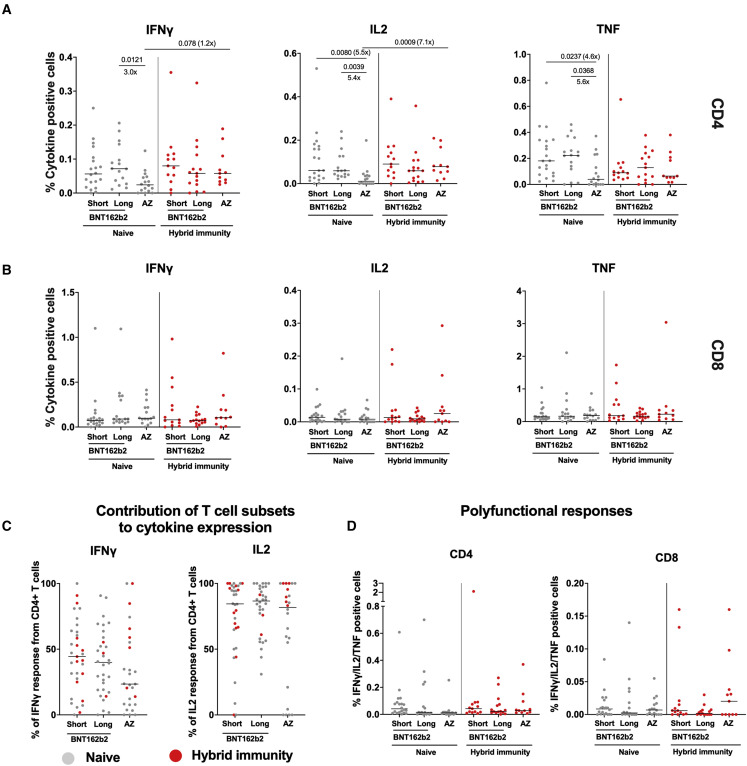
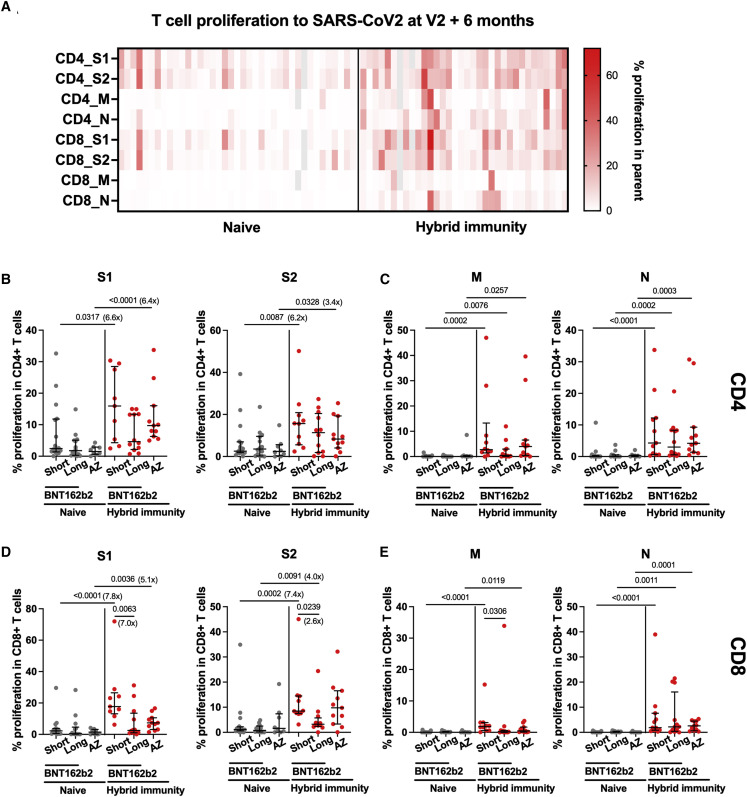
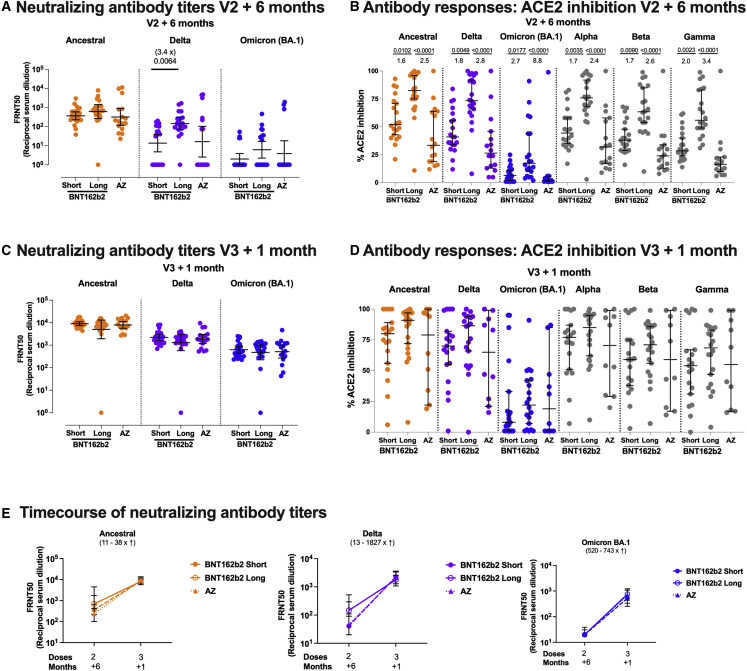
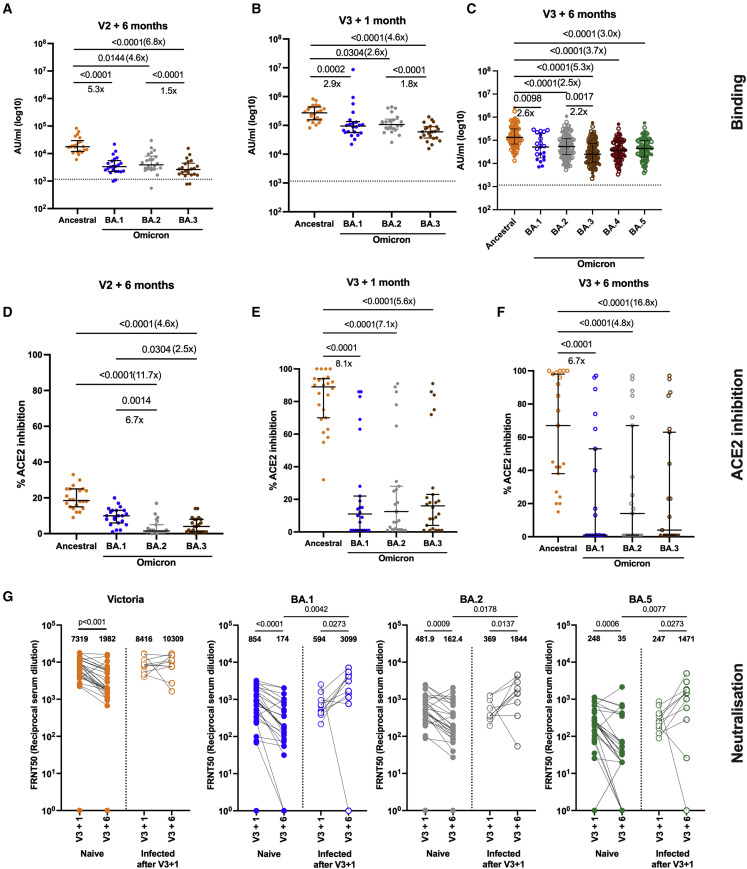
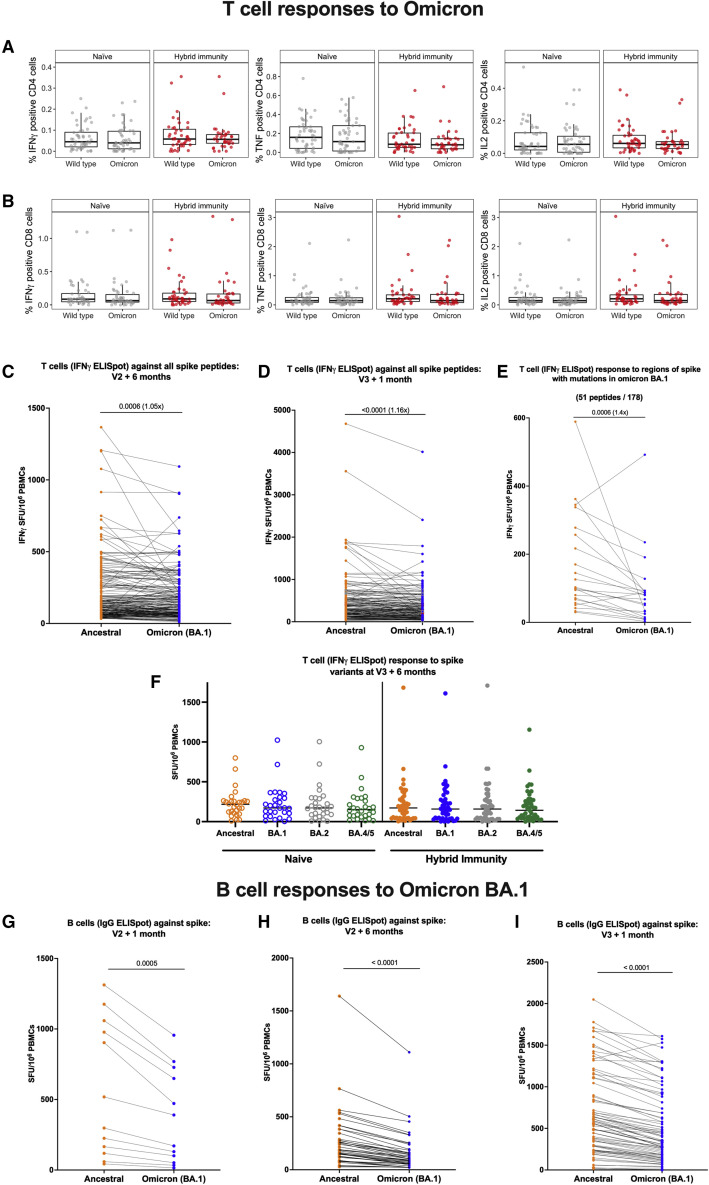
Findings: We make three observations: first, the dynamics of humoral and cellular responses differ; binding and neutralizing antibodies declined, whereas T and memory B cell responses were maintained after the second vaccine dose. Second, vaccine boosting restored immunoglobulin (Ig) G levels; broadened neutralizing activity against variants of concern, including Omicron BA.1, BA.2, and BA.5; and boosted T cell responses above the 6-month level after dose 2. Third, prior infection maintained its impact driving larger and broader T cell responses compared with never-infected people, a feature maintained until 6 months after the third dose.

Conclusions: Broadly cross-reactive T cell responses are well maintained over time-especially in those with combined vaccine and infection-induced immunity ("hybrid" immunity)-and may contribute to continued protection against severe disease.

Funding: Department for Health and Social Care, Medical Research Council.

Keywords: COVID vaccine; COVID-19; SARS-CoV-2; T cells; Translation to population health; antibody; immunity.


Conflict of interest statement

Declaration of interests S.J.D. is a Scientific Advisor to the Scottish Parliament on COVID-19, for which she receives a fee. A.J.P. is Chair of UK Department of Health and Social Care’s (DHSC) Joint Committee on Vaccination and Immunisation (JCVI) but does not participate in policy decisions on COVID-19 vaccines. He was previously a member of the WHO’s SAGE. The views expressed in this article do not necessarily represent the views of DHSC, JCVI, or WHO. A.J.P. is chief investigator on clinical trials of Oxford University’s COVID-19 vaccine funded by NIHR. Oxford University has entered a joint COVID-19 vaccine development partnership with AstraZeneca. G.S. sits on the GSK Vaccines Scientific Advisory Board and is a founder member of RQ Biotechnology.

Figures

None
Graphical abstract
Figure 1
Figure 1
Study design and T cell and IgG responses 6 months after vaccine dose 2, time course of T cell binding IgG and B cell responses for all participants, and cross section of responses 1 month post dose 3 after two doses of BNT162b2 (short or long interval) or AZD1222 vaccine (A) Schematic representation of vaccination and phlebotomy time points. Figure created using BioRender. (B) Association of membrane (M) and nucleocapsid (N) protein-specific T cell and SARS-CoV-2 N-specific IgG responses in participants 6 months after second dose and 28 days after third dose (hence participants can have >1 value) by infection status. (C) Comparison of IFNγ ELISpot responses to spike (S, ancestral strain) from cryopreserved peripheral blood mononuclear cells (PBMCs) in naive (gray circles) participants 6 months after two doses of BNT162b2 (Pfizer-BioNTech) delivered with a short dosing interval short, 3–5 weeks, n = 33), or a long dosing interval (long, 6–17 weeks, n = 116), or 6 months after two doses of AZD1222 (AstraZeneca) vaccine (AZ, n = 29), or previously infected (closed red circles infected at baseline, open red circles infected during study) BNT162b2 short (n = 13), previously infected BNT162b2 long (n = 94), and AZ (n = 16)-vaccinated individuals. (D) Effect of vaccine regimen and infection status on SARS-CoV-2 S-specific IgG responses in naive short (n = 38), long (n = 170), and AZ (n = 39) and previously infected short (n = 18), long (n = 99), and AZ (n = 28)-vaccinated individuals. (E) Effect of vaccine regime and infection status on SARS-CoV-2 RBD-specific IgG responses in naive short (n = 38), long (n = 169), and AZ (n = 37) and previously infected short (n = 18), long (n = 99), and AZ (n = 28)-vaccinated individuals. (F) Time course comparison of T cell responses to SARS-CoV-2 spike by IFNγ ELISpot assay for all vaccine regimens up to 6 months post third dose (n = 613). (G) Time course comparison of IgG antibody response to SARS-CoV-2 spike by MSD assay for all vaccine regimens up to 6 months post third dose (n = 680). (H) Time course comparison of B cell responses to SARS-CoV-2 spike by B cell ELISpot assay for all vaccine regimens up to 1 month post third dose. (I) Comparison of T cell responses 1 month after the third booster dose by primary vaccine regimen (BNT162b2 short, long, or AZD1222). (J) Comparison of IgG antibody responses 1 month after the third booster dose by primary vaccine regimen. (K) Comparison of B cell responses 1 month after the third booster dose by primary vaccine regimen. Gray circles, naive individuals; red circles, hybrid immunity. ELISpot values are expressed as spot-forming units per million (SFU/106) PBMCs. Data displayed are responses to peptide pools representing the sum of S1 and S2 units of S (ancestral strain). IgG responses were measured in serum 6 months after the second dose using multiplexed MSD immunoassays and are shown in arbitrary units (AU)/mL. Bars represent the median. Comparisons within groups were compared with Kruskal-Wallis and Dunn’s multiple comparisons test (C–K) and Spearman’s tests (B), with two-tailed p values shown above linking lines for significant differences with p ≤ 0.05. Where p values are absent, comparison was not statistically significant (p > 0.05). Dashed lines in (B) represent thresholds for a positive response: SARS-CoV-2 N IgG based on the mean concentrations measured in 103 pre-pandemic sera +3 SDs (3,874 AU/mL); SARS-CoV-2 M and N IFNγ ELISpot assay, mean +2 SDs of the DMSO wells across all experiments in the study (33 SFU/106). Unpaired comparisons between naive and hybrid immune time points were tested with the Mann-Whitney test.
Figure 2
Figure 2
Analysis of spike-specific T cell responses by flow cytometry (A and B) Cryopreserved PBMCs from a subset of 95 participants who received BNT162b2 (Pfizer/BioNTech) with a short or long dosing interval or AZD1222 (AstraZeneca) 1 month after the second dose were analyzed by ICS and flow cytometry. The individual cytokine expression levels of total IFNγ, IL-2, or TNF are shown as a percentage of (A) the CD4+ T cell population (top) or (B) the CD8+ T cell population (bottom). Populations were analyzed by gating on single, live, CD3+ cells (Figure S4). Short, BNT162b2 short interval; long, BNT162b2 long interval; AZ, AZD1222. Naive participants are shown as gray circles and hybrid immunity group are shown as red circles. Horizontal bars represent the median. (C) The T cell populations responsible for IFNγ or IL-2 expression were assessed as the proportion of IFNγ or IL-2 expressed by CD4+ T cells, calculated by dividing the cytokine production in CD4+ T cells by the total cytokine production in response to spike in both CD4+ and CD8+ T cells. Horizontal bars represent the median. (D) Polyfunctionality was evaluated by combined expression of IFNγ, IL-2, and TNF in CD4+ and CD8+ T cells, showing the percentage of cells making all three cytokines. Naive short, n = 20; naive long, n = 15; naive AZ, n = 14; hybrid immunity short, n = 13; hybrid immunity long, n = 17; hybrid immunity AZ, n = 16. Unpaired comparisons across two groups were performed using the Mann-Whitney test with two-tailed p values shown above linking lines when two-tailed p ≤ 0.05. Horizontal bars represent the median.
Figure 3
Figure 3
T cell proliferation to SARS-CoV-2 at 6 months after the primary vaccine course of two doses of BNT162b2 or AZD1222 T cell proliferation to SARS-CoV-2 peptide pools was assessed by flow cytometry in PBMCs from 73 participants who had received either BNT162b2 with a short or long vaccine dosing interval or AZD1222 vaccine and were either naive or were previously infected (either at baseline or during the course of the study). (A) Relative frequency of CD4+ and CD8+ T cells proliferating to individual peptide pools spike S1, spike S2, membrane (M), and N protein in naive (n = 39) and hybrid immunity (n = 34) individuals. Gray color, missing value. (B–E) (B and D) Proliferation to S1 and S2 and (C and E) M and N protein in CD4+ (B and C) and CD8+ (D and E) T cells are shown across the three vaccine regimens separated by exposure status (naive versus hybrid immunity). Individual data points and median with IQR are displayed for naive short, n = 16; naive long, n = 15; naive AZ, n = 8; hybrid immunity short, n = 11; hybrid immunity long, n = 12; hybrid immunity AZ, n = 11. Comparisons between naive and hybrid immunity within each vaccine regimen were performed using the Mann-Whitney test, and comparisons between the three vaccine regimens within the naive and previously infected groups was performed using the Kruskal-Wallis test and Dunn’s multiple comparisons correction. Two-tailed p values are shown only for statistically significant comparisons (p ≤ 0.05). Fold change between medians of two groups are shown in brackets next to or under p value. (Fold change is not shown for those comparisons where there was no proliferation detected in one of the groups.) Gray circles, naive individuals; red circles, participants with hybrid immunity. Central horizontal bars represent the median, and error bars represent the IQR.
Figure 4
Figure 4
Neutralizing antibody and ACE2 inhibition titer profiles against SARS-CoV-2 variants of concern 6 months after two doses of BNT162b2 or AZD1222 and 1 month after a third vaccine with BNT162b2 (A and C) Focus reduction neutralization assay 50% (FRNT50) antibody titers against the Victoria isolate (orange), Delta (B.1.617.2, purple), and Omicron BA.1 (B.1.1.529 BA.1, blue) taken from infection-naive participants. FRNT50 is the reciprocal dilution of the concentration of serum required to produce a 50% reduction in infectious focus-forming units of virus in Vero cells (ATCC CCL-81). Participants either received two doses of BNT162b2 (Pfizer-BioNTech) vaccine delivered in a short (3–5 weeks, n = 20) or long (6–17 weeks, n = 20) dosing interval or two doses of AZD1222 (AstraZeneca) vaccine (AZ, n = 16). Neutralizing antibody titers are shown in (A) 6 months after the second dose and, for the same individuals, (C) 1 month after a third booster dose of mRNA vaccine for all participants. Geometric mean neutralizing titers with 95% confidence intervals are shown. (E) Comparison of the data from (A) and (C), plotted as means with error bars by vaccine regimen 6 months after the second vaccine (V2 + 6 months), 1 month after the third booster mRNA vaccine (V3 + 1 month). The range of fold change (median) between V2 + 6 months and V3 + 1 month for the three vaccine regimens (short, dashed line; long, solid line; and AZ, dotted line) is shown in brackets for each variant. Points represent the median, and error bars represent the IQR. Data in (A), (C), and (E) from the short group (n = 20) have been previously published. (B and D) Impact of short or long BNT162b2 vaccine dosing interval and AZ on the ability of sera to inhibit ACE2 binding to SARS-CoV-2 spike (Victoria isolate, Delta (B.1.617.2), Omicron BA.1 (B.1.1.529 BA.1), Alpha (B.1.1.7), Beta (B.1.351), and Gamma (P.1)) (B) 6 months after the second dose and (D) 1 month after a third booster dose with mRNA vaccine. ACE2 inhibition was analyzed using a multiplexed MSD assay and performed at a serum dilution of 1:10 at V2 + 6 months and 1:100 at V3 + 1 month. Data are shown as percentage of inhibition. Bars represent the median with 95% confidence intervals. Naive, short, n = 20; naive, long, n = 20; naive, AZ, n = 16 for V2 + 6 months; naive, short, n = 19; naive, long, n = 20; naive, AZ, n = 10 for V3 + 1 month. Vaccine regimens were compared with the Kruskal-Wallis nonparametric test and Dunn’s multiple comparisons correction, with two-tailed p values shown above linking lines when two-tailed p ≤ 0.05, and fold changes are shown between the columns.
Figure 5
Figure 5
Antibody responses to Omicron subvariants up to 6 months after dose 3 (A–C) IgG binding measured on the MSD platform to spike from ancestral SARS-CoV-2 (orange) and the BA.1 (blue), BA.2 (gray), BA.3 (brown), BA.3 (maroon), and BA.5 (green) Omicron variants at 6 months after two doses of BNT162b2 (A) and 1 month after dose 3 of BNT162b2 vaccine in infection-naive participants (n = 21) (B) and 6 months post dose 3 of BNT162b2 vaccine (C) in both infection-naive participants (n = 60) and in participants who became infected with an Omicron variant between 1 and 6 months after dose 3 (n = 55). Central horizontal bars represent the median, and error bars represent the IQR. (D–F) ACE2 inhibition by plasma from the same donors in (A)–(C) at 6 months post dose 2 (D), 1 month post dose 3 (E), and 6 months post dose 3 (F). ACE2 inhibition was performed at a serum dilution of 1 in 100 to account for saturation of the assay, as seen in Figure 6. Comparisons between responses to ancestral and Omicron variants were made using Friedman’s test, with two-tailed p values of significant differences (p ≤ 0.05) shown above linking line. Central horizontal bars represent the median, and error bars represent the 95% confidence interval. (G) Neutralizing antibody was measured at 1 month post dose 3 and 6 months post dose 3 by FRNT50 for Victoria strain (orange), BA.1 (blue), BA.2 (gray), and BA.5 (green) Omicron variants in participants who remained infection naive (n = 33) and those who became infected in between 1 and 6 months after dose 3 (n = 11). Filled circles indicate participants who remain infection naive, and participants who became infected with an Omicron variant between 1 month and 6 months after the third vaccine dose are indicated in unfilled circles. Paired comparisons between 1 and 6 months after vaccine were tested using the Wilcoxon signed-rank test, and comparisons between groups were tested using the Mann-Whitney test.
Figure 6
Figure 6
Comparison of cytokine response at 6 months after dose 2 against ancestral strain and Omicron BA.1 variant according to infection status Longitudinal comparison of T cell and B cell responses against ancestral strain and Omicron BA.1 variant according to vaccine regimen and infection status. (A) Comparison of percentage IFNγ, TNF, and IL-2-positive CD4 T cells against ancestral strain and Omicron BA.1 variant by ICS of cryopreserved PBMCs in either infection-naive participants or participants with hybrid immunity. Box plots represent the median and IQR and whiskers represent 1.5× the IQR. (B) Comparison of percentage IFNγ, TNF, and IL-2-positive CD8 T cells against ancestral strain and Omicron BA.1 variant by ICS of PBMCs in either infection-naive participants or participants with hybrid immunity. Box plots represent the median and IQR and whiskers represent 1.5× the IQR. (C and D) Pairwise comparison of T cell responses to spike from ancestral strain and Omicron BA.1 variant from PBMCs by IFNγ ELISpot assay (C) in participants 6 months after primary vaccine course (two doses of BNT162b2 or AstraZeneca), n = 215, and (D) 1 month after third BNT162b2 vaccine dose, n = 175. Displayed are responses to peptide pools representing the sum of S1 and S2 units of S from ancestral strain and Omicron variant. (E) Pairwise comparison of IFNγ ELISpot responses in a subset of participants (n = 36) to only the 51 out of 178 peptides spanning spike that have mutations in Omicron BA.1 compared with the ancestral strain. (F) T cell responses to spike from ancestral strain and Omicron BA.1, BA.2, and BA.4/5 variants in PBMCs from naive (n = 28) and hybrid immune (n = 46) donors by IFNγ ELISpot assay. Horizontal lines represent the median. (G–I) (G) Pairwise comparison of B cell responses to S in ancestral strain and Omicron BA.1 variant from PBMCs in participants 1 month after vaccine dose 2 (n = 12); (H) 6 months post second vaccine dose (n = 43); (I) 1 month after third vaccine dose (n = 80). Orange circles, responses against Victoria variant; blue circles, responses against Omicron BA.1 variant. Displayed are responses to peptide pools representing S1 and S2 units of S from ancestral and Omicron variants. ELISpot values are expressed as antibody SFU/106 PBMCs. Horizontal lines represent median values. Comparisons between responses to ancestral and Omicron variants were made using Wilcoxon matched-pairs signed-rank test, with two-tailed p values of significant differences (p ≤ 0.05) shown above linking line.

References

    1. UK Health Security Agency . UK Health Security Agency; 2022. COVID-19 Vaccine Surveillance Report: 12 May 2022 (Week 19)
    1. Tartof S.Y., Slezak J.M., Fischer H., Hong V., Ackerson B.K., Ranasinghe O.N., Frankland T.B., Ogun O.A., Zamparo J.M., Gray S., et al. Effectiveness of mRNA BNT162b2 COVID-19 vaccine up to 6 months in a large integrated health system in the USA: a retrospective cohort study. Lancet. 2021;398:1407–1416. - PMC - PubMed
    1. Andrews N., Stowe J., Kirsebom F., Toffa S., Rickeard T., Gallagher E., Gower C., Kall M., Groves N., O’Connell A.-M., et al. Covid-19 vaccine effectiveness against the omicron (B.1.1.529) variant. N. Engl. J. Med. 2022;386:1532–1546. - PMC - PubMed
    1. Hall V.J., Foulkes S., Charlett A., Atti A., Monk E.J.M., Simmons R., Wellington E., Cole M.J., Saei A., Oguti B., et al. SARS-CoV-2 infection rates of antibody-positive compared with antibody-negative health-care workers in England: a large, multicentre, prospective cohort study (SIREN) Lancet. 2021;397:1459–1469. - PMC - PubMed
    1. Hall V.J., Foulkes S., Saei A., Andrews N., Oguti B., Charlett A., Wellington E., Stowe J., Gillson N., Atti A., et al. COVID-19 vaccine coverage in health-care workers in England and effectiveness of BNT162b2 mRNA vaccine against infection (SIREN): a prospective, multicentre, cohort study. Lancet. 2021;397:1725–1735. - PMC - PubMed

Publication types