. 2023 Apr 15:270:119956.
doi: 10.1016/j.neuroimage.2023.119956. Epub 2023 Feb 28.

Dynamics of alpha suppression index both modality specific and general attention processes

Affiliations

Dynamics of alpha suppression index both modality specific and general attention processes

Grace M Clements et al. Neuroimage. .

Abstract

EEG alpha power varies under many circumstances requiring visual attention. However, mounting evidence indicates that alpha may not only serve visual processing, but also the processing of stimuli presented in other sensory modalities, including hearing. We previously showed that alpha dynamics during an auditory task vary as a function of competition from the visual modality (Clements et al., 2022) suggesting that alpha may be engaged in multimodal processing. Here we assessed the impact of allocating attention to the visual or auditory modality on alpha dynamics at parietal and occipital electrodes, during the preparatory period of a cued-conflict task. In this task, bimodal precues indicated the modality (vision, hearing) relevant to a subsequent reaction stimulus, allowing us to assess alpha during modality-specific preparation and while switching between modalities. Alpha suppression following the precue occurred in all conditions, indicating that it may reflect general preparatory mechanisms. However, we observed a switch effect when preparing to attend to the auditory modality, in which greater alpha suppression was elicited when switching to the auditory modality compared to repeating. No switch effect was evident when preparing to attend to visual information (although robust suppression did occur in both conditions). In addition, waning alpha suppression preceded error trials, irrespective of sensory modality. These findings indicate that alpha can be used to monitor the level of preparatory attention to process both visual and auditory information, and support the emerging view that alpha band activity may index a general attention control mechanism used across modalities.

Keywords: Alpha suppression; Attention control; Auditory selective attention; EEG alpha power; Preparatory control; Visual selective attention.


Conflict of interest statement

Declaration of Competing Interest The authors declare that they have no known competing financial interests or personal relationships that could have appeared to influence the work reported in this paper.

Figures

Fig. 1.
Fig. 1.
Trial Schematic. A bimodal precue was presented for 400 ms, followed by a delay of 1600 ms. Then a bimodal reaction stimulus was presented for 400 ms, and could be either congruent or incongruent. The next trial began with a precue 1600 ms after the offset of the reaction stimulus.
Fig. 2.
Fig. 2.
Behavioral data displayed for accuracy (left) and reaction time (right) using boxplots with dot plots overlaid. Each dot represents an individual participant.
Fig. 3.
Fig. 3.
“Raw” alpha timeseries for each condition (auditory repeat, auditory switch, visual repeat, visual switch) at the parietal (top) and occipital (bottom) electrodes. Rectangles along the x-axis indicate the time periods at which significant main effects of modality (blue rectangles) and switch (orange rectangles) occurred. See Supp. Figs. 1 and 2 for tests of the effects.
Fig. 4.
Fig. 4.
Interaction between switch and modality on alpha activity (8–12 Hz), calculated as the modality difference on repeat trials (Visual Repeat – Auditory Repeat) subtracted from the modality difference on switch trials (Visual Switch – Auditory Switch) at both parietal (top) and occipital (bottom) electrodes. Shading indicates 99% bootstrapped confidence intervals. The dotted vertical lines indicate the center of each 200 ms analytic interval. Insets illustrate the average raw data used to compute the interaction at each of the significant time windows (indicated by the brackets), and related standard errors. Inset scales are the same within a subplot; the red horizontal line indicates the baseline (0 μV2).
Fig. 5.
Fig. 5.
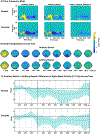
Comparison of visual trials. Time-frequency maps (A) of the preparatory period for attend-visual switch responses, attend-visual repeat responses, and switch minus repeat response differences. The dotted vertical line indicates the end of the baseline period, the solid vertical line indicates precue onset. Note: statistical testing of the difference map was not performed, and this panel is displayed for visualization only. Statistics were limited to the alpha time series, in line with hypotheses. Scalp topographies (B) across the preparatory period for attend-visual switch (top) and attend-visual repeat trials (bottom). A and B are on the same color scale. Difference waveforms (C) of the alpha timeseries (8–12 Hz) with 99% bootstrapped confidence intervals indicate no significant differences. The dotted vertical lines indicate the center of each 200 ms analytic interval. In A and C, the top row includes activity from the parietal electrodes, the bottom includes activity from the occipital electrodes.
Fig. 6.
Fig. 6.
Comparison of auditory trials. Time-frequency maps (A) of the preparatory period for attend-auditory switch responses, attend-auditory repeat responses, and the switch minus repeat response differences. The dotted vertical line indicates the end of the baseline period, the solid vertical line indicates precue onset. Note: statistical testing of the difference map was not performed, and this panel is displayed for visualization only. Statistics were limited to the alpha time series, in line with hypotheses. Scalp topographies (B) across the preparatory period for attend-auditory switch (top) and attend-auditory repeat trials (bottom). A and B are on the same color scale. Difference waveforms (C) of the alpha timeseries (8–12 Hz) with 99% bootstrapped confidence intervals indicate that at parietal electrodes, a sustained significant difference exists from 600 – 1400 ms after the precue. The dotted vertical lines indicate the center of each 200 ms analytic interval. In A and C, the top row includes activity from the parietal electrodes, the bottom includes activity from the occipital electrodes.
Fig. 7.
Fig. 7.
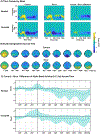
Comparison of correct and error trials. Time-frequency maps (A) of the preparatory period for correct responses, error responses, and for correct minus error response differences. The dotted vertical line indicates the end of the baseline period, the solid vertical line indicates precue onset. Note: statistical testing of the difference map was not performed, and this panel is displayed for visualization only. Statistics were limited to the alpha time series, in line with hypotheses. Scalp topographies (B) across the preparatory period for correct (top) and error trials (bottom). A and B are on the same color scale. Difference waveforms (C) of the alpha time series (8–12 Hz) with 99% bootstrapped confidence intervals indicate that at parietal electrodes, a significant difference begins at 800 ms after the precue. The dotted vertical lines indicate the center of each 200 ms analytic interval. In A and C, the top row includes activity from the parietal electrodes, the bottom includes activity from the occipital electrodes.

References

    1. Banerjee S, Snyder AC, Molholm S, Foxe JJ, 2011. Oscillatory alpha-band mechanisms and the deployment of spatial attention to anticipated auditory and visual target locations: supramodal or sensory-specific control mechanisms? J. Neurosci 31 (27), 9923–9932. doi: 10.1523/JNEUROSCI.4660-10.2011. - DOI - PMC - PubMed
    1. Chatrian GE, Petersen MC, Lazarte JA, 1960. Responses to clicks from the human brain: some depth electrographic observations. Electroencephalogr. Clin. Neurophysiol 12 (2), 479–489. doi: 10.1016/0013-4694(60)90024-9. - DOI - PubMed
    1. Clements GM, Bowie DC, Gyurkovics M, Low KA, Fabiani M, Gratton G, 2021. Spontaneous alpha and theta oscillations are related to complementary aspects of cognitive control in younger and older adults. Front. Hum. Neurosci 15, 106. doi: 10.3389/fnhum.2021.621620. - DOI - PMC - PubMed
    1. Clements GM, Gyurkovics M, Low KA, Beck DM, Fabiani M, Gratton G, 2022. Dynamics of alpha suppression and enhancement may be related to resource competition in cross-modal cortical regions. Neuroimage 252, 119048. doi: 10.1016/J.NEUROIMAGE.2022.119048. - DOI - PMC - PubMed
    1. Cohen MX, 2014. Analyzing Neural Time Series Data. Massachusetts Institute of Technology, Cambridge, MA.

Publication types