. 2023 Mar 2;14(1):1144.
doi: 10.1038/s41467-023-36351-0.

Precise characterization of a corridor-shaped structure in Khufu's Pyramid by observation of cosmic-ray muons

Affiliations

Precise characterization of a corridor-shaped structure in Khufu's Pyramid by observation of cosmic-ray muons

Sébastien Procureur et al. Nat Commun. .

Abstract

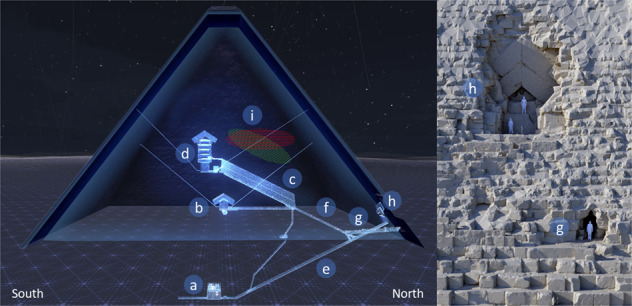
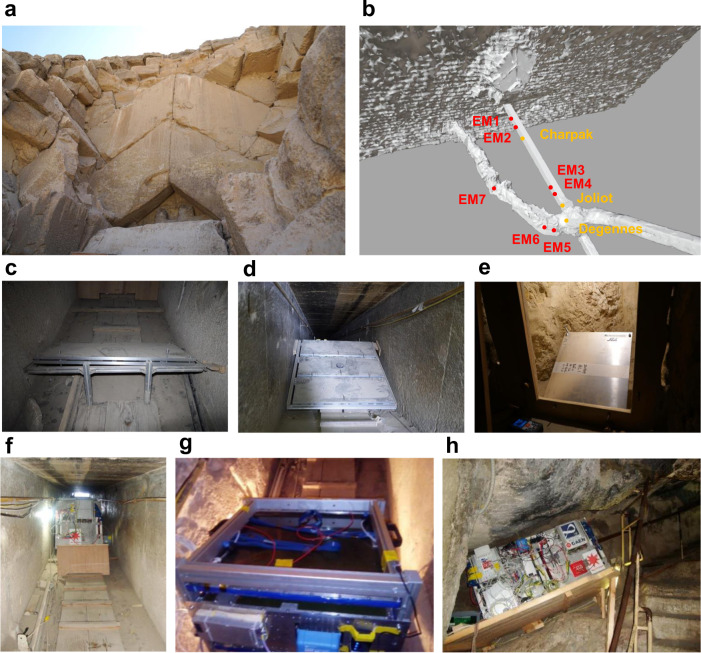
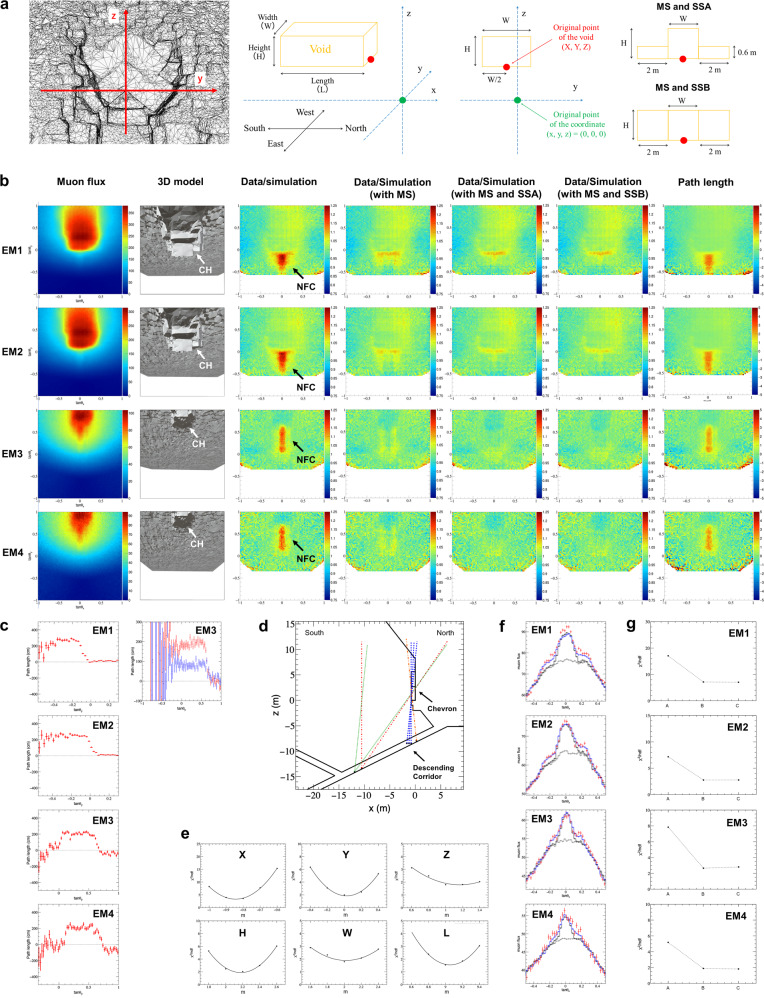
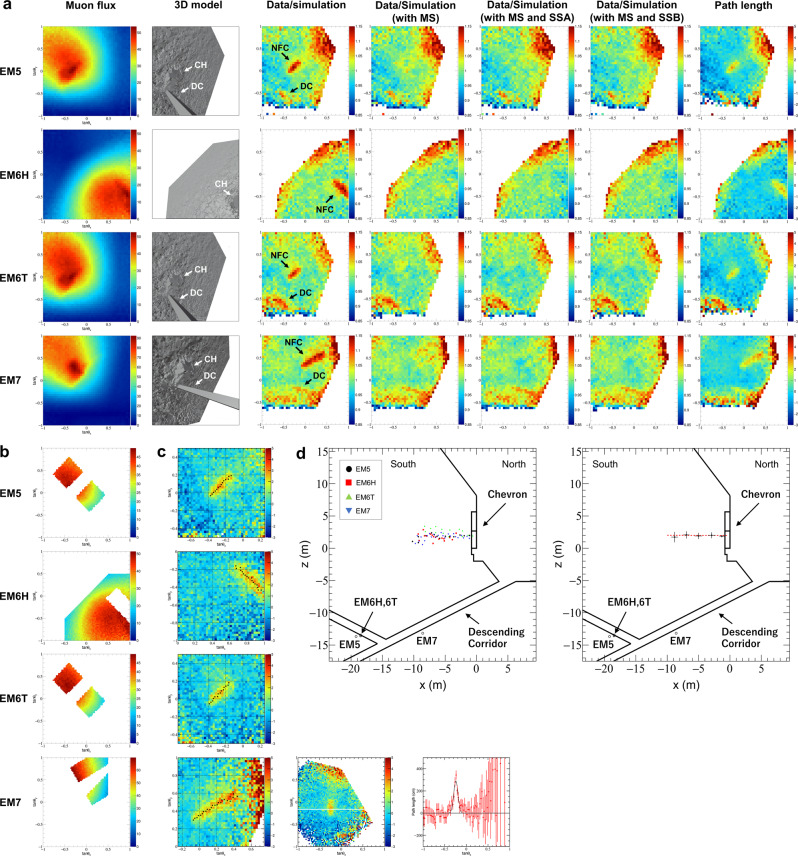
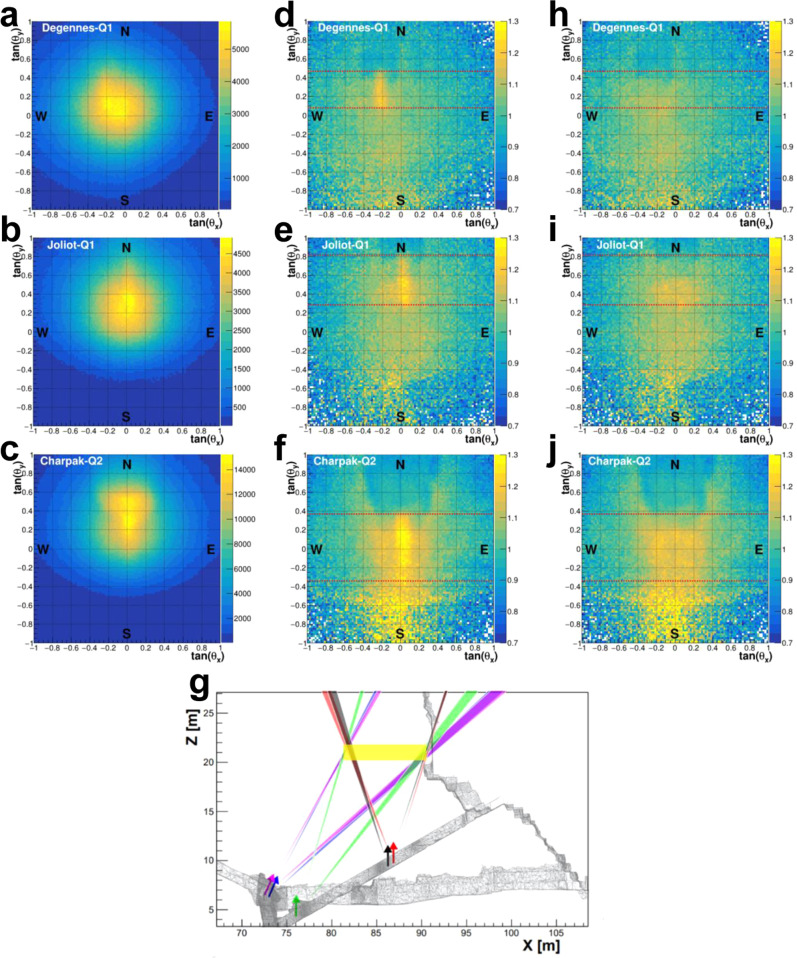
Khufu's Pyramid is one of the largest archaeological monument all over the world, which still holds many mysteries. In 2016 and 2017, the ScanPyramids team reported on several discoveries of previously unknown voids by cosmic-ray muon radiography that is a non-destructive technique ideal for the investigation of large-scale structures. Among these discoveries, a corridor-shaped structure has been observed behind the so-called Chevron zone on the North face, with a length of at least 5 meters. A dedicated study of this structure was thus necessary to better understand its function in relation with the enigmatic architectural role of this Chevron. Here we report on new measurements of excellent sensitivity obtained with nuclear emulsion films from Nagoya University and gaseous detectors from CEA, revealing a structure of about 9 m length with a transverse section of about 2.0 m by 2.0 m.


Conflict of interest statement

The authors declare no competing interests.

Figures

Fig. 1
Fig. 1. East-West cut view of the Great Pyramid and front view of the North face Chevron area.
a Subterranean chamber, b queen’s chamber, c grand gallery, d king’s chamber, e descending corridor, f ascending corridor, g al-Ma’mun corridor, h north face Chevron area, i ScanPyramids Big Void with horizontal hypothesis (red hatching) and inclined hypothesis (green hatching) as published in November 2017. All these images were obtained from a 3D modelization using dedicated laser surveys and photogrammetry data.
Fig. 2
Fig. 2. Detectors installed in the DC and in the MC.
a The Chevron, which consists of huge gabled limestone beams, covering the original entrance to the DC on the North side of Khufu’s Pyramid. b 3D model and positions of the detectors from Nagoya University, indicated by red dots and of the detectors from CEA, indicated by orange dots, in the DC and in the MC. ch The detectors. c shows EM3, d shows EM2, e shows EM5, f shows Charpak, g shows Joliot and h shows Degennes.
Fig. 3
Fig. 3. Results of the analysis of the nuclear emulsion films installed in the descending corridor.
a The left figure shows the 3D model of Chevron and its origin. Center panels show the definition of the coordinate system and the origin of the rectangular cuboid which was defined as its North extremity along x, its center along y, and its bottom along z. Right panels show the set up of the main structure (MS) and sub-structures designated A (SSA), B (SSB). CH denotes the Chevron. b Two-dimensional angular distribution for EM1 to EM4. From left to right: observed muon flux (tracks/cm2/day/sr), 3D model, ratio of muon flux of the observed data to simulation, with MS, with MS and SSA, with MS and SSB, and path length with difference between the data and simulation. The resolution is tanθ = 0.025. c Histograms of path length with difference between the data and simulation in the range of 0.000 ≦ tanθx < 0.025 in the axial direction of tanθy corresponding to the North-South direction. d Region of existence of the NFC based on path length. e χ2 analysis for the evaluation of parameters presenting location and shape of the NFC. The horizontal axis shows the values of evaluated parameters. The vertical axis is the value of reduced χ2 obtained by the comparison of the data and simulation. f Histograms of muon flux in the range of −0.250 ≦ tanθy < −0.225 for EM1 and EM2, 0.200 ≦ tanθy < 0.225 for EM3 and EM4, respectively. The data with statistical error of 1 σ (standard deviation) are shown in red. The gray dashed line is the simulation without the inner structures, the black solid line is the simulation with the DC and MS, and the blue solid line is the simulation with the DC, MS, and SSA. g Results of the χ2 analysis for the case where the MS and sub-structures are added to known structures. A, B, and C denote the case where MS, MS and SSA, MS and SSB are added, respectively.
Fig. 4
Fig. 4. Results of the analysis of the nuclear emulsion films installed in the al-Ma’mun Corridor.
a Two-dimensional angular distribution for EM5 to EM7. From left to right: observed muon flux (tracks/cm2/day/sr), 3D model, ratio of muon flux of the data to simulation, with main structure (MS), with MS and sub-structure A (SSA), with MS and sub-structure B (SSB), and path length with difference between the data and simulation. The resolution is tanθ = 0.050. CH denotes the Chevron. b The area used for normalization. c Left panels show two dimensional angular distribution with enlarged area including NFC of path length difference between the data and simulation with the resolution of tanθ = 0.025. The black dots are the direction to the center of the NFC, obtained by taking a cross section every tanθ = 0.025 and fitting it (Methods). Center panel shows an example of path length difference obtained by EM5, and the coordinate system is rotated to take the cross section for fitting, which is perpendicular to the longitudinal direction (North-South direction) of the NFC. Right panel shows an example of the fitting to a cross section taken at tanθy = −0.1625 after rotation, which is indicated by the white line shown in center panel, where the horizontal axis is tanθx after rotation and the vertical axis is the difference in path length. d Location of the NFC. Left panel shows the intersection of a vertical plane passing through the central axis of the DC and a line extending towards the plane on the direction of the central value of the histogram fitted starting from the detector position. Right panel shows the result of averaging the projection points obtained by all detectors in the height direction with a width of 2 m in the x (North-South) direction. The error bars are the standard deviations of the averaged projection points in the x and y directions. The red dotted line is the approximate line obtained by linear approximation of the projection results in the range of −2 to −8 m.
Fig. 5
Fig. 5. Results of the analysis of the nuclear emulsion films by Nagoya University.
The location and shape of the NFC are shown in cross-sectional views of the analysis area including Chevron from the North (a) and East (b) sides. Locations of EM1 to EM4 detectors installed in the DC and obtained results are shown in red, and EM5 to EM7 installed in the MC are shown in black, respectively in b. The red dotted line is the projection of the location and shape of the NFC defined as a rectangular cuboid achieved by EM1 to EM4, on planes. Black dots are the projection points in the height obtained by detectors (EM5 to EM7) on planes and error bars, which is the standard deviations of the averaged projection points in the x and z directions as shown in Fig. 4d.
Fig. 6
Fig. 6. Effect of the muon parametrization on the comparison between data and simulation.
a Muography of the Joliot instrument. bg Ratio between Joliot muography and Geant4 simulations of the known structures, using parametrizations from Tang (b), Reyna (c), Matsuno (d), Bogdanova (e), Guan (f), and Shukla (g).
Fig. 7
Fig. 7. NFC signal and triangulation from CEA data.
ac Raw muographies obtained with Degennes-1, Joliot and Charpak-2. df Ratio between the data and the simulation for these three instruments, showing good overall agreement except in the summit direction where the statistics is very low. The horizontal, dashed red lines indicate the limit of the NFC obtained by slicing each image. g Triangulation of the NFC using the five instruments, where each cone represents the extremity of the NFC found in one data set (i.e., the directions defined by the red lines in plots (df)). The width of each cone represents the uncertainty of its direction, i.e., from 0.5 to 1.5°. The arrows show the orientation of each instrument. The yellow rectangle represents the position and size of the NFC as determined from the CEA analysis. hj Same ratio as in df, obtained with a simulation containing a void representing the NFC, whose dimensions are described in the text. The excess seen in df has largely disappeared.
Fig. 8
Fig. 8. Determination of NFC characteristics from CEA data.
a, b Positions of the NFC extremities (South and North) obtained by random sampling within the determined cones and calculation of the corresponding intersection points. The (x;z) correlation arises from the observation direction. c, d Length and slope obtained from this sampling, with fits of these distribution giving mean value and error bars. eg Results of the χ2 method to determine the East-West shift Y, the height H and the width W of the NFC by each of the five instruments: each point corresponds to a simulation with a different Y, H or W. The χ2 is computed on a 1D histogram of the difference between data and simulation. The horizontal colored lines show the statistical error bars obtained for each instrument to display the data compatibility. h χ2 dependence as a function of Y was obtained by applying the same analysis to pseudo-data generated with the full simulation. i Integrated density distribution (in g/cm3) obtained between Z = 19.5 m and Z = 23.5 m using the SART algorithm as described in the text. The Chevron shape is correctly reconstructed as well as the NFC position, without any geometry input.

References

    1. Alvarez L, et al. Search for hidden chambers in the pyramids. Science. 1970;167:832–839. doi: 10.1126/science.167.3919.832. - DOI - PubMed
    1. Tanaka H, et al. Development of an emulsion imaging system for cosmic-ray muon radiography to explore the internal structure of a volcano, Mt. Asama. Nucl. Instrum. Methods Phys. Res. A. 2007;575:489–497. doi: 10.1016/j.nima.2007.02.104. - DOI
    1. Morishima, K. et al. First demonstration of cosmic ray muon radiography of reactor cores with nuclear emulsion based on an automated high-speed scanning technology. Proc. 26th Workshop on ‘Radiation Detectors and Their Uses’27–36 (2012).
    1. Fujii H, et al. Performance of a remotely located muon radiography system to identify the inner structure of a nuclear plant. Progr. Theor. Exp. Phys. 2013;7:073C01.
    1. Procureur S. Muon imaging: Principles, technologies and applications. Nucl. Instrum. Methods Phys. Res. A. 2018;878:169–179. doi: 10.1016/j.nima.2017.08.004. - DOI