. 2023 Mar 2;14(1):1187.
doi: 10.1038/s41467-023-36630-w.

Dietary restriction of cysteine and methionine sensitizes gliomas to ferroptosis and induces alterations in energetic metabolism

Affiliations

Dietary restriction of cysteine and methionine sensitizes gliomas to ferroptosis and induces alterations in energetic metabolism

Pavan S Upadhyayula et al. Nat Commun. .

Abstract

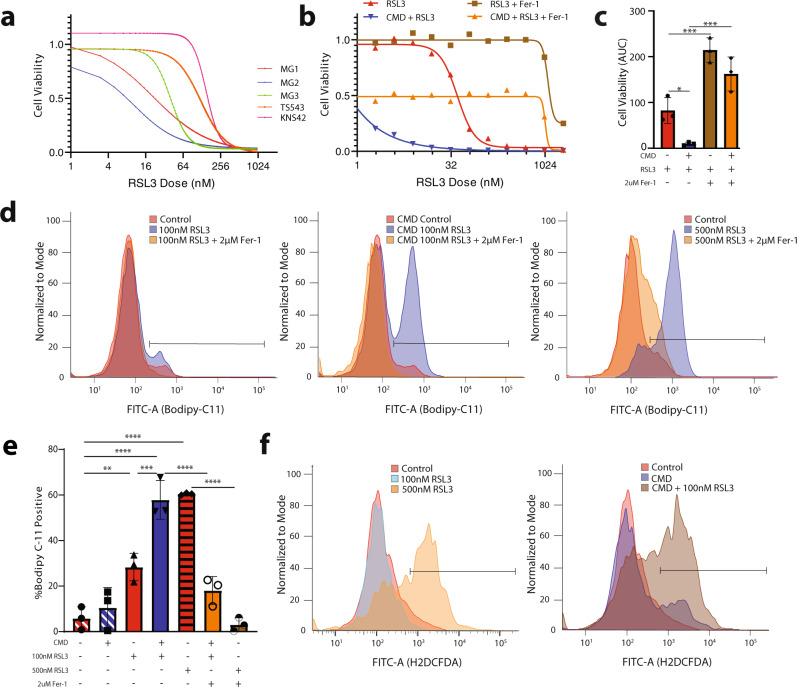
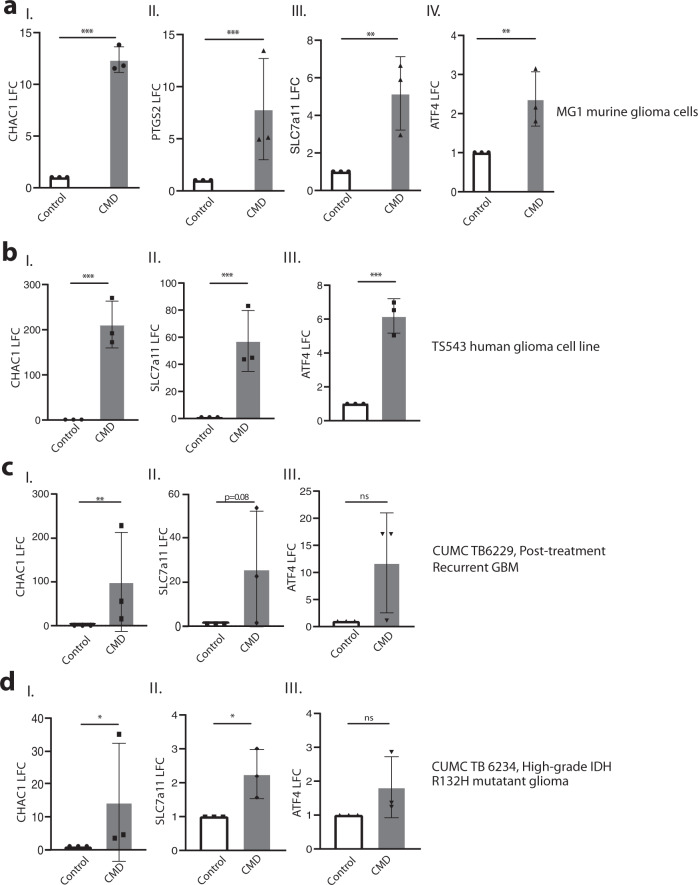
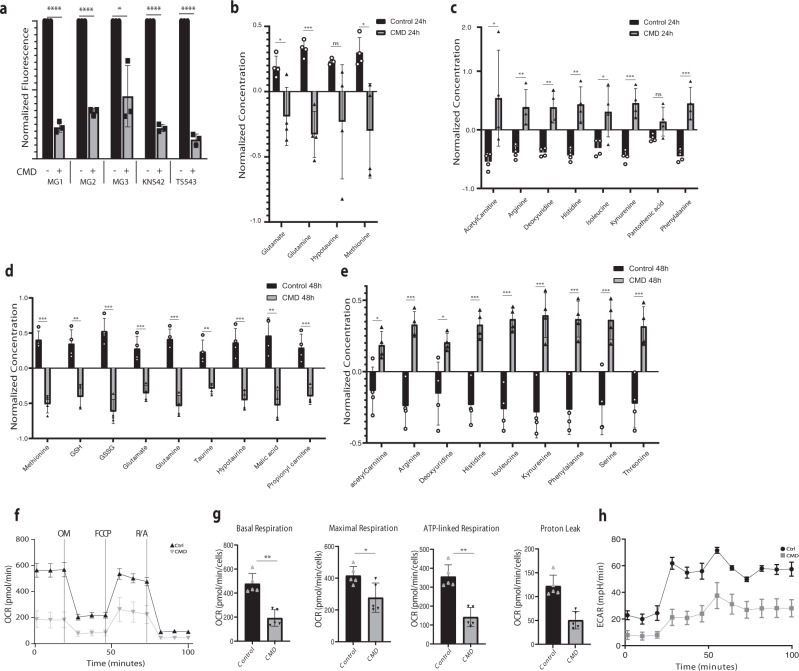
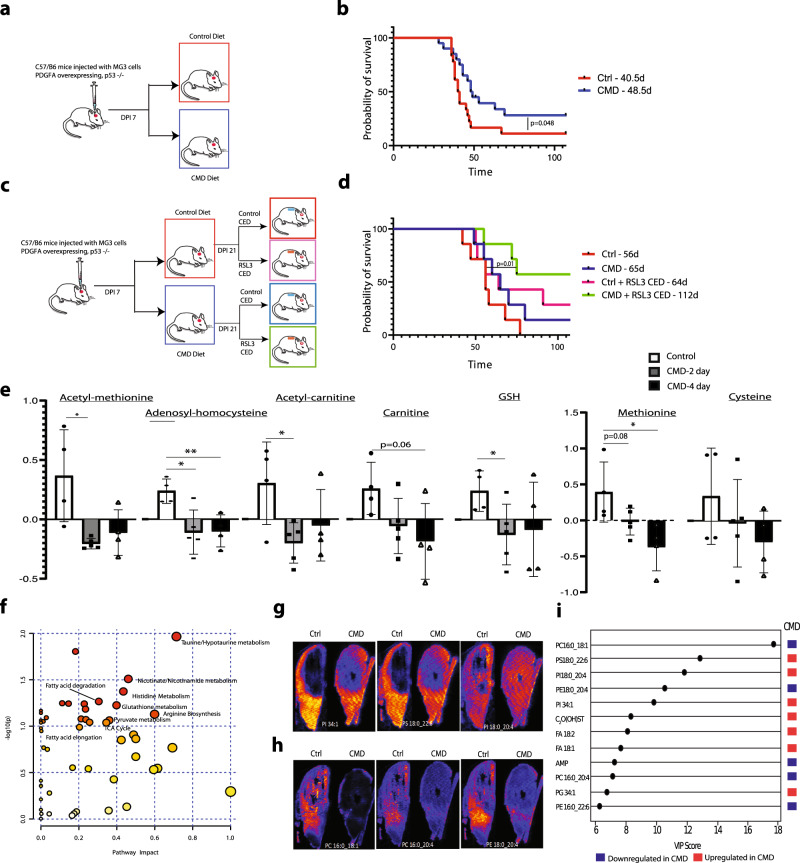
Ferroptosis is mediated by lipid peroxidation of phospholipids containing polyunsaturated fatty acyl moieties. Glutathione, the key cellular antioxidant capable of inhibiting lipid peroxidation via the activity of the enzyme glutathione peroxidase 4 (GPX-4), is generated directly from the sulfur-containing amino acid cysteine, and indirectly from methionine via the transsulfuration pathway. Herein we show that cysteine and methionine deprivation (CMD) can synergize with the GPX4 inhibitor RSL3 to increase ferroptotic cell death and lipid peroxidation in both murine and human glioma cell lines and in ex vivo organotypic slice cultures. We also show that a cysteine-depleted, methionine-restricted diet can improve therapeutic response to RSL3 and prolong survival in a syngeneic orthotopic murine glioma model. Finally, this CMD diet leads to profound in vivo metabolomic, proteomic and lipidomic alterations, highlighting the potential for improving the efficacy of ferroptotic therapies in glioma treatment with a non-invasive dietary modification.


Conflict of interest statement

B.R.S., D.M.H., P.C., J.N.B., A.D., K.R.C., S.C., P.S.U. are inventors on patents and patent applications involving ferroptosis. B.R.S. co-founded and serves as a consultant to Inzen Therapeutics, Exarta Therapeutics, and ProJenX, Inc., serves as a consultant to Weatherwax Biotechnologies Corporation and Akin Gump Strauss Hauer & Feld LLP, and receives sponsored research support from Sumitomo Dainippon Pharma Oncology.

Figures

Fig. 1
Fig. 1. Cysteine and methionine deprivation (CMD) sensitizes glioma to RSL3-induced ferroptosis.
a 384-well dose-response curves showing response to RSL3 from 5 glioma cell lines: MG1, MG2, MG3, TS543, and KNS42. b Representative 384-well dose-response showing MG3 cells treated with RSL3 (red), RSL3 plus 2 uM Ferrostatin-1 (brown), CMD plus RSL3 (blue), CMD plus RSL3 and 2 uM Ferrostatin-1 (orange). c AUC quantification for dose response curves from 3-independent 96-well dose response curves of MG3 murine glioma cell lines treated with RSL3 ± CMD ± 2 uM Ferrostatin-1. d Representative Bodipy-C11 flow data from MG1 cells: left panel shows DMSO control (red), 100 nM RSL3 (blue), and 100 nM RSL3 plus 2 uM Ferrostatin-1 (orange) treatment for 30 min. Middle panel shows the same conditions but with 6 h of cysteine methionine deprivation pretreatment. Right panel shows a higher dose of RSL3 treatment (500 nM). e Quantification of 3 independent experiments demonstrated in d. f Flow cytometry, using H2DCFDA of ex vivo organotypic slice cultures from a human primary glioblastoma (CUMC TumorBank 6193) cultured in control or CMD media and treated with RSL3. Data for c and e are presented as mean ± SD. Significance denoted by: *p < 0.05, **p < 0.01, ***p < 0.001.
Fig. 2
Fig. 2. Cysteine methionine deprivation induces transcriptional hallmarks of ferroptosis.
a RT-qPCR data for (I.) CHAC1 (p < 0.0001) (II.) PTGS2 (p = 0.004) (III.) SLC7a11 (p = 0.003) (IV.) ATF4 (p = 0.007) transcripts from MG1 cells in either control (black) or 24 h CMD (grey) conditions. b RT-qPCR data for TS543 cells after 48 h CMD (grey) compared to control (black) for (I.) CHAC1 (p < 0.0001) (II.) SLC7A11 (p < 0.0001) and (III.) ATF4 transcripts (p < 0.0001). c RT-qPCR data of ex vivo organotypic slices for CUMC Tumor Bank 6229 Post-treatment recurrent glioblastoma treated in control (black) or CMD (gray) media. Transcripts for (I.) CHAC1 (p = 0.006) (II.) SLC7a11 (p = 0.08) and (III.) ATF4 (p = 0.10) shown. d RT-qPCR data of ex vivo organotypic slices for high-grade R132H mutant glioma, CUMC Tumor Bank 6234 ex vivo organotypic slices in control or CMD media. Transcripts for (I.) CHAC1 (p = 0.04), (II.) SLC7a11 (p = 0.01), and (III.) ATF4 (p = 0.11) shown. Data plotted as mean of log fold change ± SEM, n = 3 independent experiments for a, b and three independent slices for c, d. Statistics assessed using t-test on the un-transformed dCT values. Significance denoted by: *p < 0.05, **p < 0.01, ***p < 0.001.
Fig. 3
Fig. 3. CMD alters glioma cell metabolism.
Metabolite profiling performed on in vitro cell lines (a) Colorimetric assay of reduced glutathione levels for (left to right) MG1 (p < 0.001), MG2 (p < 0.001), MG3 (p = 0.01), TS543 (p < 0.001), and KNS42 (p < 0.001) in control (black bars) and CMD treated cells after 24 h (gray bars), with 3 independent samples per group per cell line. Data is presented as mean ± SD. b Normalized metabolite concentrations for key metabolites validated with the standards downregulated in CMD versus control at 24 h, or (c) upregulated in CMD versus control at 24 h. d Normalized metabolite concentrations for key metabolites with internal standards downregulated in CMD versus control at 48 h, or (e) upregulated in CMD versus control at 48 h. be Log normalized values are shown, data for each condition is from 4 biological replicates. Statistics are assessed using two tail t-tests. Values are presented as mean ± SD. fh Seahorse Mitochondrial stress test of MG3 cells in either control (black) or 12 h CMD (gray) OM: oligomycin, FCCP: Carbonyl cyanide-4 (trifluoromethoxy) phenylhydrazone, R/A: rotenone and antimycin A (n = 5). f The basal respiration, maximal respiration, ATP-linked respiration and proton leak values calculated from experiment in g were calculated and normalized (n = 5 per group). Data is presented as mean ± SD. h Extracellular acidification rate for control (black) or 12 h CMD (gray). Significance denoted by: *p < 0.05, **p < 0.01, ***p < 0.001.
Fig. 4
Fig. 4. CMD improves survival with corresponding metabolomic, proteomic and lipidomic changes in vivo.
a Diagram of experimental paradigm for CMD in vivo experiments. b Kaplan-Meier curve outlining survival comparing control (red, n = 18; 8 male, 10 female) versus CMD (blue, n = 20; 10 male, 10 female) diet mice orthotopically injected with MG3 cells (Median Survival: Control − 40 days, CMD − 48 days; Gehan-Breslow-Wilcoxon test, p = 0.048, Mantel-Cox test p = 0.051). c Diagram of experimental paradigm for CMD + /− RSL3 experiments. d Kaplan-Meier curve outlining survival comparing control (n = 7; red, female, median survival − 56d), CMD (n = 7, blue, female, median survival − 65d), Ctrl + RSL3 (n = 7, pink, female, median survival − 64d), CMD + RSL3 (n = 7, green, female, median survival − 112d); (control vs CMD + RSL3, Mantel-Cox p = 0.010, Gehan-Breslow Wilcoxon p = 0.019). e Targeted metabolite profiling of acutely treated in vivo tumors for 23 metabolites in mice transitioned to CMD diet at 28 days post injection. Tumors were harvested at 2 days after CMD diet initiation (gray), 4 days after CMD diet initiation (black) and from control diet (white) (control n = 4, 2-day CMD n = 5, 4-day CMD n = 4). Significant metabolites shown as mean ± SEM. Data is presented as mean ± SD. f Pathway analysis of metabolite profiling across chronically treated end-stage control (n = 4) and CMD (n = 5) male mice spanning 200 metabolites with relative concentrations log transformed and samples scaled by mean. Pathways enriched with p < 0.05 on one-way labeled. g Representative DESI-MS images from tumor region overlay included for upregulated lipid species. h Representative DESI-MS images from tumor region overlaid included for downregulated lipid species. i Variable importance of projection shows lipid species important in discriminating the two classes of samples apart (FDR-corrected p-value <0.05) from 6 male mice (control n = 3, CMD n = 3) in the negative ionization mode. Significance denoted by: *p < 0.05, **p < 0.01, ***p < 0.001.

References

    1. Gilbert MR, et al. A randomized trial of bevacizumab for newly diagnosed glioblastoma. N. Engl. J. Med. 2014;370:699–708. doi: 10.1056/NEJMoa1308573. - DOI - PMC - PubMed
    1. Chinot OL, et al. Bevacizumab plus radiotherapy-temozolomide for newly diagnosed glioblastoma. N. Engl. J. Med. 2014;370:709–722. doi: 10.1056/NEJMoa1308345. - DOI - PubMed
    1. Robert SM, et al. SLC7A11 Expression Is Associated With Seizures and Predicts Poor Survival in Patients With Malignant Glioma. Sci. Transl. Med. 2015;7:289ra86. doi: 10.1126/scitranslmed.aaa8103. - DOI - PMC - PubMed
    1. Liang J, et al. Mitochondrial PKM2 regulates oxidative stress-induced apoptosis by stabilizing Bcl2. Cell Res. 2017;27:329–351. doi: 10.1038/cr.2016.159. - DOI - PMC - PubMed
    1. Zheng L, et al. JNK Activation Contributes to Oxidative Stress-Induced Parthanatos in Glioma Cells via Increase of Intracellular ROS Production. Mol. Neurobiol. 2017;54:3492–3505. doi: 10.1007/s12035-016-9926-y. - DOI - PubMed

Publication types