. 2023 Mar 2;14(1):1196.
doi: 10.1038/s41467-023-36608-8.

Expectation violations enhance neuronal encoding of sensory information in mouse primary visual cortex

Affiliations

Expectation violations enhance neuronal encoding of sensory information in mouse primary visual cortex

Matthew F Tang et al. Nat Commun. .

Abstract

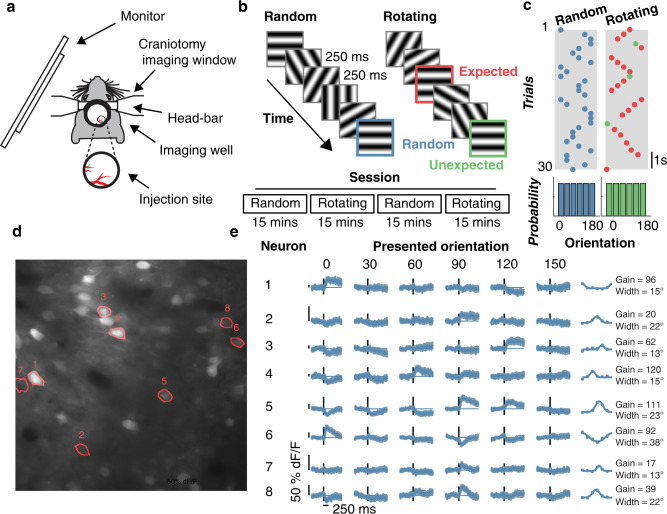
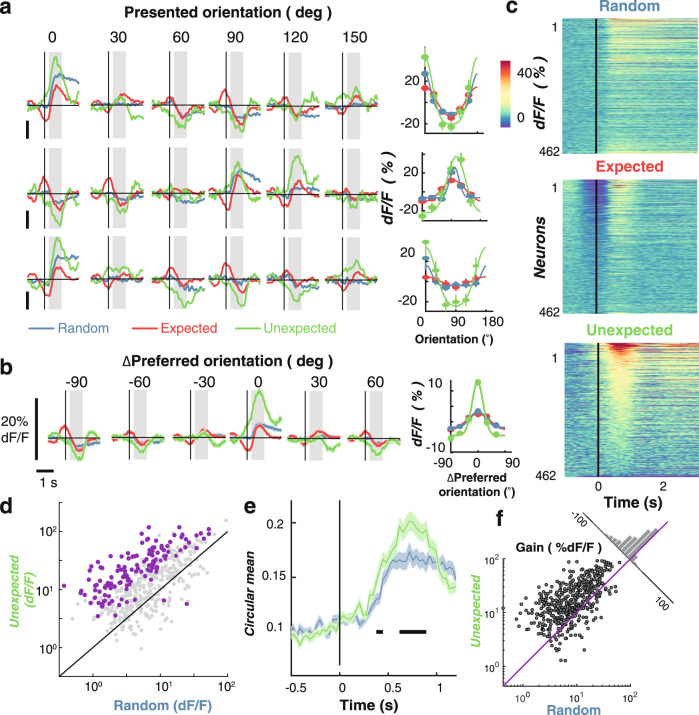
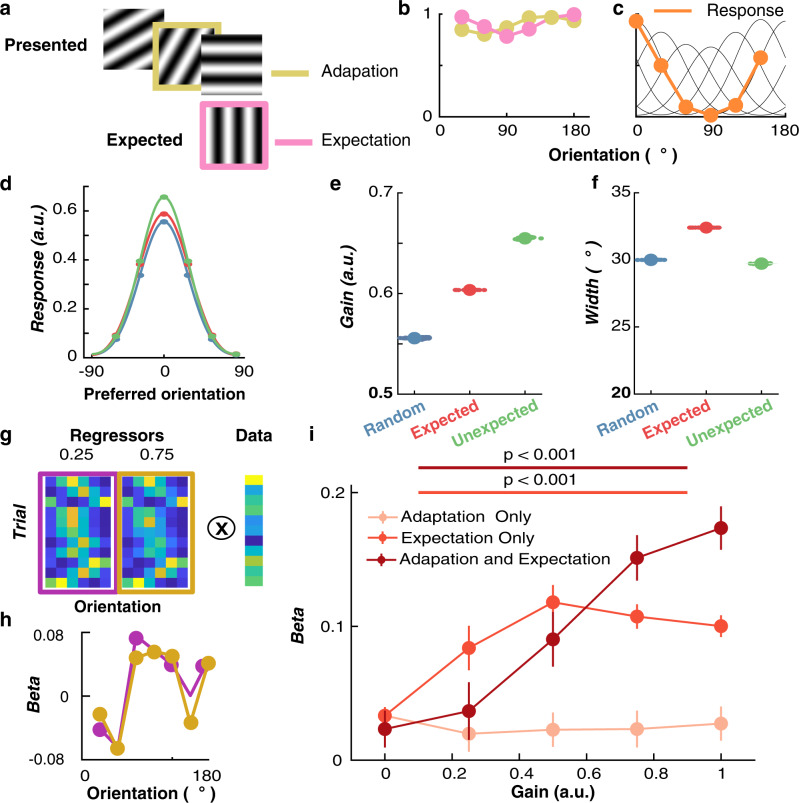
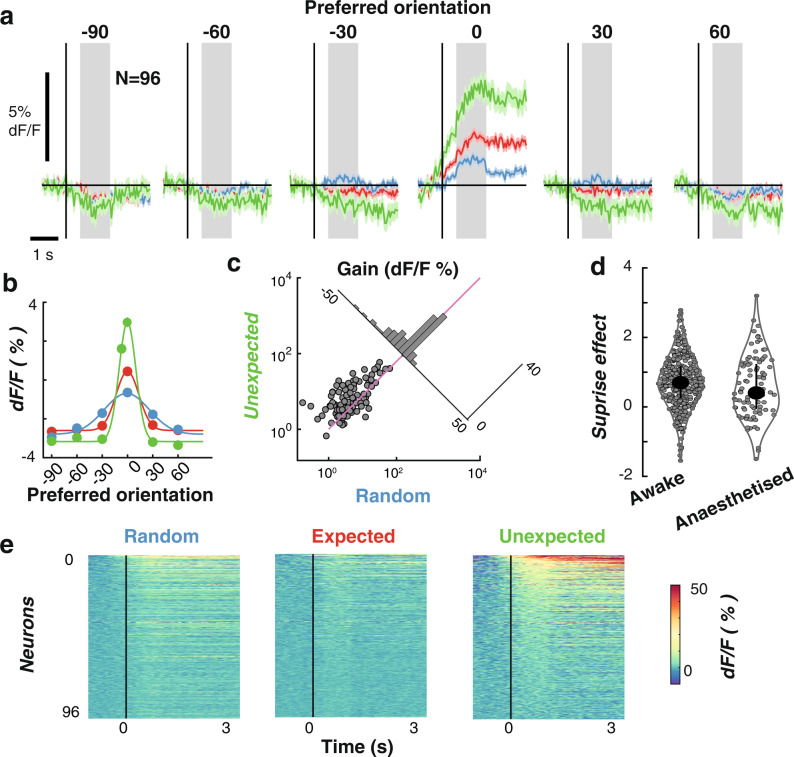
The response of cortical neurons to sensory stimuli is shaped both by past events (adaptation) and the expectation of future events (prediction). Here we employed a visual stimulus paradigm with different levels of predictability to characterise how expectation influences orientation selectivity in the primary visual cortex (V1) of male mice. We recorded neuronal activity using two-photon calcium imaging (GCaMP6f) while animals viewed sequences of grating stimuli which either varied randomly in their orientations or rotated predictably with occasional transitions to an unexpected orientation. For single neurons and the population, there was significant enhancement in the gain of orientation-selective responses to unexpected gratings. This gain-enhancement for unexpected stimuli was prominent in both awake and anaesthetised mice. We implemented a computational model to demonstrate how trial-to-trial variability in neuronal responses were best characterised when adaptation and expectation effects were combined.


Conflict of interest statement

The authors declare no competing interests.

Figures

Fig. 1
Fig. 1. Experimental procedure for testing the effects of prediction on orientation selectivity in mouse V1 neurons.
a Apparatus for using two-photon calcium imaging in combination with visual stimulation. b Schematic of the Random and Rotating sequences of oriented gratings. c In the Random condition, the orientation of each stimulus was drawn from a pseudo-randomised distribution (uniform probability from 0 to 150° in 30° steps). In the Rotating condition, the gratings rotated clockwise (e.g., 0° -> 30° -> 60°) or anti-clockwise (e.g., 0° -> 150° -> 120°) for 5–9 presentations (red dots) before jumping to a random unexpected orientation (indicated by the green dots). d Mean motion-corrected two-photon image from a single session, with individual neurons highlighted in red. e Time course of activity in the corresponding neurons highlighted in d in response to different grating orientations from the Random condition. The tuning functions in the right panels show the average response from 0 to 1000 ms after stimulus presentation. Points are fitted with a circular Gaussian with a baseline offset. The key parameters of the fits are given as the gain (amplitude) and width (standard deviation) of the Gaussian for each neuron. Shading and error bars show ±1 standard error over trials.
Fig. 2
Fig. 2. Expectation affects orientation-selective responses of individual V1 neurons.
a Time-courses of three example neurons in response to oriented grating stimuli in the expected, Unexpected and Random conditions. Each neuron is illustrated in a separate row, with the rightmost panel showing orientation tuning curves for that neuron. The tuning is measured as the averaged response from 250 to 1000 ms after stimulus onset (grey shading). The solid curve is a fitted Gaussian function with a constant offset. b Same as in A, but shows activity for all orientation-selective neurons (N = 462 neurons) aligned to their preferred orientation (0°) to allow averaging. Right panel: Same as in A but showing the Gaussian tuning function for the population response. c Response to the preferred orientation across the three conditions for all orientation-selective neurons. For presentation the time-courses are smoothed with a Gaussian with a 33.3 ms kernel. Every row represents the response of one neuron. In each panel, neurons are sorted based on their evoked response in the Unexpected condition (most excited on the top). d Comparison of the response in the Unexpected and Random conditions at the preferred orientation. Each dot represents one neuron. Purple dots show neurons significantly modulated by expectation (N = 133 neurons); grey dots are non-modulated neurons (N = 329 neurons). e Time-course of orientation-selectivity (circular mean) for the Random (blue) and Unexpected (green) conditions. Black horizontal lines indicate timepoints with statistically significant difference between conditions, determined using non-parametric cluster-corrected procedures (see Methods). f Summary statistics (n = 462) for fitted Gaussian parameters across the population for the different sequence types. All parameters are shown in Supplementary Fig. 1 for all three conditions. The Gain is the amplitude of the Gaussian. The insert shows the distribution of the difference between the two conditions (random minus unexpected). The purple line shows the zero point. Across all panels error bars and shading represent ± 1 standard error of mean. All statistical tests were two sided.
Fig. 3
Fig. 3. Expectation affects stimulus-specific information carried by neuronal population activity.
a Schematic of training the multivariate forward orientation encoding. Example regressors for 7 training trials with different orientations. The basis functions (grey lines) in response to different orientations which produce the regressor weights. Neuronal response for four example neurons for the example trials. Least squared regression is applied between the regressors and response to determine selectivity. Regression coefficients (beta weights) for four example neurons for each of the regressors found from a training set of data. b Testing the encoding model. Activity for the four neurons in test trials. Inverting the regressor weights and multiplying them by the population responses from the four neurons produces the predicted orientation response from this pattern of activity. The difference between the predicted and presented orientation for a given stimulus is the orientation error. c Distribution of orientation error when encoding was performed separately on groups of 50 neurons and 500 neurons at a time (with 24 permutations of different neuronal combinations). The vector average of these histograms was taken as the decoding accuracy for each condition. The coloured numbers show the vector sum for the corresponding curves. d Time-resolved classification from forward encoding modelling (N = 500 neurons) with 24 permutations of different groups of neurons. e Decoding accuracy scales with the number of neurons. The classifier was trained and tested on the average response from 250 to 1000 ms following stimulus onset, with different numbers of neurons included (N = 24 permutations of different neurons for each population size). The coloured horizontal lines indicate statistical significance using sign-flipped cluster permutation tests comparing Random vs. Unexpected (green line) and Random vs. Expected (blue line). In panels d and e, shading/error bars indicate ±1 standard error of the mean across permutations.
Fig. 4
Fig. 4. Increase in neuronal responses to unexpected stimuli is determined by the magnitude of the prediction error.
a Neurons tuned to each displayed orientation are affected differently when different orientations are expected. Panel a shows an example for each expected orientation using neurons selective for 90° orientations (n = 92 neurons), as defined based on their responses in the Random condition (from 250 to 1000 ms). Responses of remaining neurons selective for the other presented orientations are shown in Supplementary Fig. 3. For each unexpected stimulus in the rotating condition, we identified the difference between the orientation of the expected stimulus and the orientation of the presented unexpected stimulus. For instance, if 60° was expected but 0° was unexpectedly presented, the expectation violation would be 60°. b All orientation-selective neurons (n = 462) aligned with their preferred orientation, plotted as separate Gaussians for each difference between the expected orientation and the presented orientation (expectation violation). c Gain and d baseline of Gaussians fitted to each neuron’s response (n = 462), plotted as a function of expectation violation for all orientation-selective neurons. e Forward encoding modelling reveals how population representations of orientation are affected by the degree of expectation violation. The encoding weights are shown separately here for different values of expectation violation. Encoding was performed on population response recorded in each session (n = 23 sessions). f The y axis shows the difference between the presented and decoded orientation (∆Perceived orientation). The population response (filled symbols) is biased away from the expected orientation with the largest bias at ±30° (n = 23 sessions). In all panels, error bars indicate ±1 standard error of the mean. All statistical tests were two sided.
Fig. 5
Fig. 5. Computational model for explaining variance in neuronal response by incorporating gain modulation from prediction and adaptation effects.
The model consists of a bank of six neurons maximally selective for different orientations. The model’s sensitivity is affected by previous orientations in the sequence (Adaptation) as well as future predicted orientations (Expectation). These factors determine the response to the presented orientation on each trial. a An example sequence of trials in the rotating condition. The orientations of the preceding (mustard) and expected (pink) trials determine the adaptation and the expectation gains. b The adaptation gain (mustard line) is determined by the orientation of the previous stimuli. The expectation gain (pink line) is determined by the inverse copy of the response to the expected orientation. c Collectively, the two gains modulate the sensitivity of the channels on the next trial. These weights for the different orientations are applied to the model’s sensitivity channels (black lines), which give the response (orange line) to the presented orientation (vertical dashed line; in this case 0°). d Dots indicate the responses of the channels, and the curves are fitted Gaussian functions. Fitted parameter values to the model’s responses for the different stimulus conditions showing gain (e) and width (f) of the response to each session (n = 23) data. The large dots show the median and the smaller dots show the session results. The error bars indicate the upper and lower quartile range. g An example testing which model parameters best match the neuronal response in mouse V1 neurons. Regressors for two different expectation gains (0.25 and 0.75) lead to slightly different weights for 10 example trials. Warmer colours indicate higher values. These are regressed against the response (dF/F%) of each neuron. h This yields beta values for each orientation channel (regressors) for the two different expectation gains. i Ridge regression results when the model was used to predict response to the stimulus in the Expected sequence, with different levels of modulation from adaptation and prediction. The regressor (orientation) with the highest beta weight was chosen for each neuron (n = 226; modulated by prediction regardless of whether they were orientation selective). Error bars indicate ±1 standard error of the mean. All statistical tests were two sided.
Fig. 6
Fig. 6. Expectations affect the gain of orientation-selective V1 neurons under anaesthesia (N = 96).
a Time courses for all orientation-selective neurons aligned to their preferred orientation to allow averaging. Shading indicates ±1 standard error of the mean across neurons. b Population orientation tuning for the three expectation conditions, averaged across an epoch from 250 to 1000 ms after stimulus presentation. Solid lines are fitted Gaussian functions with a constant offset. c Summary statistics for the gain of the fitted Gaussians in b. The insert shows the distribution of the difference in response (Random minus Unexpected) for each neuron. The purple line shows the 0 point. d Comparison of the “surprise” effect (random events minus unexpected) between awake (N = 462) and anaesthetised (N = 96) experiments. The small dots are individual neurons and the larger points show the median. The error bars indicate the upper and lower quartile range. e Time course of responses to the preferred orientation of each neuron, shown separately for the three conditions. Neurons have been sorted by their responses in the Unexpected condition. Across panels ac shading and error bars indicate ±1 standard error of the mean across neurons.

Similar articles

Cited by

References

    1. Lundstrom BN, Fairhall AL. Decoding stimulus variance from a distributional neural code of interspike intervals. J. Neurosci. 2006;26:9030–9037. doi: 10.1523/JNEUROSCI.0225-06.2006. - DOI - PMC - PubMed
    1. Gross CG, Rocha-Miranda CE, Bender DB. Visual properties of neurons in inferotemporal cortex of the Macaque. J. Neurophysiol. 1972;35:96–111. doi: 10.1152/jn.1972.35.1.96. - DOI - PubMed
    1. Treue S, Martínez Trujillo JC. Feature-based attention influences motion processing gain in macaque visual cortex. Nature. 1999;399:575–579. doi: 10.1038/21176. - DOI - PubMed
    1. Luck SJ, Chelazzi L, Hillyard SA, Desimone R. Neural mechanisms of spatial selective attention in areas V1, V2, and V4 of macaque visual cortex. J. Neurophysiol. 1997;77:24–42. doi: 10.1152/jn.1997.77.1.24. - DOI - PubMed
    1. Friston K. A theory of cortical responses. Philos. Trans. R. Soc. B Biol. Sci. 2005;360:815–836. doi: 10.1098/rstb.2005.1622. - DOI - PMC - PubMed

Publication types