. 2023 Mar 2;14(1):1199.
doi: 10.1038/s41467-023-36817-1.

MYTHO is a novel regulator of skeletal muscle autophagy and integrity

Affiliations

MYTHO is a novel regulator of skeletal muscle autophagy and integrity

Jean-Philippe Leduc-Gaudet et al. Nat Commun. .

Abstract

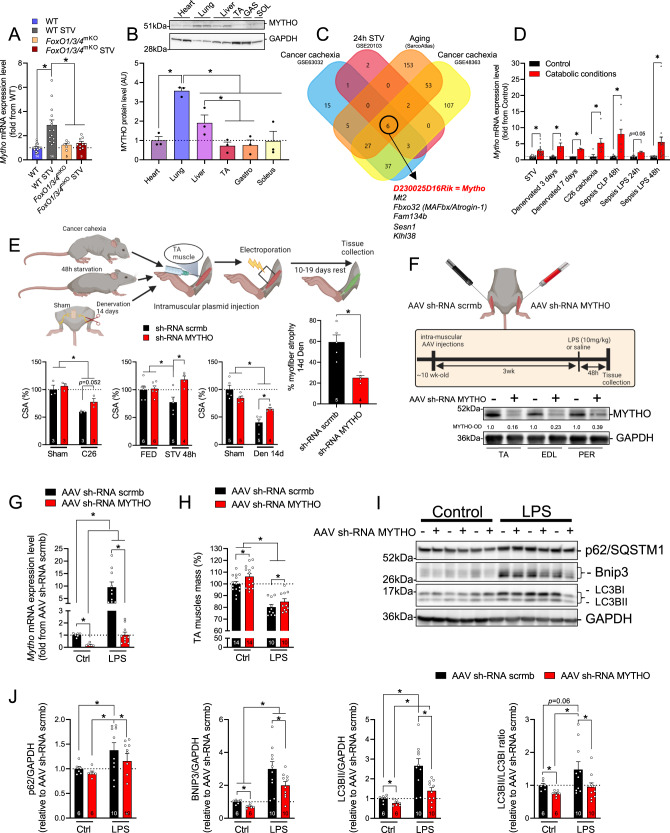
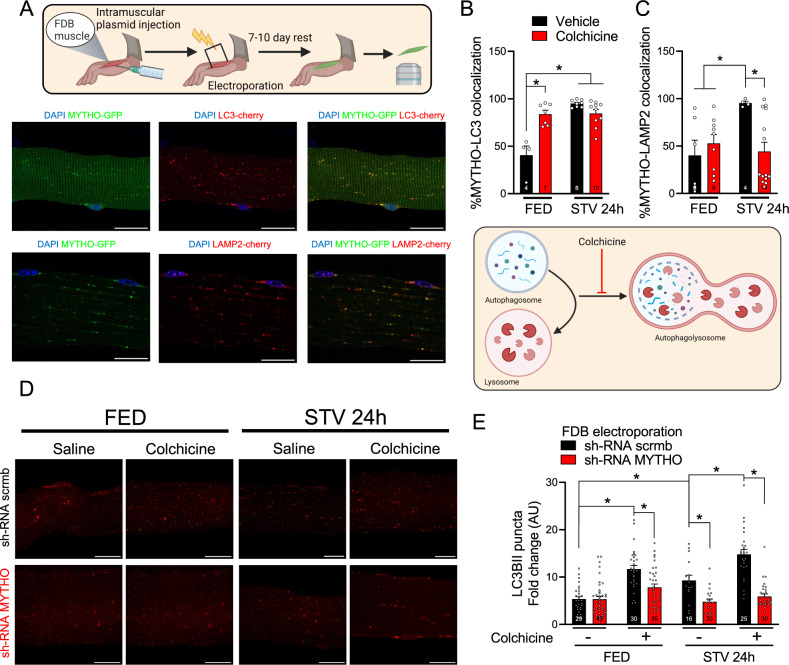
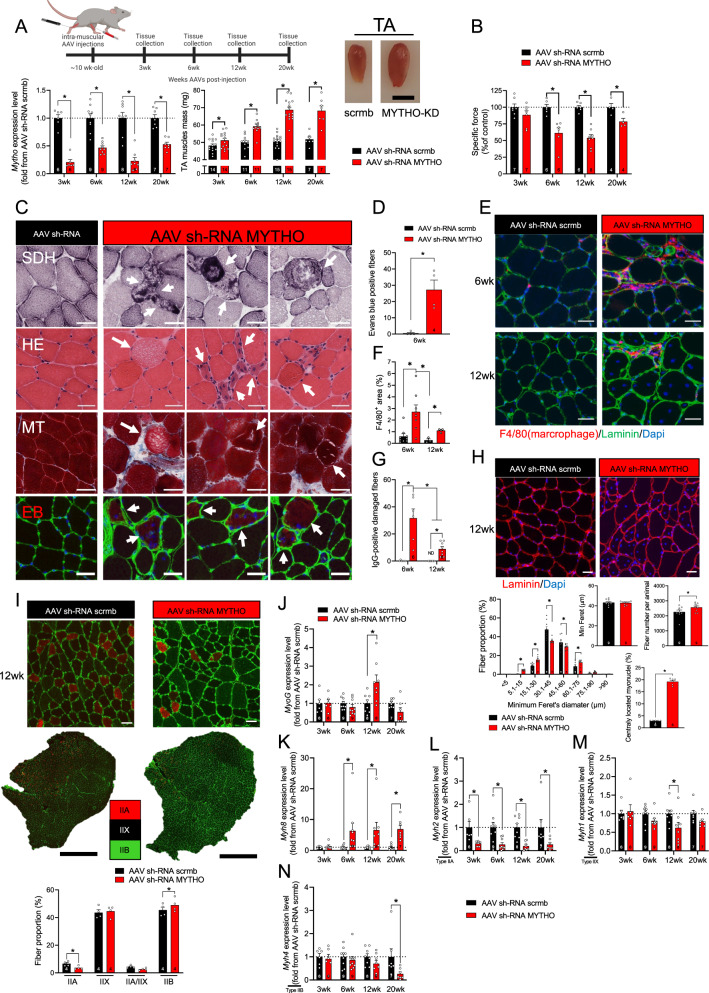
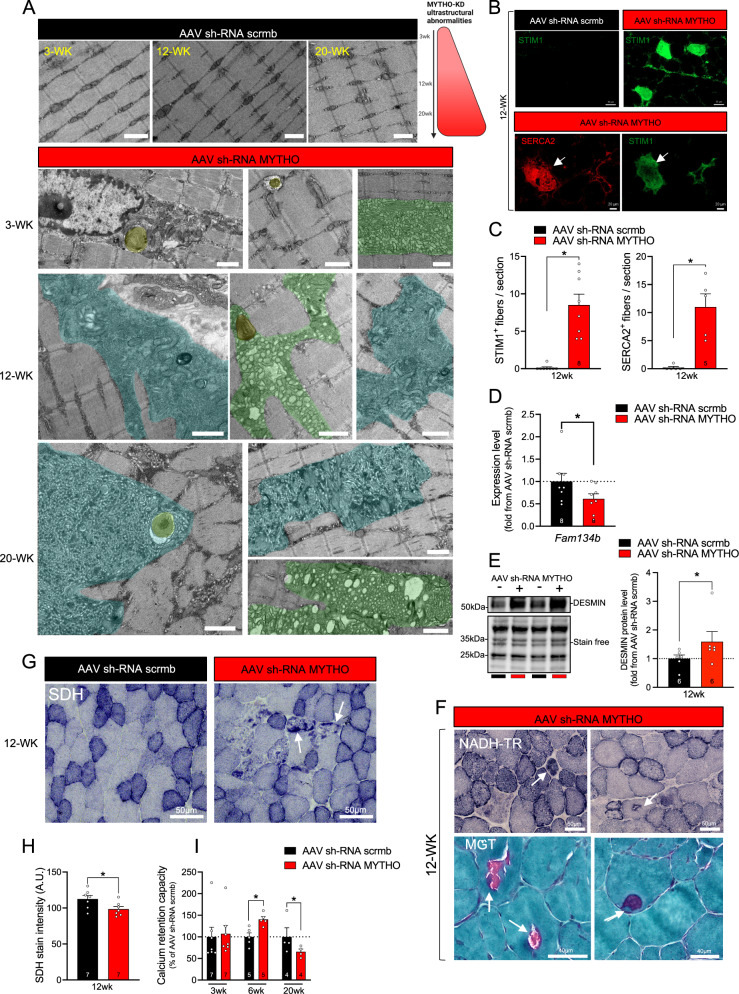
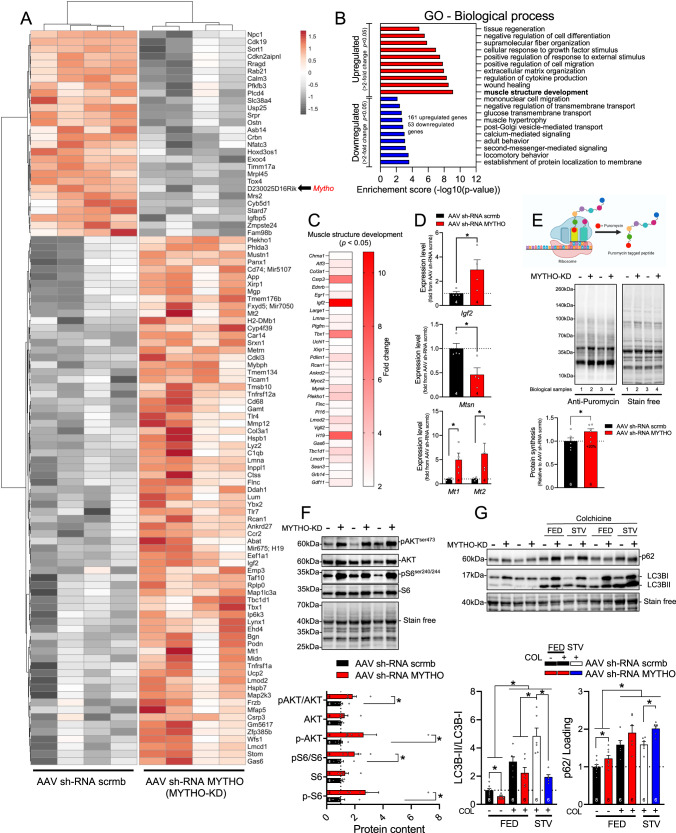
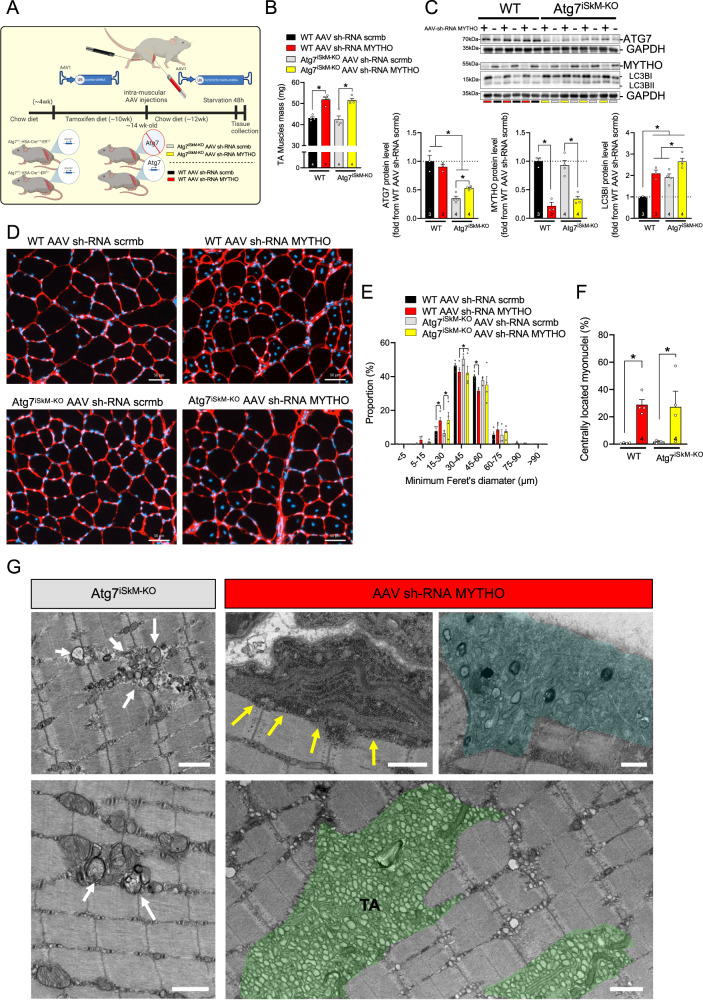
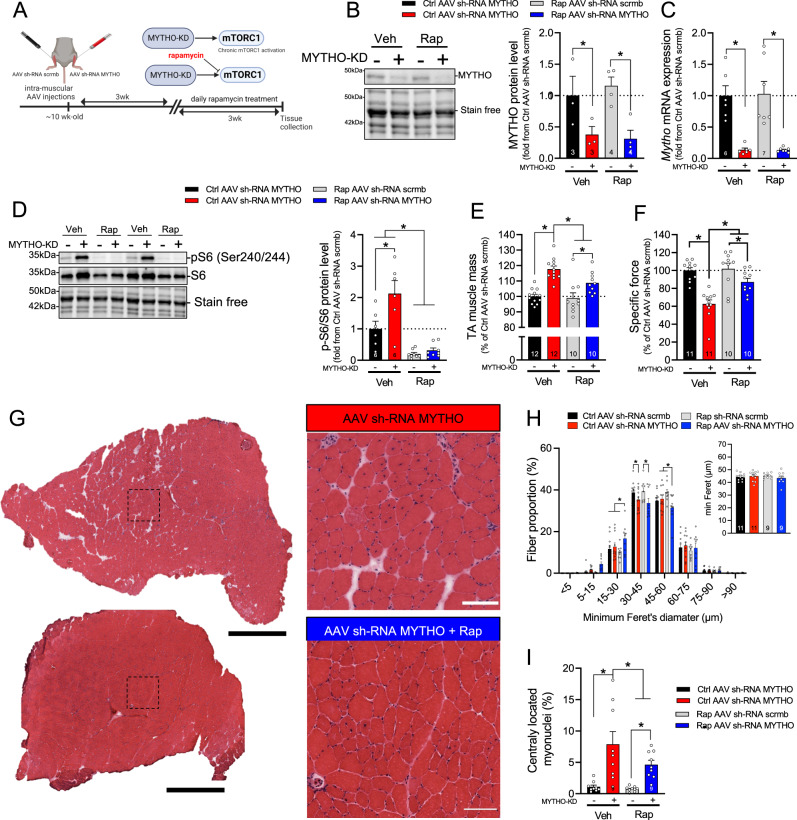
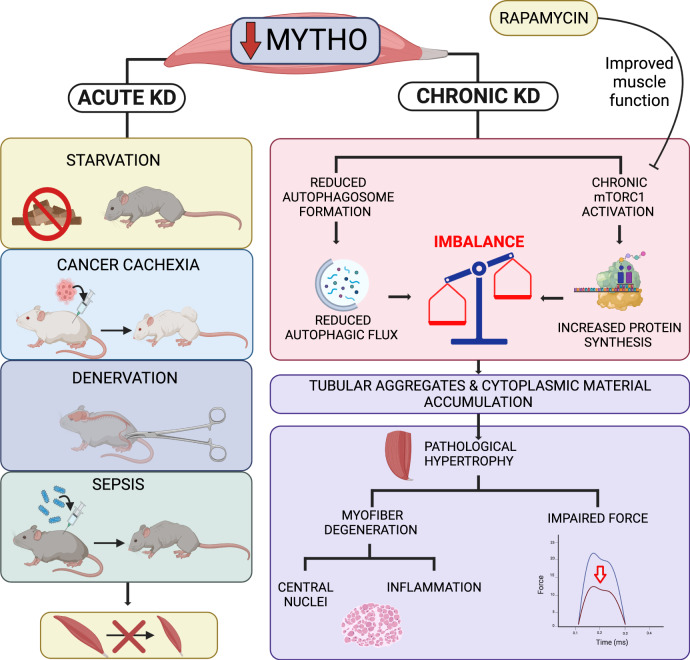
Autophagy is a critical process in the regulation of muscle mass, function and integrity. The molecular mechanisms regulating autophagy are complex and still partly understood. Here, we identify and characterize a novel FoxO-dependent gene, d230025d16rik which we named Mytho (Macroautophagy and YouTH Optimizer), as a regulator of autophagy and skeletal muscle integrity in vivo. Mytho is significantly up-regulated in various mouse models of skeletal muscle atrophy. Short term depletion of MYTHO in mice attenuates muscle atrophy caused by fasting, denervation, cancer cachexia and sepsis. While MYTHO overexpression is sufficient to trigger muscle atrophy, MYTHO knockdown results in a progressive increase in muscle mass associated with a sustained activation of the mTORC1 signaling pathway. Prolonged MYTHO knockdown is associated with severe myopathic features, including impaired autophagy, muscle weakness, myofiber degeneration, and extensive ultrastructural defects, such as accumulation of autophagic vacuoles and tubular aggregates. Inhibition of the mTORC1 signaling pathway in mice using rapamycin treatment attenuates the myopathic phenotype triggered by MYTHO knockdown. Skeletal muscles from human patients diagnosed with myotonic dystrophy type 1 (DM1) display reduced Mytho expression, activation of the mTORC1 signaling pathway and impaired autophagy, raising the possibility that low Mytho expression might contribute to the progression of the disease. We conclude that MYTHO is a key regulator of muscle autophagy and integrity.


Conflict of interest statement

The authors declare no competing interests.

Figures

Fig. 1
Fig. 1. D230025D16Rik encodes for a protein, named MYTHO, which is expressed in different tissues and transcriptionally upregulated in catabolic conditions.
A Quantification of Mytho mRNA expression in the tibialis anterior of fed and 24 h starved control and muscle-specific FoxO1/3/4SkM-KO mice assessed by RT-qPCR. B Immunoblotting detection of MYTHO in homogenates obtained from different mouse tissues (i.e., heart, lung, liver, and muscles) of 4 months old mice (n = 3 mice). 50 µg of proteins were loaded for all tissues. All data in the graph are expressed relative to MYTHO content in the heart. C Venn diagram showing that six upregulated genes overlap among four atrophic conditions (see the “Methods” section for details). D Quantification of Mytho mRNA expression from the gastrocnemius (GAS) of starved (24 h; n = 14 mice in the control group; n = 14 mice in the starved group), denervated (n = 3 mice in the control group; n = 3 mice in the denervated group), C26 tumor-bearing (n = 5 mice in the control group and n = 7 mice in the C26 cachexia group) and septic mice (n = 9 mice per group for CLP experiments; n = 3 mice per group LPS experiments at 24 h; n = 15 and 17 for the control group and the sepsis LPS group at 48 h) by RT-qPCR. E Inhibition of MYTHO prevents muscle atrophy in mice fasted for 48 h, in C26 tumor-bearing mice, and in mouse muscles denervated for 14 days. Adult tibialis anterior (TA) muscles were transfected for 10–19 days with a sh-RNA targeting Mytho mRNA or a scramble sh-RNA. The cross-sectional area (CSA) of transfected fibers was quantified. F Schematic representation of the experimental design: TA muscles were transduced with an AAV sh-RNA scramble or an AAV sh-RNA MYTHO. The immunoblots in the lower panel confirmed the successful knockdown of MYTHO in the TA, extensor digitorum longus (EDL), and peroneus (PER) muscles 3 weeks following AAV injections. G Quantification of Mytho mRNA expression in the TA of control and septic (LPS-injected) mice by RT-qPCR (n = 6 mice in the control group and n = 10 mice in the LPS-injected group). H Quantification of the impact of LPS injection and MYTHO knockdown on the TA mass 48 h post-LPS or saline injection. I, J Immunoblot detection and quantification of MYTHO, p62/SQSTM1, BNIP3, and the LC3BII/LC3BI ratio in the TA 48 h post-LPS or saline injection. GAPDH was used as a loading control. All values are expressed relative to the control AAV sh-RNA scramble. The number of mice for each group is indicated within bars. Data in A and B were analyzed with one-way ANOVA and corrections for multiple comparisons were performed with the two-stage step-up method of Benjamini, Krieger, and Yekutieli (∗p < 0.05 and q < 0.1). Data in C were analyzed with unpaired two-tailed t tests (∗p < 0.05). Data in E were analyzed with two-way ANOVA and corrections for multiple comparisons were performed with the two-stage step-up method of Benjamini, Krieger, and Yekutieli (∗p < 0.05 and q < 0.1), except for data presented in the graph on the right, which was analyzed with an unpaired two-tailed t test (∗p < 0.05). Data in G, H, J were analyzed with two-way ANOVA, and corrections for multiple comparisons were performed with the two-stage step-up method of Benjamini, Krieger, and Yekutieli (∗p < 0.05 and q < 0.1). Data are presented as mean ± SEM (with individual data points). Detailed information on raw data, statistical tests, p values, and q values are provided in the Source Data file. The drawings in E and F were created with BioRender.com.
Fig. 2
Fig. 2. MYTHO is required for skeletal muscle autophagy.
A Representative confocal microscope images were used for the quantification of the colocalization of MYTHO-GFP and cherry-LC3B (upper panels) or MYTHO-GFP and LAMP2-cherry (lower panels) in isolated FDB muscle fibers. Yellow dots highlight colocalization. Scale bar: 20 µm. B Quantification of MYTHO positive puncta that co-localizes with LC3 in single-fibers from mice treated with colchicine or vehicle in fed (FED) and 24 h starved (STV). C Quantification of MYTHO-positive puncta co-localizing with LAMP2-cherry in fed (FED) and 24 h starved (STV) mice that were treated with colchicine or vehicle. D Representative images of single FDB fibers from FED or 24 h STV mice treated with colchicine or vehicle that were co-transfected with sh-RNAs against Mytho or scrambled (scrmb) together with cherry-LC3B. Scale bar: 20 µm. E LC3 positive puncta/area were quantified in FED and 24 h STV single FDB fibers from mice treated with colchicine or vehicle for flux measurements (n = 3 mice per condition). Data in B, C, and E were analyzed with two-way ANOVA, and corrections for multiple comparisons were performed with the two-stage step-up method of Benjamini, Krieger, and Yekutieli (∗p < 0.05 and q < 0.1). Data are presented as mean ± SEM (with individual data points). Detailed information on raw data, statistical tests, p values, and q values are provided in the Source Data file. The drawings in A and B were created with BioRender.com.
Fig. 3
Fig. 3. Prolonged MYTHO depletion in skeletal muscle results in excessive growth, impairs muscle contractility, and induces several severe myopathy features.
A Upper panel: schematic representation of the experimental design. Lower left panel: quantification of Mytho mRNA expression in the TA at 3, 6, 12, or 20 weeks post AAV-mediated transduction (sh-RNA scramble or sh-RNA MYTHO). Lower middle panel: TA muscle mass at 3, 6, 12, or 20 weeks post AAV-mediated transduction. Lower right panel: representative image of TA muscle at 12 weeks post-AAV-mediated transduction. Scale bars = 0.5 cm. B Muscle-specific force measured in situ at 3, 6, 12, and 20 weeks post-injection of AAV sh-RNA scramble or AAV sh-RNA MYTHO. C Representative images of succinate dehydrogenase (SDH) histochemistry (upper panel), HE staining (second panel), Masson’s trichrome staining (third panel), and Evans blue staining of TA muscles at 6 weeks post AAV-mediated transduction. Arrows indicate degenerative fibers. Scale bars = 40 μm. D Quantification of Evans blue positive fibers in TA 6 weeks post AAV-injection E, F F4/80+ immunostaining and quantification of F4/80+ positive fibers area in TA 6 and 12 weeks post-injection of AAV sh-RNA scramble or sh-RNA MYTHO. Scale bars = 40 μm. G Quantification of IgG-positive fibers at 6 weeks and 12 weeks post-injection of AAV sh-RNA scramble or AAV sh-RNA MYTHO H Representative images of Laminin/DAPI staining (upper image) and analysis of fiber diameter, number of fibers/animal and % of centronuclear fibers (lower panels) of TA muscles transfected for 12 weeks with AAV sh-RNA scramble or AAV sh-RNA MYTHO. Scale bars = 40 μm. I Representative myosin heavy chain (MHC) immunolabeling and analysis of fiber type proportion and fiber diameter in TA injected with either AAV sh-RNA scramble or AAV sh-RNA MYTHO. Black scale bar = 500 µm, white scale bars = 40 µm. JN RT-qPCR quantification of the mRNA expression of MyoG, Myh8, Myh2, Myh1, and Myh4 in TA muscles transfected with AAV sh-RNA scramble or AAV sh-RNA MYTHO for 3, 6, 12, or 20 weeks. Sample sizes indicated in each graph represent biological replicates. Data in A, B, D and I were analyzed with paired two-tailed t tests (*p < 0.05). Data in F, G, JN were analyzed with two-way ANOVA, and corrections for multiple comparisons were performed with the two-stage step-up method of Benjamini, Krieger, and Yekutieli (∗p < 0.05 and q < 0.1). The min ferret diameter distribution in H was analyzed with two-way ANOVA and corrections for multiple comparisons were performed with the two-stage step-up method of Benjamini, Krieger, and Yekutieli (∗p < 0.05 and q < 0.1). All other comparisons in H were analyzed with paired two-tailed t tests (*p < 0.05). Data are presented as mean ± SEM (with individual data points). Detailed information on raw data, statistical tests, p values, and q values are provided in the Source Data file. The drawing in A was created with BioRender.com.
Fig. 4
Fig. 4. MYTHO depletion induces severe ultrastuctural anormalities.
A Electron micrographs of GAS muscles at 3, 12, and 20 weeks post AAV-mediated transduction of sh-RNA scramble or sh-RNA MYTHO. Ultrastructural analysis reveals abundant tubular aggregates and other cytoplasmic vacuolar material. These ultrastructural defects induced by MYTHO knockdown were observed in all samples examined (n = 4 mice per group). Scale bars = 1 μm. BH is from TA muscles at 12 weeks post AAV-mediated transduction. B, C Representative SERCA2 (red) and STIM1 (green) immunolabeling and analysis of STIM1 positive fibers in TA muscles. Arrows indicate that SERCA2-positive myofibers are the same as STIM1-positive fibers. D Quantification by RT-qPCR of Fam134b mRNA expression in TA muscles. Data were normalized by the geometric mean of 18S, β-actin, and cyclophilin. E Immunoblot detection and corresponding quantification of DESMIN content. F NADH-TR and modified Gomori trichrome (MGT) staining reveal core-like lesions and ragged-red myofibers in muscles with MYTHO knockdown. These defects induced by MYTHO knockdown were observed in all samples examined (n = 4 mice). G, H Representative images of SDH staining and quantification of SDH intensity. Arrows indicate ragged blue/red fibers. I Calcium retention capacity and time to mPTP (mitochondrial permeability transition pore) opening assessed in permeabilized myofibers from GAS muscles at 3, 6, and 20 weeks post AAV-mediated transduction. The number of mice in each group is displayed in each bar. Data in C, D, and H were analyzed with paired two-tailed t tests (*p < 0.05). Data in I were analyzed with two-way ANOVA and corrections for multiple comparisons were performed with the two-stage step-up method of Benjamini, Krieger, and Yekutieli (∗p < 0.05 and q < 0.1). Data are presented as mean ± SEM (with individual data points). Detailed information on raw data, statistical tests, p values, and q values are provided in the Source Data file.
Fig. 5
Fig. 5. MYTHO depletion activates growth signaling.
A Heatmap from microarray showing Gastrocnemius (GAS) muscle gene expression signatures at 12 weeks post AAV-mediated transduction of sh-RNA scramble or sh-RNA MYTHO. Colors indicate relative expression levels; red indicates high expression and gray indicates low expression. B Top ten upregulated (red) and downregulated (blue) pathways upon MYTHO knockdown (MYTHO-KD) as identified through GO enrichment analysis. C Heatmap highlighting selected upregulated genes from the GO annotation “skeletal muscle growth” or from previously published research. D RT-qPCR quantification of the impact of MYTHO knockdown on Igf2 and Mstn, Mt1, and Mt2 mRNA expression in the GAS. β-Actin was used as a reference gene. EG are from TA muscles at 12 weeks post AAV-mediated transduction. E Immunoblot detection and quantification of puromycin incorporation in muscles (in vivo SUnSET technique). F Immunoblot detection and quantification of p-AKT, AKT, p-S6, and S6. G Immunoblot detection and quantification of p62 and LC3II/I accumulation in TA muscle from fed or starved (48 h) mice treated with colchicine or vehicle for flux measurements. Stain-free images were used to normalize protein contents. The number of mice for each group is indicated within bars. Data in D were analyzed with paired one-tailed t tests (*p < 0.05). Data in E were analyzed with paired two-tailed t tests (*p < 0.05). Data in F were analyzed with two-way ANOVA and corrections for multiple comparisons were performed with the two-stage step-up method of Benjamini, Krieger, and Yekutieli (∗p < 0.05 and q < 0.1). Data in G were analyzed with either paired two-tailed t tests to compare the impact of MYTHO-KD in each group or unpaired two-tailed t tests for all other comparisons (∗p < 0.05). Data are presented as mean ± SEM (with individual data points). Detailed information on raw data, statistical tests, p values, and q values are provided in the Source Data file. The drawing in E was created with BioRender.com.
Fig. 6
Fig. 6. Autophagy is dispensable for MYTHO depletion to induce a myopathic phenotype.
A Schematic representation of the experimental design. B TA muscle mass from WT and Atg7iSkM-KO mice at 12 weeks post AAV sh-RNA scramble or AAV sh-RNA MYTHO injections. C Immunoblot detection of various autophagic proteins and corresponding quantifications performed on TA muscle samples from WT and Atg7iSkM-KO mice at 12 weeks post AAV sh-RNA scramble or AAV sh-RNA MYTHO injections. DF Representative images of laminin and DAPI staining and analysis of muscle fiber diameter and a number of fibers with centralized nuclei 12 weeks post AAV injections. Scale bars in D = 50 μm. G Representative images of electron micrographs of the white GAS muscles from Atg7iSkM-KO mice and muscles from WT mice injected with AAV sh-RNA MYTHO showing more severe ultrastructural abnormalities in muscles with MYTHO-KD (n = 2 Atg7iSkM-KO mice and n = 4 mice with MYTHO-KD). White arrows indicate abnormal membrane structures. Yellow arrows indicate electron-dense granular and filamentous aggregates. The area highlighted in blue presents multiple ultrastructural defects including lamellar bodies. TA indicates the accumulation of tubular aggregates (colored in green). Scale bars = 1 μm. The number of mice for each group is indicated within bars. Data in B, C, E, and F were analyzed with two-way ANOVA, and corrections for multiple comparisons were performed with the two-stage step-up method of Benjamini, Krieger, and Yekutieli (∗p < 0.05 and q < 0.1). Data are presented as mean ± SEM (with individual data points). Detailed information on raw data, statistical tests, p values, and q values are provided in the Source Data file. A was created with BioRender.com.
Fig. 7
Fig. 7. Rapamycin treatment ameliorates MYTHO knockdown (MYTHO-KD) induced myopathy.
A Schematic representation of the experimental design. B Immunoblot detection and quantification of MYTHO in TA muscles from mice treated for 3 weeks with rapamycin (Rap) or vehicle at 3 weeks post AAV-mediated transduction. C Quantification of Mytho mRNA expression in muscle assessed by RT-qPCR. Data were normalized by the geometric mean of 18S, β-Actin, and Cyclophilin. D Immunoblots detection and quantification of pS6 and total S6 in TA muscles demonstrating mTORC1 inhibition in mice treated with rapamycin. E TA muscle mass from mice treated with vehicle or rapamycin 6 weeks post AAV-mediated transduction. F in situ assessment of muscle-specific force in AAV sh-RNA scramble and AAV sh-RNA MYTHO injected TA muscles from mice treated with vehicle or rapamycin. G Representative H&E staining, H corresponding analysis of muscle fiber diameter and I proportion of fibers with centralized nuclei in AAV sh-RNA scramble and AAV sh-RNA MYTHO TA muscles from mice treated for 3 weeks with rapamycin or vehicle at 3 weeks post AAV-mediated transduction. Large scale bars = 200 µm, inset scale bar = 100 µm. The number of mice for each group is indicated within bars. Data in BF, H, I were analyzed with two-way ANOVA, and corrections for multiple comparisons were performed with the two-stage step-up method of Benjamini, Krieger, and Yekutieli (∗p < 0.05 and q < 0.1). Data are presented as mean ± SEM (with individual data points). Detailed information on raw data, statistical tests, p values, and q values are provided in the Source Data file. A was created with BioRender.com.
Fig. 8
Fig. 8. Mytho: a novel gene involved in the regulation of autophagy, skeletal muscle mass, and integrity.
Scheme illustrating the role of MYTHO in skeletal muscle homeostasis. Acute MYTHO depletion protects from atrophy in different catabolic conditions (starvation, cancer cachexia, denervation, and sepsis). Prolonged MYTHO depletion in skeletal muscle blunts autophagic flux and triggers a sustained hyperactivation of growth signaling causing a myopathological phenotype, characterized by pathological hypertrophy, myofiber degeneration, impaired force generation, and major ultrastructural abnormalities. KD Knockdown. Created with BioRender.com.

References

    1. Sartori R, Romanello V, Sandri M. Mechanisms of muscle atrophy and hypertrophy: implications in health and disease. Nat. Commun. 2021;12:330. doi: 10.1038/s41467-020-20123-1. - DOI - PMC - PubMed
    1. Milan G, et al. Regulation of autophagy and the ubiquitin–proteasome system by the FoxO transcriptional network during muscle atrophy. Nat. Commun. 2015;6:6670. doi: 10.1038/ncomms7670. - DOI - PMC - PubMed
    1. Stitt TN, et al. The IGF-1/PI3K/Akt pathway prevents expression of muscle atrophy-induced ubiquitin ligases by inhibiting FOXO transcription factors. Mol. Cell. 2004;14:395–403. doi: 10.1016/S1097-2765(04)00211-4. - DOI - PubMed
    1. Sandri M, et al. Foxo transcription factors induce the atrophy-related ubiquitin ligase atrogin-1 and cause skeletal muscle atrophy. Cell. 2004;117:399–412. doi: 10.1016/S0092-8674(04)00400-3. - DOI - PMC - PubMed
    1. Levine B, Kroemer G. Biological functions of autophagy genes: a disease perspective. Cell. 2019;176:11–42. doi: 10.1016/j.cell.2018.09.048. - DOI - PMC - PubMed

Publication types

Substances