. 2023 Mar 2;13(1):3546.
doi: 10.1038/s41598-023-30085-1.

Multidimensional variability in ecological assessments predicts two clusters of suicidal patients

Affiliations

Multidimensional variability in ecological assessments predicts two clusters of suicidal patients

Pablo Bonilla-Escribano et al. Sci Rep. .

Abstract

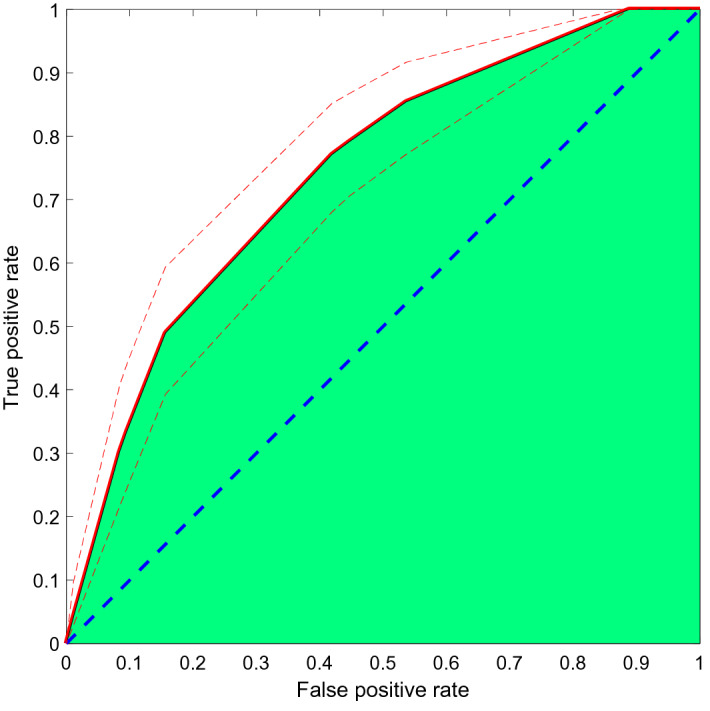
The variability of suicidal thoughts and other clinical factors during follow-up has emerged as a promising phenotype to identify vulnerable patients through Ecological Momentary Assessment (EMA). In this study, we aimed to (1) identify clusters of clinical variability, and (2) examine the features associated with high variability. We studied a set of 275 adult patients treated for a suicidal crisis in the outpatient and emergency psychiatric departments of five clinical centers across Spain and France. Data included a total of 48,489 answers to 32 EMA questions, as well as baseline and follow-up validated data from clinical assessments. A Gaussian Mixture Model (GMM) was used to cluster the patients according to EMA variability during follow-up along six clinical domains. We then used a random forest algorithm to identify the clinical features that can be used to predict the level of variability. The GMM confirmed that suicidal patients are best clustered in two groups with EMA data: low- and high-variability. The high-variability group showed more instability in all dimensions, particularly in social withdrawal, sleep measures, wish to live, and social support. Both clusters were separated by ten clinical features (AUC = 0.74), including depressive symptoms, cognitive instability, the intensity and frequency of passive suicidal ideation, and the occurrence of clinical events, such as suicide attempts or emergency visits during follow-up. Initiatives to follow up suicidal patients with ecological measures should take into account the existence of a high variability cluster, which could be identified before the follow-up begins.


Conflict of interest statement

The authors declare no competing interests.

Figures

Figure 1
Figure 1
Overview of the study. Notice that the main aim of this paper is to find and analyze which clinical and demographic features could be associated with each variability profile. The candidate set of clinical and demographic features (whose possible association to the variability profiles was analyzed) was obtained upon inclusion and at the end of the follow-up. Hence, some longitudinal features were considered by computing the change at those discrete time instances.
Figure 2
Figure 2
Correlation coefficients among the EMA questions. Correlation of the EMA questions after rescaling them from 0 to 100, where 100 represent worse health condition. Lower triangular portion: Kendall correlation coefficients; “–” for negative values. The main diagonal is intentionally empty for clarity. Upper triangular portion: P values of the hypothesis that the corresponding Kendall correlation value is 0; “*” for P values strictly lower than 0.05. The colormap on the right is used for both Kendall correlation coefficients and P values, and ranges from the overall minimum and maximum values of those quantities.
Figure 3
Figure 3
The variability covariances and means of the low-variability group are shown in insets (a,c), respectively. The variability covariances and means of the high-variability group are shown in insets (b,d), respectively. Recall that they measure variability, not absolute values. For simplicity, only the lower triangular and main diagonal region of the variability covariance matrices is shown. Negative covariances indicate that increased variability in one domain is associated with lower variability in the other. The colormaps are the same across the groups to allow visual comparison, and they range from the overall maximum and minimum values of those qualities. Colormaps are shown at the top of each inset.
Figure 4
Figure 4
ROC curve. The AUC is 0.74, with 95% CI [0.68, 0.78], estimated by taking 2000 bootstrap samples. Dashed blue line: random guessing reference. Solid red line: mean ROC curve of the automatic prediction of the high-variability group using the selected random forest and clinical features. Green area: AUC. Dashed red lines: 95% confidence intervals of the ROC curve.
Figure 5
Figure 5
Importance of the ten clinical and demographic features used by the random forest to automatically discriminate patients in the low- and high-variability groups. For clarity, the y-axis is sorted in increasing importance order according to the random forest. The importance is computed by summing all changes in the impurity of the nodes from the parent to the two children thanks to a given clinical feature and its corresponding surrogate splits. Impurity is a measure of how the decisions of a node can separate patients in the low- and high-variability groups and it is measured by the Gini’s diversity index. The sum of impurity changes is normalized by the number of branch nodes.

References

    1. Zalsman G, et al. Suicide prevention strategies revisited: 10-year systematic review. Lancet Psychiatry. 2016;3:646–659. doi: 10.1016/S2215-0366(16)30030-X. - DOI - PubMed
    1. Turecki G, et al. Suicide and suicide risk. Nat. Rev. Dis. Primer. 2019;5:1–22. doi: 10.1038/s41572-019-0121-0. - DOI - PubMed
    1. Wang SB, et al. A pilot study using frequent inpatient assessments of suicidal thinking to predict short-term postdischarge suicidal behavior. JAMA Netw. Open. 2021;4:e210591. doi: 10.1001/jamanetworkopen.2021.0591. - DOI - PMC - PubMed
    1. Davidson CL, Anestis MD, Gutierrez PM. Ecological momentary assessment is a neglected methodology in suicidology. Arch. Suicide Res. 2017;21:1–11. doi: 10.1080/13811118.2015.1004482. - DOI - PubMed
    1. Sedano-Capdevila A, Porras-Segovia A, Bello HJ, Baca-García E, Barrigon ML. Use of ecological momentary assessment to study suicidal thoughts and behavior: A systematic review. Curr. Psychiatry Rep. 2021;23:41. doi: 10.1007/s11920-021-01255-7. - DOI - PubMed

Publication types