

Hot moment of N2O emissions in seasonally frozen peatlands
- PMID: 36864114
- PMCID: PMC10203296
- DOI: 10.1038/s41396-023-01389-x
Hot moment of N2O emissions in seasonally frozen peatlands
Abstract
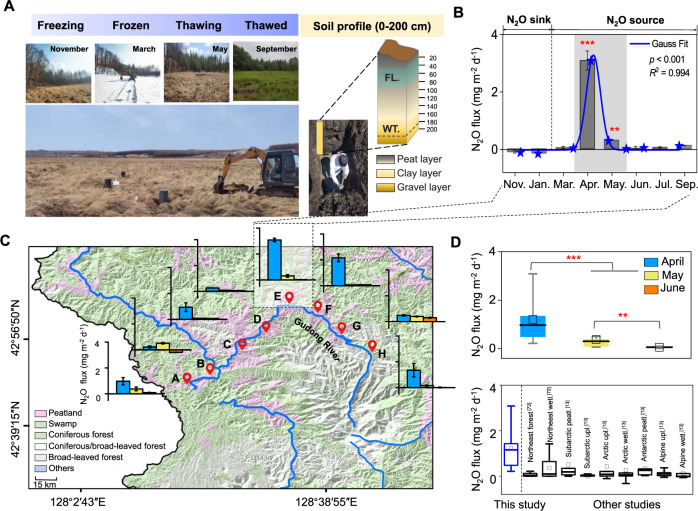
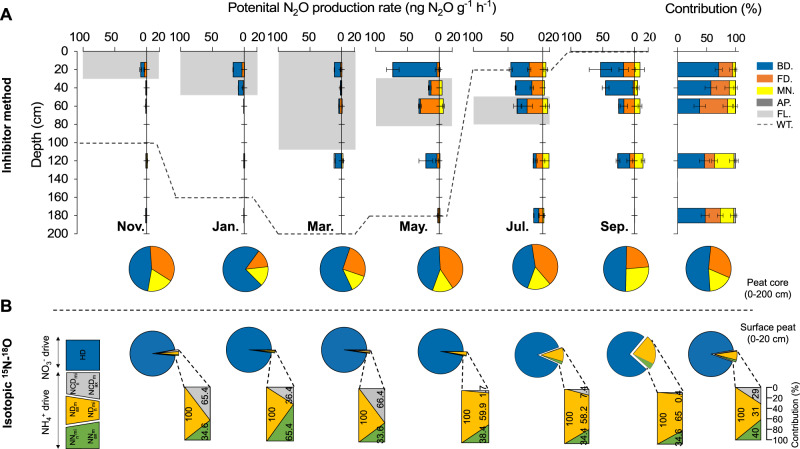
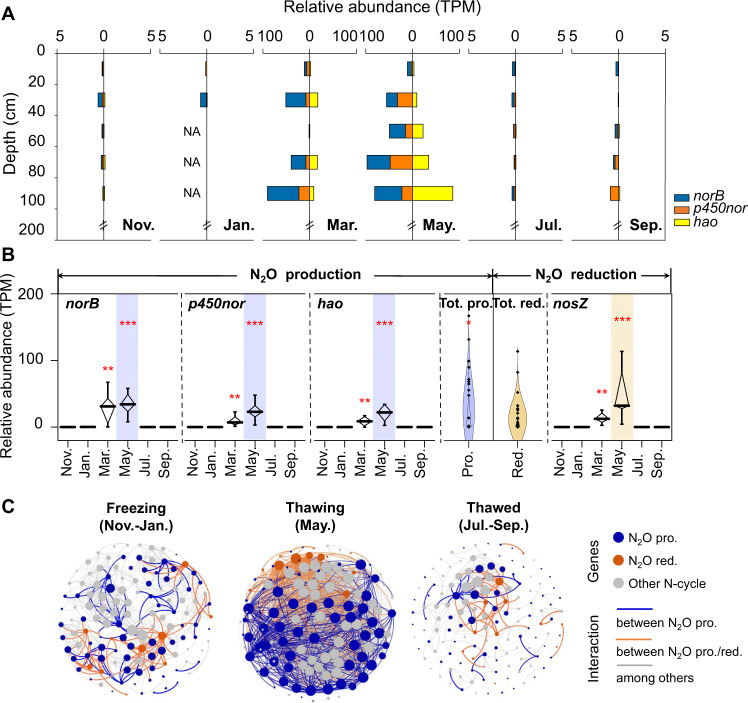
Since the start of the Anthropocene, northern seasonally frozen peatlands have been warming at a rate of 0.6 °C per decade, twice that of the Earth's average rate, thereby triggering increased nitrogen mineralization with subsequent potentially large losses of nitrous oxide (N2O) to the atmosphere. Here we provide evidence that seasonally frozen peatlands are important N2O emission sources in the Northern Hemisphere and the thawing periods are the hot moment of annual N2O emissions. The flux during the hot moment of thawing in spring was 1.20 ± 0.82 mg N2O m-2 d-1, significantly higher than that during the other periods (freezing, -0.12 ± 0.02 mg N2O m-2 d-1; frozen, 0.04 ± 0.04 mg N2O m-2 d-1; thawed, 0.09 ± 0.01 mg N2O m-2 d-1) or observed for other ecosystems at the same latitude in previous studies. The observed emission flux is even higher than those of tropical forests, the World's largest natural terrestrial N2O source. Furthermore, based on soil incubation with 15N and 18O isotope tracing and differential inhibitors, heterotrophic bacterial and fungal denitrification was revealed as the main source of N2O in peatland profiles (0-200 cm). Metagenomic, metatranscriptomic, and qPCR assays further revealed that seasonally frozen peatlands have high N2O emission potential, but thawing significantly stimulates expression of genes encoding N2O-producing protein complexes (hydroxylamine dehydrogenase (hao) and nitric oxide reductase (nor)), resulting in high N2O emissions during spring. This hot moment converts seasonally frozen peatlands into an important N2O emission source when it is otherwise a sink. Extrapolation of our data to all northern peatland areas reveals that the hot moment emissions could amount to approximately 0.17 Tg of N2O yr-1. However, these N2O emissions are still not routinely included in Earth system models and global IPCC assessments.
© 2023. The Author(s), under exclusive licence to International Society for Microbial Ecology.
Conflict of interest statement
The authors declare no competing interests.
Figures
Similar articles
-
Comprehensive assessment of nitrous oxide emissions and mitigation potentials across European peatlands.Environ Pollut. 2022 May 15;301:119041. doi: 10.1016/j.envpol.2022.119041. Epub 2022 Feb 22. Environ Pollut. 2022. PMID: 35217134 Review.
-
Effects of short-term freezing on nitrous oxide emissions and enzyme activities in a grazed pasture soil after bovine-urine application.Sci Total Environ. 2020 Oct 20;740:140006. doi: 10.1016/j.scitotenv.2020.140006. Epub 2020 Jun 6. Sci Total Environ. 2020. PMID: 32563873
-
Responses of nitrous oxide fluxes to autumn freeze-thaw cycles in permafrost peatlands of the Da Xing'an Mountains, Northeast China.Environ Sci Pollut Res Int. 2022 May;29(21):31700-31712. doi: 10.1007/s11356-022-18545-z. Epub 2022 Jan 11. Environ Sci Pollut Res Int. 2022. PMID: 35013975
-
Hot moments drive extreme nitrous oxide and methane emissions from agricultural peatlands.Glob Chang Biol. 2021 Oct;27(20):5141-5153. doi: 10.1111/gcb.15802. Epub 2021 Jul 28. Glob Chang Biol. 2021. PMID: 34260788
-
[Research advances in the response of soil nitrogen emissions from peatlands to climate warming and drying].Ying Yong Sheng Tai Xue Bao. 2024 Jun;35(6):1725-1734. doi: 10.13287/j.1001-9332.202406.030. Ying Yong Sheng Tai Xue Bao. 2024. PMID: 39235032 Review. Chinese.
Cited by
-
Metabolic labour division trade-offs in denitrifying microbiomes.ISME J. 2025 Jan 2;19(1):wraf020. doi: 10.1093/ismejo/wraf020. ISME J. 2025. PMID: 39903699 Free PMC article. Review.
-
Long-term multi-meta-omics resolves the ecophysiological controls of seasonal N2O emissions during wastewater treatment.Nat Water. 2025;3(5):590-604. doi: 10.1038/s44221-025-00430-x. Epub 2025 May 7. Nat Water. 2025. PMID: 40417422 Free PMC article.
-
Climate warming fuels the global antibiotic resistome by altering soil bacterial traits.Nat Ecol Evol. 2025 Aug;9(8):1512-1526. doi: 10.1038/s41559-025-02740-5. Epub 2025 Jun 4. Nat Ecol Evol. 2025. PMID: 40468041
-
Microbial mechanisms underlying the reduction of N2O emissions from submerged plant covered system.Water Res X. 2025 Feb 7;28:100314. doi: 10.1016/j.wroa.2025.100314. eCollection 2025 Sep 1. Water Res X. 2025. PMID: 40007796 Free PMC article.
-
Nitrification in acidic and alkaline environments.Essays Biochem. 2023 Aug 11;67(4):753-768. doi: 10.1042/EBC20220194. Essays Biochem. 2023. PMID: 37449414 Free PMC article. Review.
References
-
- Loisel JL, Yu ZC, Beilman DW, Camill P, Alm J, Amesbury MJ, et al. A database and synthesis of northern peatland soil properties and Holocene carbon and nitrogen accumulation. Holocene. 2014;24:1028–42. doi: 10.1177/0959683614538073. - DOI
-
- Frolking S, Talbot J, Jones MC, Treat CC, Kauffman JB, Tuittila E-S, et al. Peatlands in the Earth’s 21st century climate system. Environ Rev. 2011;19:371–96. doi: 10.1139/a11-014. - DOI
-
- Yu Z, Loisel JL, Brosseau DP, Beilman DW, Hunt SJ. Global peatland dynamics since the Last Glacial Maximum. Geophys Res Lett. 2010;37:13402. doi: 10.1029/2010GL043584. - DOI
Publication types
MeSH terms
Substances
LinkOut - more resources
Full Text Sources
Miscellaneous
