. 2023 May;30(5):1305-1319.
doi: 10.1038/s41418-023-01140-1. Epub 2023 Mar 2.

Targeting TACC3 represents a novel vulnerability in highly aggressive breast cancers with centrosome amplification

Affiliations

Targeting TACC3 represents a novel vulnerability in highly aggressive breast cancers with centrosome amplification

Ozge Saatci et al. Cell Death Differ. 2023 May.

Abstract

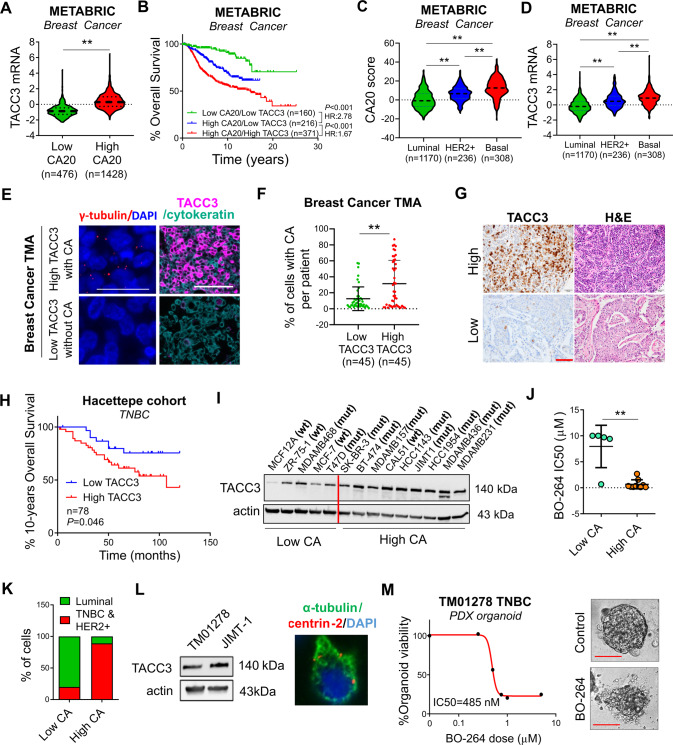
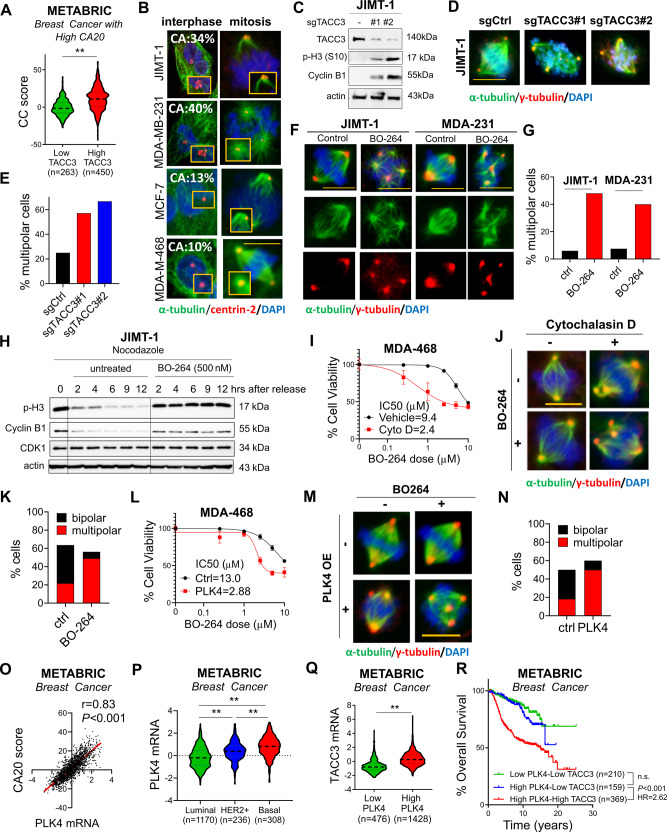
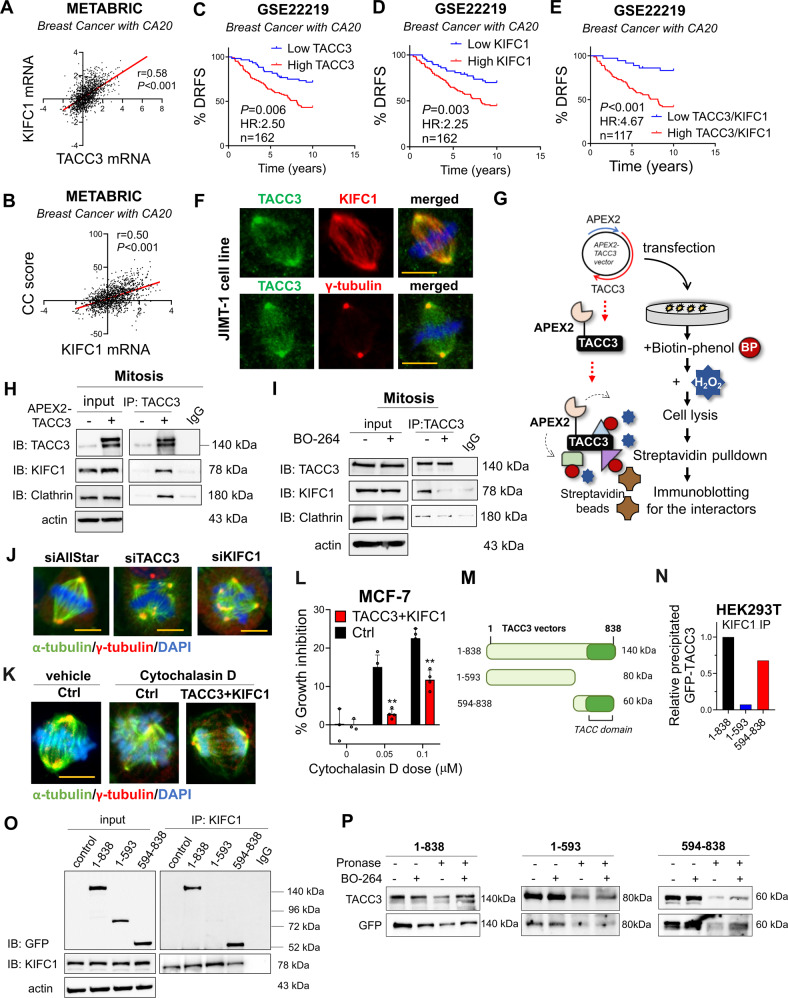
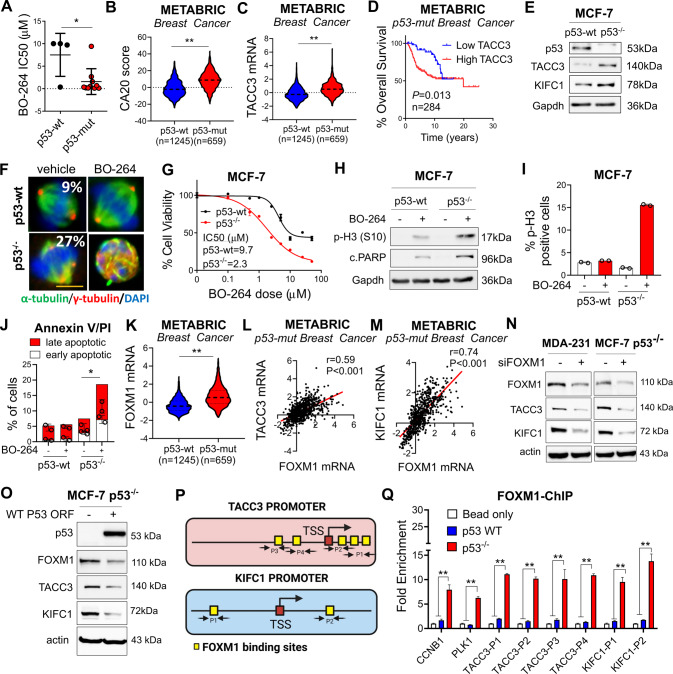
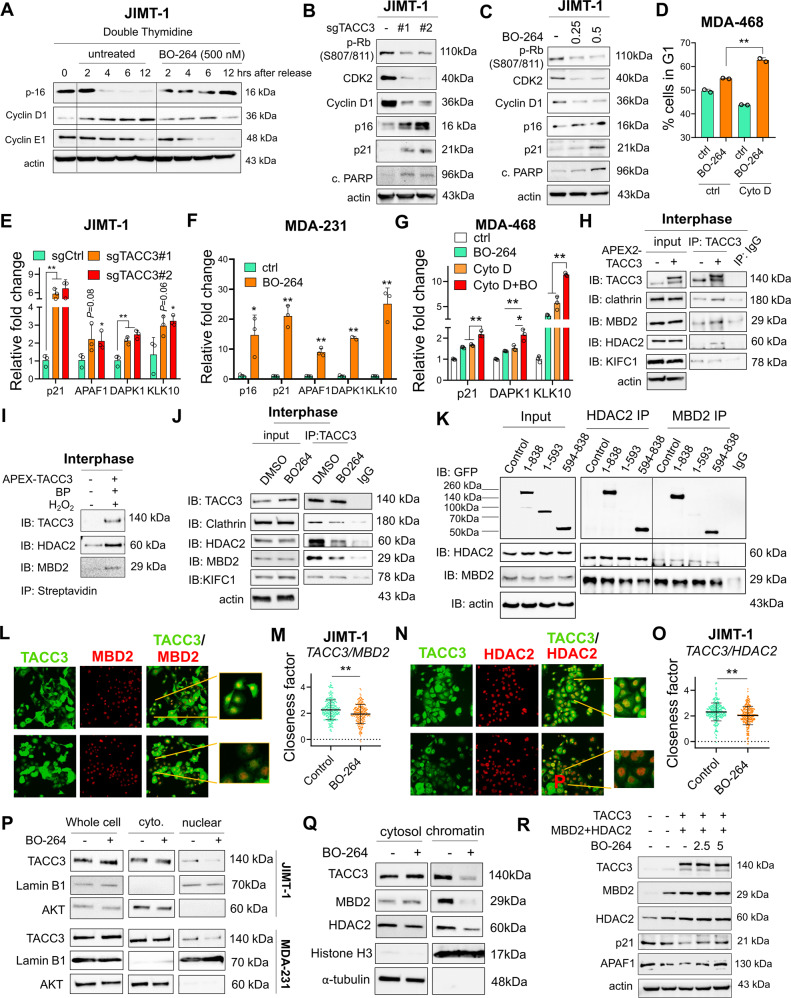
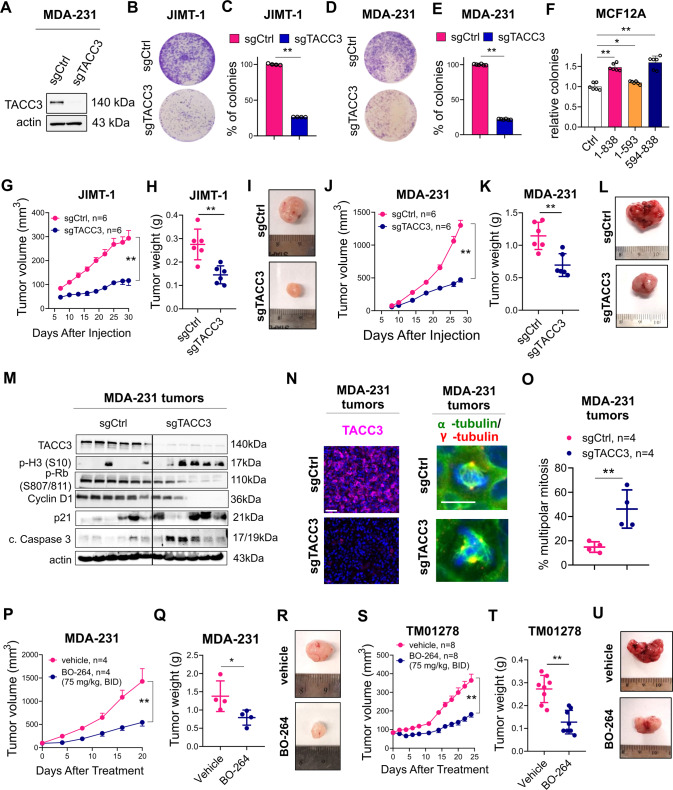
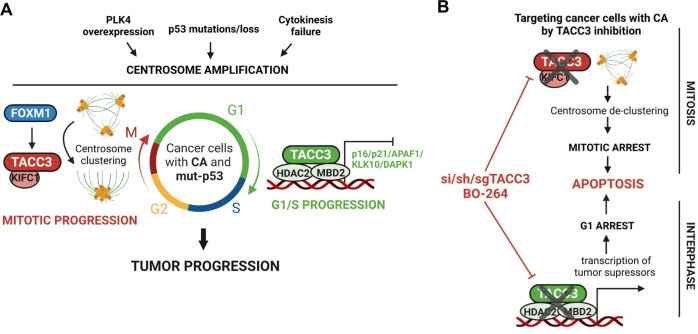
Centrosome amplification (CA) is a hallmark of cancer that is strongly associated with highly aggressive disease and worse clinical outcome. Clustering extra centrosomes is a major coping mechanism required for faithful mitosis of cancer cells with CA that would otherwise undergo mitotic catastrophe and cell death. However, its underlying molecular mechanisms have not been fully described. Furthermore, little is known about the processes and players triggering aggressiveness of cells with CA beyond mitosis. Here, we identified Transforming Acidic Coiled-Coil Containing Protein 3 (TACC3) to be overexpressed in tumors with CA, and its high expression is associated with dramatically worse clinical outcome. We demonstrated, for the first time, that TACC3 forms distinct functional interactomes regulating different processes in mitosis and interphase to ensure proliferation and survival of cancer cells with CA. Mitotic TACC3 interacts with the Kinesin Family Member C1 (KIFC1) to cluster extra centrosomes for mitotic progression, and inhibition of this interaction leads to mitotic cell death via multipolar spindle formation. Interphase TACC3 interacts with the nucleosome remodeling and deacetylase (NuRD) complex (HDAC2 and MBD2) in nucleus to inhibit the expression of key tumor suppressors (e.g., p21, p16 and APAF1) driving G1/S progression, and its inhibition blocks these interactions and causes p53-independent G1 arrest and apoptosis. Notably, inducing CA by p53 loss/mutation increases the expression of TACC3 and KIFC1 via FOXM1 and renders cancer cells highly sensitive to TACC3 inhibition. Targeting TACC3 by guide RNAs or small molecule inhibitors strongly inhibits growth of organoids and breast cancer cell line- and patient-derived xenografts with CA by induction of multipolar spindles, mitotic and G1 arrest. Altogether, our results show that TACC3 is a multifunctional driver of highly aggressive breast tumors with CA and that targeting TACC3 is a promising approach to tackle this disease.


Conflict of interest statement

OS, BC, and EB are the co-founders of OncoCube Therapeutics LLC, developing TACC3 inhibitors. OS is the founder and president of LoxiGen, Inc, developing lysyl oxidase inhibitors. The other authors declare no potential conflict of interest.

Figures

Fig. 1
Fig. 1. TACC3 correlates with disease aggressiveness in patients with CA and breast cancer cells/organoids with CA are highly sensitive to TACC3 inhibition.
A TACC3 mRNA expression in breast cancer tumors in the METABRIC dataset with low vs. high CA20 score. B Survival analyses in breast cancer patients based on CA20 score and TACC3 expression. C, D Expression of CA20 score (C) and TACC3 mRNA (D) in different breast cancer subtypes in METABRIC dataset. E Representative IF images of breast tumors with or without CA (shown by γ-tubulin in red) with high vs. low TACC3 (magenta) expression from tissue microarray (BR1902, TissueArray). The epithelial marker, cytokeratin is shown in cyan and the nuclear marker, DAPI is shown in blue. Scale bar = 25 µm for γ-tubulin images and 50 µm for TACC3 + cytokeratin. F Percent of cells with CA per patient in low vs. high TACC3 protein-expressing tumors from tissue microarray (BR1902, TissueArray). G Immunohistochemistry staining of TACC3 and H&E staining in TNBC patients from Hacettepe cohort, showing representative low vs. high TACC3-expressers. Scale bar = 100 µm. H Kaplan Meier survival analysis showing 10-years overall survival in TNBC patients from Hacettepe cohort, separated based on median TACC3 protein expression. I TACC3 expression in a panel of breast cancer cell lines with CA and without CA. The red vertical line is added to show low vs. high CA cell lines. wt: p53 wild type, mut: p53 mutant. J Sensitivity of breast cancer cell lines from I to TACC3 inhibitor, BO-264 with respect to CA status. K Percentage of breast cancer cell lines from I belonging to TNBC and HER2 + subtype vs. luminal subtype based on CA status. L Western blot analysis of TACC3 in TNBC PDX TM01278 organoids in comparison with JIMT-1 cells (left panel) and α-tubulin (green) and centrin 2 (red) staining in TM01278 organoids showing CA (right panel). M Dose-response curve of TM01278 organoids upon BO-264 treatment for 1 week. The representative images are provided on the right panel. Scale bar = 100 µm. Actin is used as a loading control in all blots. CA Centrosome amplification, HR Hazard ratio.
Fig. 2
Fig. 2. TACC3 correlates with centrosome clustering (CC) in patients with CA and mediates CC in cells with CA.
A Expression of CC score in breast tumors with high CA20 expression from METABRIC with low vs. high TACC3 expression. B CA status (as % of cell population) of breast cancer cell lines determined by centrin-2 (red) and α-tubulin (green) in interphase and mitosis. Scale bar = 10 µm. C Western blot analysis of TACC3 and the mitotic arrest markers, p-H3 (S10) and Cyclin B1 in JIMT-1.sgCtrl vs. sgTACC3 cells. D Multipolar spindle formation in JIMT-1.sgCtrl vs. sgTACC3 cells as shown by α- (spindle, green) and γ- (centrosome, red) tubulin staining. Scale bar = 10 µm. E Quantification of mitotic cells with multipolar spindles from D. F Multipolar spindle formation in BO-264-treated JIMT-1 and MDA-MB-231 (MDA-231, here and for all figures) cells as shown by α- (spindle, green) and γ- (centrosome, red) tubulin staining. Scale bar=10 µm. G Quantification of mitotic cells with multipolar spindles from F. H Western blot analysis of mitosis markers in JIMT-1 cells synchronized at mitosis using nocodazole followed by release into fresh vs. BO-264-containing media. I Dose response curve of MDA-MB-468 (MDA-468, here and for all figures) cells 72 h after treatment with BO-264 upon CA induction with 1 µM of cytochalasin D for 20 h. J IF staining of α- (green) and γ- (red) tubulin in MDA-MB-468 cells treated with 1 µM of cytochalasin D for 20 h followed by 24 h treatment with 5 µM BO-264. Scale bar = 10 µm. K Quantification of mitotic cells with multipolar spindles from J. L BO-264 dose response curve of MDA-MB-468 cells transfected with control vector or PLK4 to induce CA. M IF staining of α- (green) and γ- (red) tubulin in MDA-MB-468 cells transfected with control or PLK4 vector for 24 h followed by treatment with 5 µM BO-264 for an additional 24 h. Scale bar = 10 µm. N Quantification of mitotic cells with multipolar spindles from M. O Correlation of PLK4 expression with CA20 score in breast cancer patients from METABRIC. P Expression of PLK4 in different breast cancer subtypes in METABRIC dataset. Q TACC3 mRNA expression in breast cancer tumors with low vs. high PLK4 expression. R Survival analyses in breast cancer patients based on PLK4 and TACC3 expression. CC centrosome clustering.
Fig. 3
Fig. 3. KIFC1 is a novel TACC3 binding protein that is involved in TACC3-mediated CC.
A, B Correlation of KIFC1 mRNA expression with TACC3 (A) and CC score (B) in breast cancer patients with high CA20 expression in METABRIC dataset. CE Distant relapse-free survival (DRFS) analyses in breast cancer patients with high CA20 expression based on TACC3 or KIFC1 or their combination in GSE22219 dataset. F IF staining of TACC3 (green)/KIFC1 or γ-tubulin (red) in JIMT-1 cells, showing colocalization at the centrosomes. Scale bar = 10 µm. G APEX2 proximity ligation assay to show binding of TACC3 to its interactors. H Western blotting of KIFC1 and the known interactor, clathrin upon TACC3 pulldown in APEX2-TACC3 overexpressing mitotic JIMT-1 cells. I IP of endogenous TACC3 and its interactors, KIFC1 and clathrin in JIMT-1 cells synchronized at mitosis and treated with BO-264 for 4 h (5 µM). J IF staining of α- (green) and γ- (red) tubulin in JIMT-1 cells transfected with siTACC3 or siKIFC1 (100 nM) for 48 h. Scale bar = 10 µm. K IF staining of α- (green) and γ- (red) tubulin in MCF-7 cells upon TACC3 + KIFC1 overexpression followed by CA induction with cytochalasin D. Scale bar = 10 µm. L Percent growth inhibition in MCF-7 cells upon TACC3/KIFC1 overexpression followed by CA induction with cytochalasin D. M A scheme of different truncated vectors of TACC3. N Quantification of the band intensities from O. O IP of KIFC1 and immunoblotting (IB) with GFP antibody in mitotic HEK293T cells transfected with GFP-labelled vectors of different regions of TACC3. 1-838: full length, 1-593: N-terminus, 594-838; C-terminus. P DARTS assay showing binding of BO-264 to the C-terminal TACC domain of TACC3.
Fig. 4
Fig. 4. p53 loss/mutation increases the expression of TACC3 and KIFC1 via FOXM1 and renders cancer cells highly sensitive to TACC3 inhibition.
A BO-264 IC50 values in breast cancer cell lines from Fig. 1I, separated based on their p53 mutational status. B, C CA20 score (B) and TACC3 (C) expression in p53-wt vs. p53-mut breast cancer patients in METABRIC dataset. D Survival analyses in p53-mut breast cancer patients based on TACC3 expression in METABRIC dataset. E Western blot analysis of p53, TACC3 and KIFC1 in MCF-7 p53-wt vs p53−/− cells. F IF staining of α- (green) and γ- (red) tubulin in MCF-7 p53-wt vs p53−/− cells treated with 5 µM of BO-264. Scale bar = 10 µm. G Dose response curve of MCF-7 p53-wt vs p53−/− cells treated with BO-264 for 72 h. H Western blot analysis of the mitotic arrest marker, p-H3 (S10) and apoptosis marker, cleaved PARP in MCF-7 WT vs. p53−/− cells treated with 2 µM of BO-264. I, J Flow cytometry analysis of p-H3 (I) and Annexin V/PI staining (J) in cells from G. K FOXM1 mRNA expression in p53-wt vs. p53-mut breast cancer patients from METABRIC. L, M Correlation of FOXM1 mRNA with TACC3 (L) and KIFC1 (M) expression in p53-mut breast cancer patients from METABRIC. N Western blot analysis of FOXM1, KIFC1 and TACC3 in siFOXM1-transfected MDA-MB-231 and MCF-7 p53−/− cells. O Western blot analysis of p53, FOXM1, KIFC1 and TACC3 in MCF-7 p53−/− cells transfected with wt p53 ORF. P A scheme showing the predicted binding FOXM1 sites (yellow squares) and regions targeted by primers (P1-P4 for TACC3 and P1-P2 for KIFC1) on TACC3 and KIFC1 promoters. TSS Transcription start site. Q FOXM1 ChIP assay in MCF-7 p53-wt and p53−/− cells.
Fig. 5
Fig. 5. TACC3 interacts with the members of the nucleosome remodeling and deacetylase (NuRD) complex in interphase cells and inhibition of this interaction leads to G1 arrest and apoptosis.
A Western blot analysis of G1/S progression markers and CDK inhibitor in JIMT-1 cells synchronized at G1 using double thymidine block followed by release into fresh vs. BO-264-containing media. B Western blot analysis of G1/S progression markers, CDK inhibitors and apoptosis in JIMT-1 sgCtrl and sgTACC3 cells. C Western blot analysis of G1/S progression markers, CDK inhibitors and apoptosis in JIMT-1 cells treated with 0.25 and 0.5 µM of BO-264. D Flow cytometry analysis with DAPI staining in MDA-MB-468 cells treated with 1 µM of cytochalasin D to induce CA followed by 24 h of 5 µM BO-264. E qRT-PCR analysis of NuRD complex targets in JIMT-1 sgTACC3 cells. F and G qRT-PCR analysis of NuRD complex targets in MDA-MB-231 cells (F) and MDA-MB-468 cells upon CA induction by cytochalasin D (G) under BO-264 treatment. H Western blot analysis of TACC3 interactors upon TACC3 pulldown in APEX2-TACC3 overexpressing interphase synchronized JIMT-1 cells. I Western blot analysis of TACC3 interactors upon biotinylation by H2O2 followed by streptavidin pulldown in interphase synchronized JIMT-1 cells. J IP of endogenous TACC3 and its interactors in JIMT-1 cells synchronized at interphase and treated with BO-264 (5 µM) for 4 h. K IP of HDAC2 or MBD2, and IB with GFP antibody in HEK293T cells transfected with GFP-labelled vectors of different regions of TACC3. 1-838: full length, 1-593: N-terminus, 594-838; C-terminus. L, M IF staining of TACC3 (green) and MBD2 (red) in JIMT-1 cells treated with BO-264 (L) and the closeness factor showing decrease in colocalization upon BO-264 treatment (M). N, O IF staining of TACC3 (green) and HDAC2 (red) in JIMT-1 cells treated with BO-264 (N) and the closeness factor showing decrease in colocalization upon BO-264 treatment (O). P Western blot analysis of TACC3 in cytoplasmic and nuclear fractions of interphase-synchronized JIMT-1 and MDA-MB-231 cells treated with 5 µM BO-264 for 6 h. Lamin B1 and AKT were used as nuclear and cytoplasmic markers, respectively. Q Western blot analysis of TACC3, and NuRD members in cytoplasmic and chromatin fractions of JIMT-1 cells treated with 5 µM BO-264 for 4 h. R Western blot analysis of TACC3, and NuRD members/targets in SK-BR-3 cells transfected with the overexpression vectors and treated with increasing doses of BO-264.
Fig. 6
Fig. 6. Targeting TACC3 inhibits tumor growth in centrosome-amplified breast tumors in vivo.
A Western blot validation of CRISPR/Cas9-mediated knockout of TACC3 in MDA-MB-231 cells. B–E The effect of TACC3 knockout on colony formation in JIMT-1 (B, C) and MDA-MB-231 (D, E) cells. F Relative colony formation ability of MCF12A cells overexpressing different regions of TACC3. 1-838: full length, 1-593: N-terminus, 594-838; C-terminus. G–I Tumor growth (G) in xenografts of JIMT-1 sgCtrl vs. sgTACC3 cells, and the tumor weights and representative images at the end of the experiment (H, I). JL Tumor growth (J) in xenografts of MDA-MB-231 sgCtrl vs. sgTACC3 cells, and the tumor weights and representative images at the end of the experiment (K, L). M Western blot analysis of TACC3, mitotic progression and G1/S progression markers, CDK inhibitor and apoptosis in MDA-MB-231 xenografts from J. N IF staining of TACC3 (magenta), α- (green) and γ- (red) tubulin in MDA-MB-231 xenografts from J. Scale bar = 40 µm for TACC3 and 20 µm α- and γ-tubulin. O Quantification of multipolar mitosis in MDA-MB-231 xenografts from J. P Tumor growth in xenografts of MDA-MB-231 cells treated with 75 mg/kg BO-264, twice daily (p.o.). Q, R The tumor weights (Q) and representative images (R) from vehicle vs. BO-264 treated mice from P at the end of the experiment. S Tumor growth of TNBC PDXs, TM01278 treated with 75 mg/kg BO-264, twice daily (p.o.). T, U The tumor weights (T) and representative images (U) from vehicle vs. BO-264 treated mice from S in the end of the experiment.
Fig. 7
Fig. 7. Schematic summary of the findings.
A In cancer cells with CA that can be induced upon PLK4 overexpression, p53 modulation or cytokinesis failure, TACC3 is overexpressed and mediates distinct mitosis and interphase-specific functions to promote cell cycle and tumor progression. Mitotic TACC3 interacts with KIFC1 at the centrosomes and promotes CC to ensure mitotic progression and inhibition of apoptosis. FOXM1 mediates the transcription of TACC3 and KIFC1 during mitosis in p53−/− or mutant cells. Interphase TACC3 interacts with MBD2 and HDAC2, belonging to the NuRD complex, to suppress the transcription of tumor suppressors (i.e., p16, p21, APAF1, KLK10 and DAPK1) and ensures G1/S transition. B Upon TACC3 targeting by a TACC3 inhibitor, BO-264 or si/sh/sgRNAs in cancer cells with CA, while loss of TACC3/KIFC1 interaction at the centrosomes of mitotic cells leads to centrosome de-clustering and mitotic cell death, loss of TACC3/HDAC2/MBD2 interaction at the nucleus of G1 cells leads to transcriptional activation of tumor suppressors to cause G1 arrest and apoptosis that overall culminates in inhibition of tumor growth.

References

    1. Marteil G, Guerrero A, Vieira AF, de Almeida BP, Machado P, Mendonca S, et al. Over-elongation of centrioles in cancer promotes centriole amplification and chromosome missegregation. Nat Commun. 2018;9:1258. doi: 10.1038/s41467-018-03641-x. - DOI - PMC - PubMed
    1. Mittal K, Kaur J, Jaczko M, Wei G, Toss MS, Rakha EA, et al. Centrosome amplification: a quantifiable cancer cell trait with prognostic value in solid malignancies. Cancer Metastasis Rev. 2021;40:319–39. doi: 10.1007/s10555-020-09937-z. - DOI - PMC - PubMed
    1. Godinho SA, Picone R, Burute M, Dagher R, Su Y, Leung CT, et al. Oncogene-like induction of cellular invasion from centrosome amplification. Nature. 2014;510:167–71. doi: 10.1038/nature13277. - DOI - PMC - PubMed
    1. Harrison LE, Bleiler M, Giardina C. A look into centrosome abnormalities in colon cancer cells, how they arise and how they might be targeted therapeutically. Biochem Pharmacol. 2018;147:1–8. doi: 10.1016/j.bcp.2017.11.003. - DOI - PMC - PubMed
    1. Ganem NJ, Godinho SA, Pellman D. A mechanism linking extra centrosomes to chromosomal instability. Nature. 2009;460:278–82. doi: 10.1038/nature08136. - DOI - PMC - PubMed

Publication types

MeSH terms