. 2023 Mar;22(3):391-399.
doi: 10.1038/s41563-023-01481-9. Epub 2023 Mar 2.

P-selectin-targeted nanocarriers induce active crossing of the blood-brain barrier via caveolin-1-dependent transcytosis

Affiliations

P-selectin-targeted nanocarriers induce active crossing of the blood-brain barrier via caveolin-1-dependent transcytosis

Daniel E Tylawsky et al. Nat Mater. 2023 Mar.

Abstract

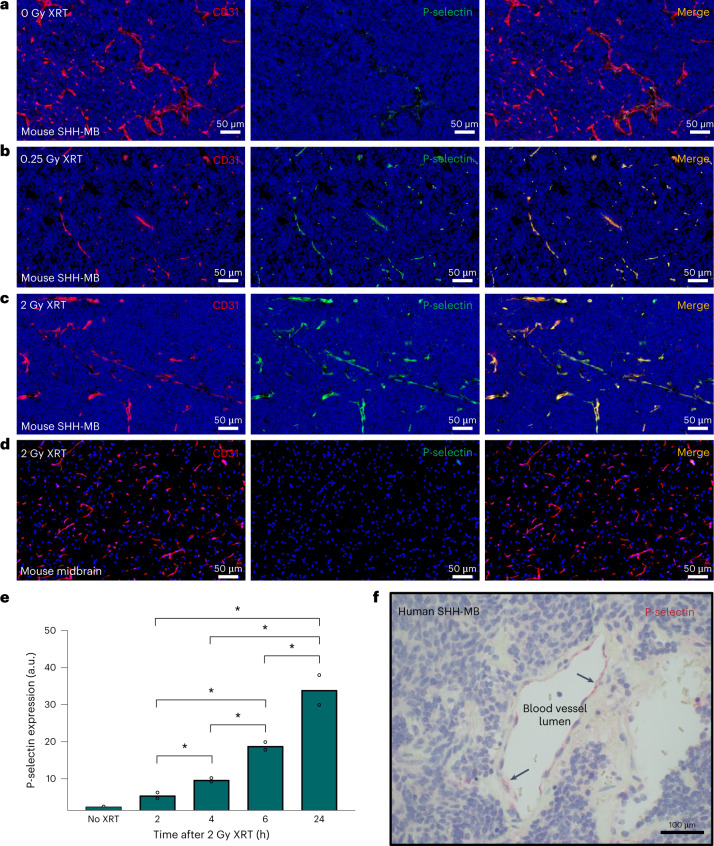
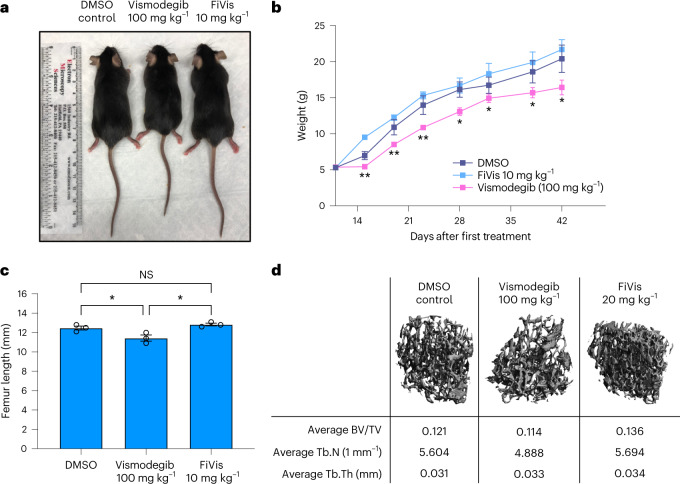
Medulloblastoma is the most common malignant paediatric brain tumour, with ~30% mediated by Sonic hedgehog signalling. Vismodegib-mediated inhibition of the Sonic hedgehog effector Smoothened inhibits tumour growth but causes growth plate fusion at effective doses. Here, we report a nanotherapeutic approach targeting endothelial tumour vasculature to enhance blood-brain barrier crossing. We use fucoidan-based nanocarriers targeting endothelial P-selectin to induce caveolin-1-dependent transcytosis and thus nanocarrier transport into the brain tumour microenvironment in a selective and active manner, the efficiency of which is increased by radiation treatment. In a Sonic hedgehog medulloblastoma animal model, fucoidan-based nanoparticles encapsulating vismodegib exhibit a striking efficacy and marked reduced bone toxicity and drug exposure to healthy brain tissue. Overall, these findings demonstrate a potent strategy for targeted intracranial pharmacodelivery that overcomes the restrictive blood-brain barrier to achieve enhanced tumour-selective penetration and has therapeutic implications for diseases within the central nervous system.


Conflict of interest statement

D.A.H. is a cofounder and officer with equity interest of Selectin Therapeutics, Inc., Resident Diagnostics, Inc. and Lime Therapeutics, Inc., as well as a member of the scientific advisory board of Concarlo Therapeutics, Inc., Nanorobotics Inc. and Mediphage Bioceuticals, Inc. D.A.H. and Y.S. are inventors of a related patent, ‘Fucoidan nanogels and methods of their use and manufacture’, US patent no. 9,737,614 issued 7 July 2016 to MSKCC. G.P.R. is a cofounder and officer with equity interest of Selectin Therapeutics, Inc., as well as a member of the scientific and medical advisory board of Sapience Therapeutics, Inc. The remaining authors declare no competing interests.

Figures

Fig. 1
Fig. 1. Low-dose irradiation induces P-selectin expression on tumour vasculature in medulloblastoma.
ac, Immunofluorescence of P-selectin (green) and vasculature (CD31, red) in SHH-MB brain tumour tissues in nonirradiated mice (a), 4 h after 0.25 Gy XRT (b) and 4 h after 2 Gy XRT (c). d, Immunofluorescence of adjacent nontumour tissue taken from the midbrain region of whole-body-irradiated, tumour-bearing mice. e, Time course of P-selectin expression in SHH-MB tumour tissue following 2 Gy XRT, quantified from immunoblot analysis. n = 2 mice per group; *P < 0.05 (two-tailed t-test). Data are means ± s.e.m. f, Representative human SHH-MB tumour tissue immunostained (red) for P-selectin expression. Haematoxylin counterstaining (blue) indicates MB tumour tissue. Source data
Fig. 2
Fig. 2. P-selectin-targeted nanoparticles preferentially target SHH-MB tumours following low-dose irradiation.
a, Atomic force micrograph of FiVis nanoparticles. b, DLS data showing average size of FiVis nanoparticles (as quantified by intensity distribution). PDI, polydispersity index; d, diameter. c, Zeta potential measurements of FiVis nanoparticles. d, Representative near-infrared images (dorsal view) of brains from WT and SHH-MB mice administered FiVis nanoparticles. n = 3 mice per group in each of two independent experiments. e, Top, near-infrared fluorescence intensities of FiVis nanoparticles in tumour regions (cerebellum) and nontumour regions (forebrain) of WT, SHH-MB and P-selectin (SELP) null SHH-MB mice. Bottom, representative dorsal images of brains, demarcated by cerebellum and forebrain (yellow) for quantification. n = 3 mice per group; *P < 0.05, **P < 0.01, ***P < 0.001 (two-tailed t-test); NS, not significant. f, Liquid chromatography–tandem mass spectrometry quantification of vismodegib in cerebellar and forebrain tissue of mice treated with 0.25 Gy XRT and 10 mg kg–1 FiVis. n = 5 mice per group; *P < 0.05, P = .0424 (paired, two-tailed t-test). e,f, Data are means ± s.e.m. Source data
Fig. 3
Fig. 3. Passage of FiVis nanoparticles across the BBB is mediated by Cav1.
ac, Immunofluorescence of Cav1 (white) and CD31 (green) in advanced SHH-MB mouse tumours following treatment with 0.25 Gy XRT + FiVis (a), FiVis only (b) or XRT only (c). d, Uptake of FiVis nanoparticles (NP) into bEnd.3 cells following pretreatment with pharmacological inhibitors of endocytosis pathways, as measured by flow cytometry. Uptake was compared to that in a group of cells administered nanoparticles but no inhibitor. Data are means ± s.e.m. n = 3 biologically independent samples; ***P < 0.001, ****P < 0.001 (one-way ANOVA). e, Uptake of FiVis nanoparticles at indicated doses in Cav1 WT bEnd.3 cells compared with that in homozygous Cav1KO bEnd.3 cells. Data are means ± s.e.m. n = 3 biologically independent samples; ***P < 0.001, ****P < 0.001 (one-way ANOVA). f, Quantification of FiVis transcytosis across a monolayer of WT or Cav1KO bEnd.3 cells at indicated incubation times using a transwell assay. Data are means ± s.e.m. n = 3 biologically independent samples; *P < 0.05 (one-way ANOVA). g, DLS assessment of FiVis nanoparticle size in apical and basolateral chambers of a transwell assay across a bEnd.3 cell monolayer. Data are means ± s.e.m. n = 3 biologically independent samples. h, Near-infared imaging of FiVis nanoparticles at 6 h following XRT and nanoparticle administration at indicated doses in advanced-stage Cav1 WT SHH-MB or Cav1 null SHH-MB tumours. Representative images, n = 3 mice per group. i, Quantitative real-time PCR analysis of Gli1 target inhibition in advanced-stage Cav1 WT SHH-MB and homozygous Cav1 null SHH-MB tumours following indicated XRT and FiVis treatments. RT–qPCR analysis for Cav1 is shown to indicate Cav1 status in WT and Cav1KO SHH-MB tumours. Data are means ± s.e.m. n = 3 mice per group; **P < 0.01, ***P < 0.001 (two-sided t-test). j, Schematic of proposed mechanism for FiVis nanoparticle passage across the BBB. Source data
Fig. 4
Fig. 4. FiVis nanoparticles synergize with low-dose irradiation to enhance Gli1 target inhibition and survival in SHH-MB.
ac, Quantitative real-time PCR analysis of Gli1 target inhibition in advanced-stage SHH-MB tumours following indicated treatments. a, RT–qPCR analysis of Gli1 expression comparing free vismodegib with FiVis at indicated doses, either alone or in combination with ionizing radiation. b, RT–qPCR analysis of Gli1 expression comparing treatment of P-selectin-targeting FiVis with control nontargeting DexVis at indicated doses in combination with ionizing radiation. c, RT–qPCR analysis of Gli1 expression following FiVis treatment at indicated dose with very-low-dose (0.25 Gy) ionizing radiation. ac, Data are means ± s.e.m. n = 3 mice per group; *P < 0.05, **P < 0.01, ***P < 0.001, ****P < 0.001 (two-sided t-test). d, Kaplan–Meier survival analysis of advanced-stage SHH-MB mice treated with either fractionated 0.25 Gy XRT, low-dose FiVis, free vismodegib or combinations thereof at indicated doses. Grey, survival of untreated SHH-MB mice. XRT doses of 0.25 Gy alone or in combination with respective drugs were given every other day in eight doses. *P = 0.0198 (log-rank, Mantel–Cox) for XRT + FiVis (orange) compared with XRT + vismodegib (pink). P not significant (log-rank, Mantel–Cox) when XRT + vismodegib (pink) compared with XRT alone (blue). Source data
Fig. 5
Fig. 5. FiVis nanoparticles abrogate vismodegib treatment-related bone toxicity in juvenile mice.
a, Body length of mice at 6 weeks of age following 2 day treatment at age 10 days (P10) with vismodegib (free Vis), FiVis or DMSO vehicle at indicated doses. Representative image; n = 3 mice per group. b, Mouse body weight over 6 weeks following 2 day treatment of P10 mice with vismodegib (100 mg kg–1), FiVis nanoparticles (10 mg kg–1) or DMSO. n = 3 mice per group. c, Femur length of P10 mice at 6 weeks following 2 day treatment with vismodegib or FiVis nanoparticles. n = 3 mice per group; *P < 0.05 (two-sided t-test). Data are means ± s.e.m. d, Representative microcomputed tomography three-dimensional reconstruction images of trabecular bone in the distal femoral metaphysis taken from mice treated with DMSO control, FiVis nanoparticles (20 mg kg–1) or free vismodegib (100 mg kg–1). BV/TV, trabecular bone volume/total volume; Tb.N, trabecular number; Tb.Th, trabecular thickness. Source data
Extended Data Fig. 1
Extended Data Fig. 1. BBB integrity in the SHH-MB GEM model.
(ad) Immunofluorescence staining of a representative Ptf1acre;Ptch1fl/fl SHH-MB tumor two hours after intravenous administration of 70 kDa tetramethylrhodamine (TMR)-dextran. Mice were dosed with 0.25 Gy of ionizing radiation two hours prior to injection of TMR-Dextran. n= 3 mice. CD31 on endothelium (violet), DAPI nuclear stain (blue), P-selectin (green) and TMR-dextran (red) are shown where indicated.
Extended Data Fig. 2
Extended Data Fig. 2. Quantification of immunofluorescence imaging data from Fig. 1a–d.
Quantification of (a) cell number, (b) P-selectin expression, and (c) co-localization of P-selectin with CD31 per ROI shown. Data are means ± SEM, *P < 0.05, **P < 0.01, ***P < 0.001, ****P < 0.001, (one-way ANOVA); ns, not significant. Quantification was performed using QuPath bioimage software. Source data
Extended Data Fig. 3
Extended Data Fig. 3. Timecourse of P-selectin expression in SHH-MB following ionizing radiation.
Western blot analysis of Ptf1acre;Ptch1fl/fl SHH-MB tumors following 2 Gy irradiation. P-selectin protein expression assessed at 2, 4, 6, and 24 hour time points (n = 2 mice at each time point) and untreated control (NT). P53 immunoblotting is used to benchmark exposure to ionizing radiation. GAPDH is used as a loading control. Source data
Extended Data Fig. 4
Extended Data Fig. 4. Nanoparticle tracking analysis of FiVis suspension.
(a) Representative image of FiVis nanoparticles by a NanoSight instrument. (b) Summary of results from nanoparticle tracking analysis of FiVis. D10: 10% of particles exhibit a diameter below this value; D50: Median diameter; 50% of particles have a diameter below this value; D90: 90% of particles measured have a diameter below this value. Source data
Extended Data Fig. 5
Extended Data Fig. 5. Size and stability of FiVis nanoparticles.
(a) DLS data showing the average diameter of FiVis nanoparticles after incubating in 25% FBS solution (in PBS) for 1 hour. (b) Size and (c) drug release profile of FiVis nanoparticles incubated at 37 °C (25% adult bovine serum in PBS). Evaluated by HPLC quantification of vismodegib released into solution over time. (d) Size of FiVis nanoparticles measured by DLS, removed from storage at 4 °C before each measurement. Data are means ± SEM. ns, not significant (unpaired t test). Data in (a-d) are means ± SEM. n = 3 experimental samples per group; *P < 0.05, **P < 0.01, ***P < 0.001, ****P < 0.001 (two-sided t test); ns, not significant. (e) Size, PDI, and drug encapsulation of resuspended FiVis nanoparticles after lyophilization. Data are means ± SEM. n = 10 experimental samples per group. Source data
Extended Data Fig. 6
Extended Data Fig. 6. Characterization of dextran sulfate/vismodegib nanoparticles.
(a) Dynamic light scattering characterization of DexVis nanoparticles. (b) HPLC quantification of vismodegib in DexVis and FiVis nanoparticle formulations from three preparations, and a standard curve of vismodegib. (c) Encapsulation efficiencies of FiVis and DexVis nanoparticles. Data are means ± SEM. n = 3 samples from independent experiments; ns, not significant (two-tailed t test). (d) Drug release profile of FiVis and DexVis nanoparticles incubated at 37 °C (25% adult bovine serum in PBS). Evaluated by HPLC quantification of vismodegib released into solution over time. Data are means ± SEM. n = 3 samples from independent experiments. Source data
Extended Data Fig. 7
Extended Data Fig. 7. Quantification of P-selectin expression and FiVis targeting to SHH-MB tumors.
(a) P-selectin expression in SHH-MB tumor tissue upon treatment with various doses of ionizing radiation. (b) Near-IR fluorescence intensities of FiVis nanoparticles in tumor regions (cerebellum) of SHH-MB mice treated with FiVis nanoparticles (10 mg/kg) and various doses of ionizing radiation. Data in (a, b) are means ± SEM. n = 3 mice per group; *P < 0.05, **P < 0.01, ***P < 0.001, (one-way ANOVA); ns, not significant. (c) Dual axis representation of P-selectin expression and FiVis nanoparticle fluorescence in SHH-MB tumor at corresponding irradiation doses. (d) Correlation analysis comparing P-selectin expression and uptake of FiVis nanoparticles observed in tumor. Source data
Extended Data Fig. 8
Extended Data Fig. 8. Biodistribution of FiVis nanoparticles in SHH-MB mice.
(a) Images acquired by IVIS® Spectrum in vivo imaging system showing FiVis biodistribution. SHH-MB mice were treated with either FiVis nanoparticles or a combination of irradiation and nanoparticles. Fluorescence intensities correspond to detection of the IR dye present in these nanoparticles. (b) Mean fluorescence intensity per tissue area was quantified for brain, heart, lung, liver, kidneys, and spleen. Data are means ± SEM. n = 3 mice per group. For each organ, the two indicated treatment groups were compared by unpaired, two-tailed t-test; significant differences are indicated (*P < 0.05, P = 0.0393), otherwise differences are not significant. Source data
Extended Data Fig. 9
Extended Data Fig. 9. Imaging and quantification of FiVis biodistribution to the brain.
(a) Side-by-side imaging of nanoparticle fluorescence in SHH-MB GEM mouse brains resected from mice treated with either FiVis nanoparticles only or a combination of irradiation and nanoparticles (XRT + FiVis). (b, c) Quantification of FiVis nanoparticle fluorescence intensity in cerebellum (tumor tissue) compared to forebrain (normal tissue) in non-irradiated and 0.25 Gy irradiated mice. Images acquired by IVIS® Spectrum in vivo imaging system. For (a-c), groups treated with nanoparticles only were dosed with 10 mg/kg FiVis, and groups treated with both irradiation and nanoparticles were dosed with 0.25 Gy XRT and 10 mg/kg FiVis. Data in (b, c) are means ± SEM. n = 3 mice per group; *P < 0.05, **P < 0.01, (two-way ANOVA); ns, not significant. Source data
Extended Data Fig. 10
Extended Data Fig. 10. Dose response of FiVis nanoparticle uptake in tumors.
Quantification of nanoparticle fluorescence localized at the cerebellum or forebrain of SHH-MB mice treated with 10 mg/kg or 20 mg/kg doses of FiVis and 0.25 Gy XRT. Data are means ± SEM. n = 3 mice per group; *P < 0.05, ****P < 0.0001, (two-way ANOVA). Source data

Comment in

References

    1. Wong AD, et al. The blood-brain barrier: an engineering perspective. Front. Neuroeng. 2013;6:7. doi: 10.3389/fneng.2013.00007. - DOI - PMC - PubMed
    1. Griffith JI, et al. Addressing BBB heterogeneity: a new paradigm for drug delivery to brain tumors. Pharmaceutics. 2020;12:1205. doi: 10.3390/pharmaceutics12121205. - DOI - PMC - PubMed
    1. Goldsmith M, Abramovitz L, Peer D. Precision nanomedicine in neurodegenerative diseases. ACS Nano. 2014;8:1958–1965. doi: 10.1021/nn501292z. - DOI - PubMed
    1. Kool M, et al. Molecular subgroups of medulloblastoma: an international meta-analysis of transcriptome, genetic aberrations, and clinical data of WNT, SHH, Group 3, and Group 4 medulloblastomas. Acta Neuropathol. 2012;123:473–484. doi: 10.1007/s00401-012-0958-8. - DOI - PMC - PubMed
    1. Ramaswamy V, et al. Risk stratification of childhood medulloblastoma in the molecular era: the current consensus. Acta Neuropathol. 2016;131:821–831. doi: 10.1007/s00401-016-1569-6. - DOI - PMC - PubMed

Publication types

LinkOut - more resources