. 2023 Mar;30(3):348-359.
doi: 10.1038/s41594-023-00928-6. Epub 2023 Mar 2.

Direct visualization of transcription-replication conflicts reveals post-replicative DNA:RNA hybrids

Affiliations

Direct visualization of transcription-replication conflicts reveals post-replicative DNA:RNA hybrids

Henriette Stoy et al. Nat Struct Mol Biol. 2023 Mar.

Abstract

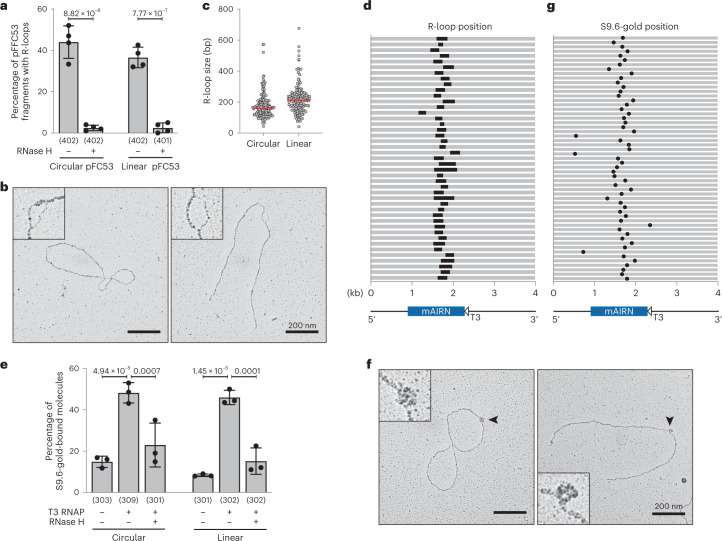
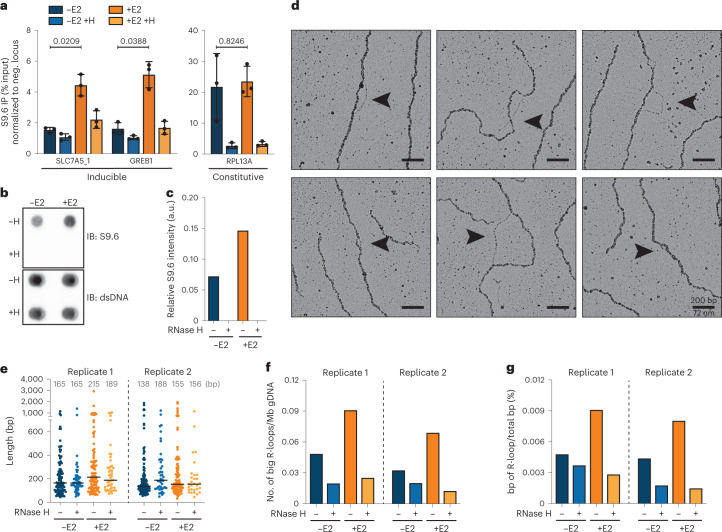
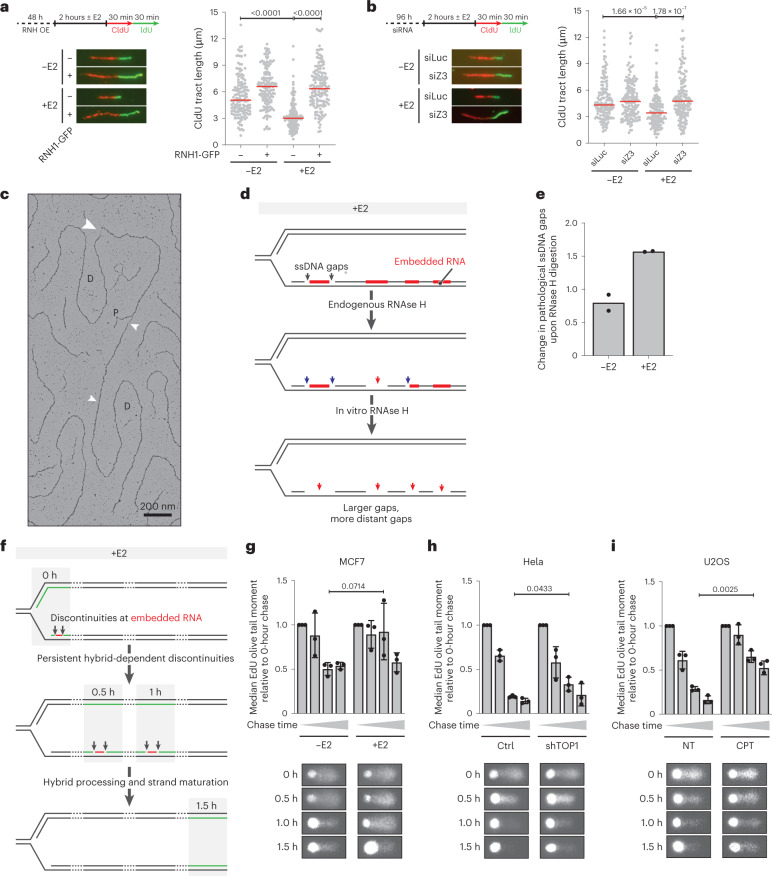
Transcription-replication collisions (TRCs) are crucial determinants of genome instability. R-loops were linked to head-on TRCs and proposed to obstruct replication fork progression. The underlying mechanisms, however, remained elusive due to the lack of direct visualization and of non-ambiguous research tools. Here, we ascertained the stability of estrogen-induced R-loops on the human genome, visualized them directly by electron microscopy (EM), and measured R-loop frequency and size at the single-molecule level. Combining EM and immuno-labeling on locus-specific head-on TRCs in bacteria, we observed the frequent accumulation of DNA:RNA hybrids behind replication forks. These post-replicative structures are linked to fork slowing and reversal across conflict regions and are distinct from physiological DNA:RNA hybrids at Okazaki fragments. Comet assays on nascent DNA revealed a marked delay in nascent DNA maturation in multiple conditions previously linked to R-loop accumulation. Altogether, our findings suggest that TRC-associated replication interference entails transactions that follow initial R-loop bypass by the replication fork.


Conflict of interest statement

The authors declare no competing interests.

Figures

Fig. 1
Fig. 1. Direct visualization of in vitro-generated R-loops using EM.
ad, Native EM analysis of in vitro-transcribed pFC53. Whenever indicated, samples were linearized and/or digested with 6 U/µg RNase H. At least 70 molecules were quantified per condition and replicate. a, R-loop frequency, shown as mean ± s.d., n = 4 independent biological replicates. Statistical significance was determined by ordinary one-way analysis of variance (ANOVA), followed by Sidak test. b, Representative electron micrographs. Scale bars, 200 nm. c, R-loop size; the median is indicated in red. d, R-loop position (black bar) on linearized pFC53 (gray). eg, Immuno EM analysis of in vitro-transcribed and S9.6-gold-labeled pFC53. Whenever indicated, samples were linearized and/or digested with 6 U/µg RNase H. At least 70 molecules quantified per condition and replicate. e, S9.6-gold binding frequency as mean ± s.d., n = 3 independent biological replicates. Statistical significance was determined by ordinary one-way ANOVA, followed by Sidak test. f, Representative electron micrographs. Scale bars, 200 nm. g, S9.6-gold binding position (black dot) on the linear pFC53 (gray). Numbers below x-axes in a and e indicate the total number of molecules analyzed in all replicates. In d and g the position of the R-loop forming mAirn gene is indicated in light blue below the graph. Source data
Fig. 2
Fig. 2. EM-based visualization and quantification of R-loops on human genomic DNA upon estrogen-dependent transcriptional burst.
a, qPCR–DRIP analysis of MCF7 cells with or without 2 hours of E2 stimulation and with or without in vitro RNase H digestion (H) for representative E2-inducible and constitutive genomic loci. Data were normalized to a negative (neg.) locus and is shown as mean ± s.d., n = 3 independent biological replicates. Statistical significance was determined by unpaired two-tailed t-test. Inducible and constitutive loci differ significantly, as determined by two-way ANOVA (P = 5.78 × 10⁻⁷). b, Dot blot analysis of genomic DNA extracted from MCF7 cells with or without 2 hours of E2 stimulation and with or without in vitro RNase H digestion. Genome-wide hybrid accumulation was detected by S9.6 immunostaining (loading control: dsDNA). c, Quantification of integrated intensities in b; S9.6 signal was normalized to the respective dsDNA loading control. a.u., arbitrary units. dg, EM analysis of R-loops on genomic DNA extracted from MCF7 cells with or without 2 hours of E2 stimulation and with or without in vitro RNase H digestion. This analysis was performed in two independent biological replicates (additional data in Extended Data Fig. 3). d, Representative electron micrographs of R-loops (indicated by the black arrows) found on gDNA from E2 stimulated cells. Scale bars, 200 bp/72 nm. e, Sizes of single R-loops in bp. Black lines and gray numbers indicate the median R-loop size. f, Frequency of R-loops that are >300 bp in size. Absolute numbers of R-loops were normalized to the total DNA content within the analyzed area. g, Total R-loop burden, calculated as the genomic fraction of bp involved in R-loop formation. Source data
Fig. 3
Fig. 3. Estrogen-dependent transcriptional burst results in replication stress and is associated with hybrid accumulation behind the replication fork.
a,b, DNA fiber assay of MCF7 cells with or without 2 hours of E2 stimulation, combined with 48 hours of transient RNH1-GFP expression (a) or 96 hours of short interfering RNA (siRNA, siLuciferase (siLuc) and siZRANB3 (siZ3)) transfection (b) prior to E2 treatment. Left, assay set-up (top), with representative DNA fibers (bottom). Right, quantification of CldU tract lengths (μm); at least 100 individual molecules were quantified per condition. Median fiber length is indicated in red. Statistical significance was determined by Kruskal–Wallis test, followed by Dunn’s test. Triplicate data of these experiments are provided in Extended Data Figure 4b,d. ce, EM analysis of pathological ssDNA gap formation on replicating genomic DNA from MCF7 cells with or without 2 hours of E2 and with or without in vitro RNase H digestion; 100 replication intermediates were quantified per condition (see Extended Data Fig. 4h,i). c, Representative replication fork with ssDNA gaps. P: parental; D: daughter; white arrow: ssDNA gap. Scale bar, 200 nm. d, Graphical model of changes in ssDNA accumulation, induced by endogenous RNase H and/or in vitro treatment with recombinant RNase H. e, Relative change in pathological ssDNA gaps upon in vitro treatment with RNase H (based on red numbers in Extended Data Fig. 4h,i). fi, EdU alkaline comet assay to identify discontinuities in nascent DNA strands. A detailed explanation of the assay set-up is provided in Extended Data Figure 4j. i, Graphical model of how the EdU alkaline comet assay can reveal persistent DNA:RNA hybrid-induced discontinuities. gi, EdU alkaline comet assay in different cellular systems of transcription-replication conflicts. Top, median EdU olive tail moments—indicating amount and distance of EdU-labelled DNA migrating from the head region—normalized to the 0-hour chase time point. Bar graph shows mean ± s.d., n = 3 independent biological replicates; at least 30 single EdU-positive cells were analyzed per condition and replicate. Bottom, representative EdU comets. Statistical significance was determined by one-tailed t-test with Welch’s correlation. g, MCF7 cells with or without 8 hours of E2 stimulation. h, Hela control and shTOP1 cells with 72 hours of 2 µg/ml doxycycline treatment. i, U2OS cells with or without 1 hour of 100 nM CPT treatment. Source data
Fig. 4
Fig. 4. Replication forks stall and reverse while facing a TRC in B. subtilis.
a, Model system and experimental workflow; red boxes indicate the area from which linear and replicating conflict (RI) regions were extracted for further analysis. gDNA, genomic DNA. b, qPCR–DRIP analysis of accumulation of DNA:RNA hybrids within the conflict region in WT and Δrnhc mutant strains with or without IPTG induction and with or without in vitro RNase H digestion. Data were normalized to a negative locus and are shown as mean ± s.d., n = 3 independent biological replicates. Significance was determined by ordinary one-way ANOVA, followed by Sidak test. ce, Native EM analysis of RIs extracted from the RI region, marked in Extended Data Figure 5a (data from additional replicates of this experiment are provided in Extended Data Figure 5b–g). c, Fragment lengths of all imaged RIs from one replicate. The two numbers on top indicate the number of RI within the expected size range (top number, dark dots) and the number of total RIs imaged (in parentheses, all dots). d, Top, alignment of selected RIs, according to daughter strand length. Daughter strands are indicated in green, and parental strands in gray. Reversed forks are labeled in pink and black, with pink marking length of the regressed arm and black the length of the parental strand prior to reversal. Bottom, representative electron micrographs of normal (I, II, IV) and reversed (III, V, VI) forks. Scale bars, 500 nm. e, Fork reversal frequency, shown as mean ± s.d., n = 3 independent biological replicates (the corresponding fragment maps for the additional replicates can be found in Extended Data Figure 5e,g). Numbers below the graph indicate the total number of molecules analyzed in all three experiments. Significance was determined by ordinary one-way ANOVA, followed by Sidak test. Source data
Fig. 5
Fig. 5. DNA:RNA hybrids accumulate within replicating conflict DNA in Bacillus subtilis.
a, EM analysis of ssDNA gaps within replicating conflict DNA from IPTG-induced WT and Δrnhc mutant strains. Left, fraction of RIs with at least one gap, from two independent biological replicates. The numbers below the graph indicate the number of molecules analyzed. Right, representative electron micrograph of a replication fork with a ssDNA gap. P: parental; D: daughter; R: regressed; black arrow: ssDNA gap. Scale bar, 500 nm. bf, Immuno EM analysis of B. subtilis material, with pFC53 added as an internal control for S9.6-gold specificity. When indicated, samples were digested with RNase H in vitro. Of note, bulk RI and linear molecules were collected from the same sample. The RI fraction of B. subtilis was repeatedly lost during the RNase H digestion and had to be excluded from subsequent analysis (not applicable, n.a.). b, Length distribution of the imaged fragments. Black, pFC53; gray, B. subtilis material. At least 70 molecules were imaged for each fraction and fragment. Of note, the relative frequencies of pFC53 and B. subtilis material displayed do not represent the frequency observed in the sample: pFC53 molecules were added in large excess. c, S9.6-gold-binding frequency of pFC53 and B. subtilis with or without RNase H, shown as mean ± s.d., n = 3 independent biological replicates. Numbers below the graph indicate the total number of analyzed molecules in all three experiments. Statistical significance determined by ordinary one-way ANOVA, followed by Sidak test. d, Frequency and numbers of ssDNA gaps detected in the analyzed molecules in b. e, Representative electron micrographs of S9.6-gold-labeled conflict RIs in B. subtilis. P: parental; D: daughter; R: regressed. Scale bars, 500 nm. f, S9.6-gold-binding position within the replicating conflict of B. subtilis. Green: daughter strand; gray: parental strand; black: parental strand of reversed forks prior to reversal; pink: regressed arm; dark gray dots: S9.6-gold label. Comparable maps of additional replicates are available in Extended Data Figure 6. Source data
Fig. 6
Fig. 6. Working model for the accumulation of post-replicative DNA:RNA hybrids at TRCs and their impact on fork progression.
During head-on transcription replication conflicts, R-loops can form behind the RNAP and are either processed into DNA:RNA hybrids and/or are efficiently bypassed by the replisome. The DNA:RNA hybrid is thereby transferred to the lagging strand behind the replisome (see Extended Data Figure 8a for potential mechanisms). Under physiological conditions, this hybrid is rapidly resolved, allowing unperturbed fork progression. In case of excessive accumulation (that is transcriptional burst) or impaired removal (that is limited RNase H activity), DNA:RNA hybrids may be still efficiently bypassed, but their accumulation behind the fork would result in delayed fork progression and frequent fork reversal (see Extended Data Fig. 8b for potential mechanisms). Upon stress resolution, the reversed fork can be restarted to complete DNA replication.
Extended Data Fig. 1
Extended Data Fig. 1. Direct visualization of in vitro-generated R-loops using Electron Microscopy (EM).
a) pFC53 map including the R-loop prone mAIRN gene, the T3 promotor used in this study and the XmnI linearization site. b) Gel shift assay of circular and linear pFC53 +/− RNase H treatment. This result has been reproduced 3 independent times. c) Dot blot of circular and linear pFC53 +/− RNase H, immunoblotted for S9.6 and dsDNA (as loading control). When indicated, pFC53 was incubated with 20% formamide and 0.02% BAC for 1 min prior to dot blot loading. This result has been reproduced 3 independent times. d-f) Competition experiment to assess the specificity and selectivity of the S9.6-gold conjugated antibody. The linearized competition plasmid and R-loop carrying pFC53 were mixed in the indicated ratios, labeled with S9.6-gold and spread for EM analysis. For each plasmid at least 100 molecules were analyzed. The experiment was reproduced once. d) Length distribution of the imaged fragments. pFC53 and the competition plasmid were identified by their respective sizes. The relative frequencies of pFC53 and competition plasmid displayed do not represent the frequencies observed in the sample. e) Quantification of S9.6-gold binding to the pFC53 and the competition plasmid. Binding to pFC53 was further differentiated into specific (within the mAIRN gene) or unspecific (outside of the mAIRN gene). f) Calculated R-loop density (number of R-loops/Mb) for the ratios indicated below. Source data
Extended Data Fig. 2
Extended Data Fig. 2. Optimization of EM sample preparation to detect R-loop structures on genomic DNA.
ab) qPCR-DRIP analysis of MCF7 cells +/− 2 h E2 +/− in vitro RNase H digestion for representative E2-inducible and constitutive genomic loci on the extracted genomic DNA used for the two biological replicates of the EM analysis. Data was normalized to a negative locus. a) corresponds to data shown in Fig. 2b-g, b) corresponds to data shown in Fig. 2e–g, Extended Fig. 2c, d and Extended Data Fig. 3a, b. c) Dot blot analysis of genomic DNA extracted from MCF7 +/− 2 h E2 +/− in vitro RNase H digestion. Genome wide hybrid accumulation was detected by S9.6 immunostaining (loading control: dsDNA). d) Quantification of integrated intensities in b); S9.6 signal was normalized to the respective dsDNA loading control. e) Genomic DNA, extracted from E2 stimulated MCF7, was digested with different cocktails of restriction enzymes: 1. PvuII, 2. PvuII + EcoRI, 3. NotI, 4. BbvCI, 5. HindIII + EcoRI + BsrGI + XbaI + SspI. Hybrid levels were detected by S9.6 dot blot (S9.6 blot shown as short and long exposure; loading control: dsDNA). Digestion cocktail 2 was used for all follow-up experiments. This result was reproduced once. f) Agarose gel electrophoresis of samples in e) showing the different degrees of genomic DNA fragmentation. g) Dot blot of extracted genomic DNA, extracted from E2 stimulated MCF7 and purified either directly or after restriction enzyme digest using either size exclusion columns (Amicon) or a silica bead extraction kit (SBK). Note that, for unknown reasons, hybrids are not recovered from Amicon columns, which is why SBK was selected for all follow-up experiments. Heat inactivation was used as positive control for hybrid stability. Hybrid stability was assessed by S9.6 dot blot (S9.6 blot shown as short and long exposure; loading control: dsDNA). This result was reproduced once. h) Agarose gel electrophoresis of samples in g) showing the degree of genomic DNA fragmentation. i) Automated high-throughput EM workflow used to image and quantify R-loops on human genomic DNA. Source data
Extended Data Fig. 3
Extended Data Fig. 3. EM-based visualization and quantification of R-loops on human genomic DNA upon estrogen-dependent transcriptional burst.
a) Representative electron micrographs of R-loops found on genomic DNA from E2 stimulated cells. Scale bar: 200 bp/72 nm. b) Frequency of R-loops that are <300 bp in size in two independent biological replicates. Absolute numbers of R-loops <300 bp were normalized to the total DNA content within the analyzed area. Source data
Extended Data Fig. 4
Extended Data Fig. 4. Estrogen-dependent transcriptional burst results in replication stress and is associated with hybrid accumulation behind the replication fork.
a) Single cell GFP values as measured by FACS of MCF7 +/− E2 +/− 48 h RNH1-GFP overexpression. Red line: median. Statistical significance determined by Kruskal-Wallis test, followed by Dunn test. b) Median CldU tract length from three independent biological replicates of Fig. 3a), shown as mean +/− s.d.. Statistical significance determined by ordinary one-way ANOVA, followed by Sidak test. c) Immunoblot detection of indicated proteins in whole cell extracts from MCF7 cells +/− E2 +/− 96 h siRNA transfection. Dotted line indicates where samples unrelated to the experiment have been omitted. d) Median CldU tract length from three independent biological replicates of Fig. 3b), shown as mean +/−s.d. Statistical significance determined by ordinary one-way ANOVA, followed by Sidak test. e) DNA fiber assay of MCF7 +/− E2. Left: assay setup with representative DNA fiber images. Right: quantification of CldU tract lengths [μm]; at least 100 individual molecules quantified per conditions. Red line: mean. Statistical significance determined by Kruskal-Wallis test, followed by Dunn test. f) Single cell gH2AX values as measured by FACS of MCF7 +/− E2 +/− 10 µM PARPi. Red line = median. Statistical significance was determined by ordinary one-way ANOVA, followed by Sidak test. g) Relative change in median gH2AX intensities upon PARPi, shown as mean +/− s.d., n = 3 independent biological replicates. Statistical significance was determined by two-tailed unpaired t test. h, i) EM analysis of ssDNA gaps within replicating DNA of MCF7 +/− E2 +/− in vitro RNase H digestion. ssDNA gaps from 100 RI were quantified for size and distance to the fork junction. Thresholds: 30nt for size, 3 kb for distance. Dots in red (‘pathological ssDNA gaps’) correspond to gaps larger than 30nt and/or >3 kb distance to the fork. h) and i) display two independent biological replicates. j) EdU Alkaline Comet assay. Top: assay set up. Bottom: nascent strand (light grey) and genome-wide discontinuities (dark grey) in unperturbed conditions. Red lines: median olive tail moment. k-m) Half-lives of nascent strand discontinuities, derived from exponential fitting of data shown in Fig. 3g–i and shown as mean +/− s.d., n = 3 independent biological replicates. Significance determined by unpaired two-tailed t-test. Source data
Extended Data Fig. 5
Extended Data Fig. 5. Replication forks stall and reverse while facing a transcription-replication conflict (TRC) in Bacillus subtilis (additional biological replicates).
a) EtBr-stained agarose gel of size separated genomic DNA from WT and Δrnhc mutant B. subtilis strains +/− IPTG. Fractions indicated in red were excised for further EM analysis (depicted in Fig. 4d, e). b, d-e) and c, f-g) represent two additional biological replicates of the replicate shown in Fig. 4. b, c) EtBr-stained agarose gel of size separated genomic DNA from WT and Δrnhc mutant B. subtilis strains +/− IPTG. Fractions indicated in red were excised for further EM analysis. d, f) Fragment lengths of all imaged RI. The two numbers on top indicate the number of RI within the expected size range (dark dots) and the number of total RI imaged, respectively. e, g) Alignment of selected RI according to daughter strand length. Daughter strands are indicated in green, parental strands in grey. Reversed forks are labeled in pink/black, with pink marking length of the regressed arm and black the length of the parental strand prior to reversal. Source data
Extended Data Fig. 6
Extended Data Fig. 6. DNA:RNA hybrids accumulate within replicating conflict DNA in Bacillus subtilis (additional biological replicates).
a, d) and b,e) are independent biological replicates of Fig. 5 b/f. a-b) Length distribution of the imaged fragments. Black: pFC53; grey: B. subtilis material. c) Frequency and numbers of ssDNA gaps detected in the analyzed molecules in a). d-e) S9.6-gold binding position within the replicating conflict of B. subtilis. Green: daughter strand. Grey/black: parental strand. Pink: regressed arm. Dark grey dots: S9.6-gold label.
Extended Data Fig. 7
Extended Data Fig. 7. R-loops stability is maintained during gel-electrophorese and gel extraction.
a) Native EM analysis of linear pFC53 +/− gel extraction. Left: R-loop frequency, shown as mean +/− s.d., n = 3 independent biological replicates. Statistical significance determined by unpaired two-tailed t-test. Right: R-loop position. b) S9.6-gold immuno EM analysis of linear pFC53 +/− gel extraction. Left: S9.6-gold binding frequency, shown as mean +/− s.d., n = 3 independent biological replicates. Statistical significance determined by unpaired two-tailed t-test.
Extended Data Fig. 8
Extended Data Fig. 8. Possible mechanisms of post-replicative hybrid formation and hybrid-dependent replication interference.
a) Possible mechanisms of post-replicative DNA:RNA hybrid formation. Initiation of de novo transcription behind the replication fork generates nascent RNA, which can either anneal directly to exposed ssDNA on the lagging strand or reinvade the duplex daughter strand to form an R-loop, prone to nucleolytic processing (1). Alternatively, the RNA can be inherited from preexisting hybrids ahead of the fork either through replisome bypass (2) or through hybrid disassembly and subsequent RNA reannealing to the exposed ssDNA behind the fork (3). b) Possible mechanisms of replication interference by long/accumulating post replicative DNA:RNA hybrids. DNA:RNA hybrids forming on the lagging strand may remain tethered to the replisome through RNA-binding and/or -processing enzymes, creating torsional constrains through DNA looping (1). Alternatively, hybrid processing may expose ssDNA, which induces RAD51 loading and subsequent fork reversal (2). Finally, excessive RNA:DNA hybrid formation may interfere with chromatinization of the newly synthesized daughter strand (3). In both a and b, the alternative mechanisms may coexist, contributing to the observed structures.

References

    1. Wei X, et al. Segregation of transcription and replication sites into higher order domains. Science. 1998;281:1502–1505. doi: 10.1126/science.281.5382.1502. - DOI - PubMed
    1. García-Muse T, Aguilera A. Transcription–replication conflicts: how they occur and how they are resolved. Nat. Rev. Mol. Cell Biol. 2016;17:553. doi: 10.1038/nrm.2016.88. - DOI - PubMed
    1. Hamperl S, Cimprich KA. Conflict resolution in the genome: how transcription and replication make it work. Cell. 2016;167:1455–1467. doi: 10.1016/j.cell.2016.09.053. - DOI - PMC - PubMed
    1. Merrikh H, Zhang Y, Grossman AD, Wang JD. Replication–transcription conflicts in bacteria. Nat. Rev. Microbiol. 2012;10:449–458. doi: 10.1038/nrmicro2800. - DOI - PMC - PubMed
    1. Kotsantis P, et al. Increased global transcription activity as a mechanism of replication stress in cancer. Nat. Commun. 2016;7:13087. doi: 10.1038/ncomms13087. - DOI - PMC - PubMed

Publication types