Review
. 2023 Aug;24(8):494-515.
doi: 10.1038/s41576-023-00580-2. Epub 2023 Mar 2.

Methods and applications for single-cell and spatial multi-omics

Affiliations
Review

Methods and applications for single-cell and spatial multi-omics

Katy Vandereyken et al. Nat Rev Genet. 2023 Aug.

Abstract

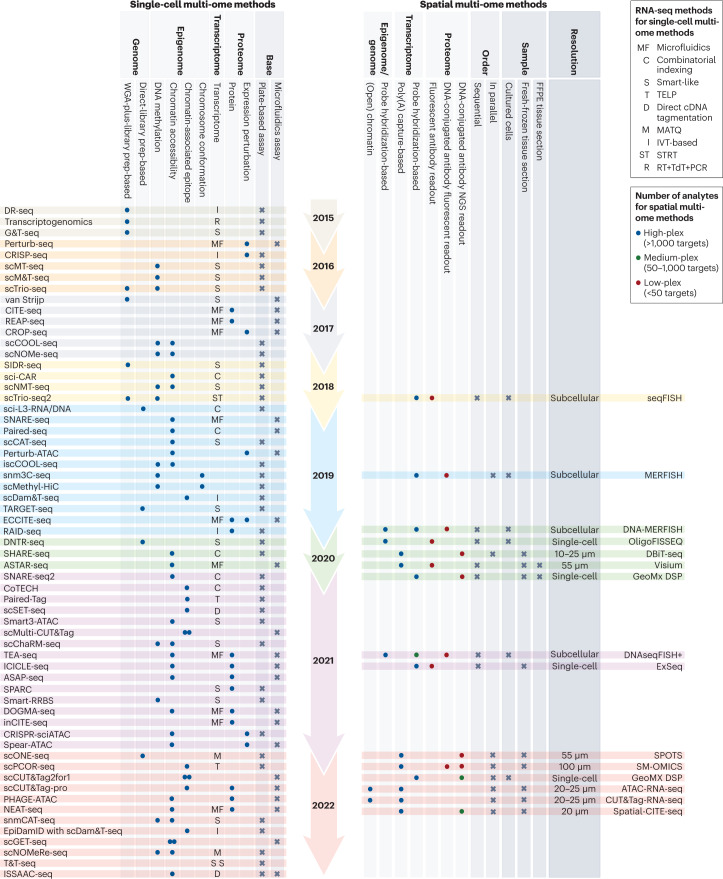
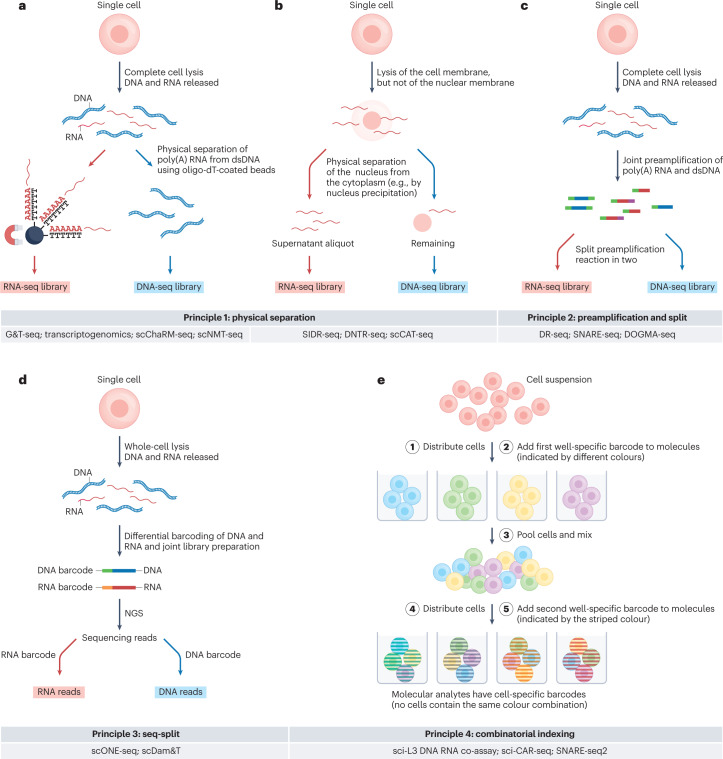
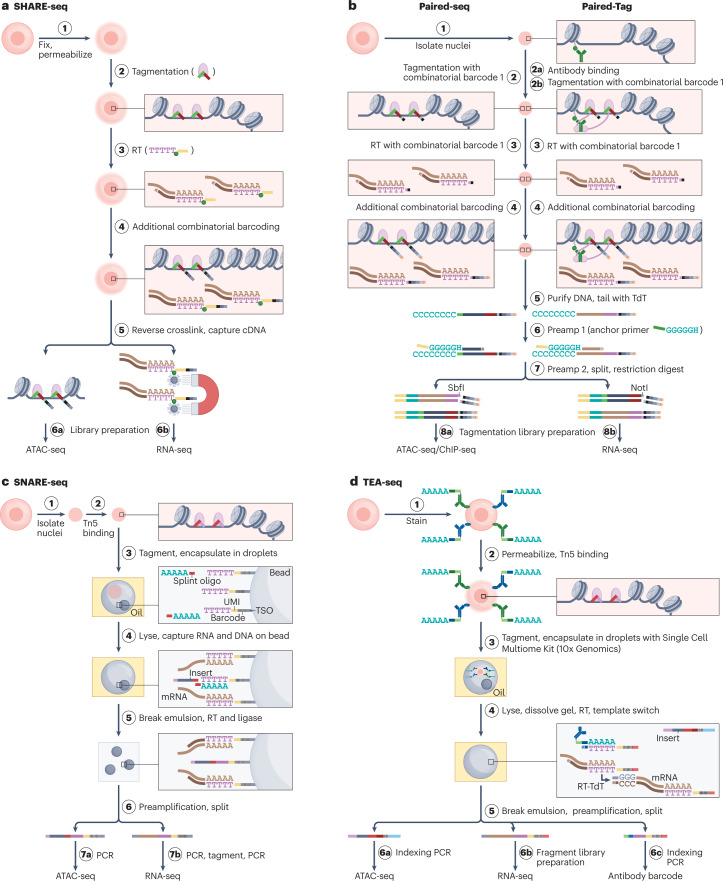
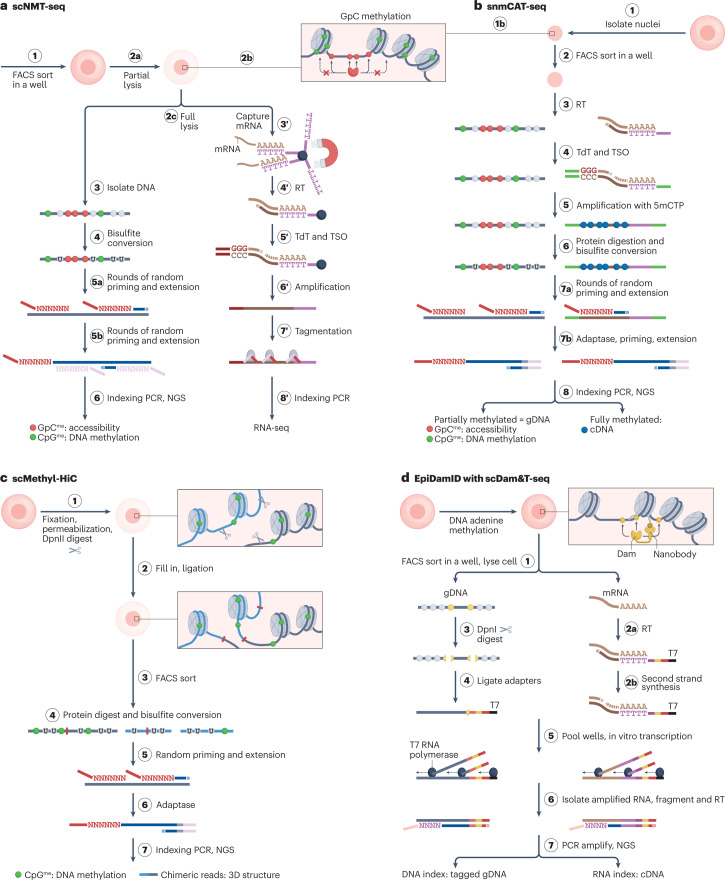
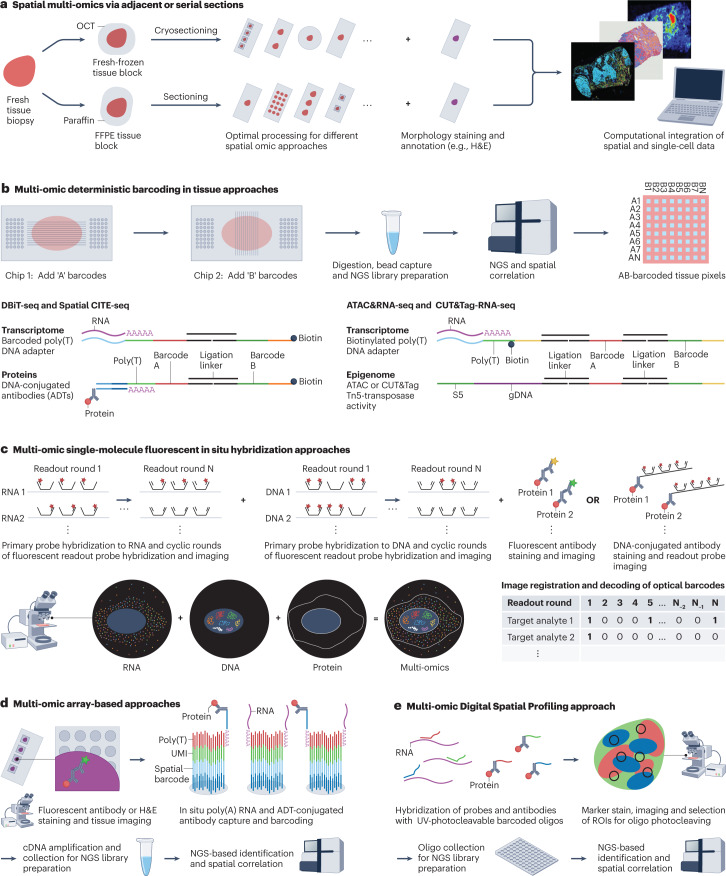
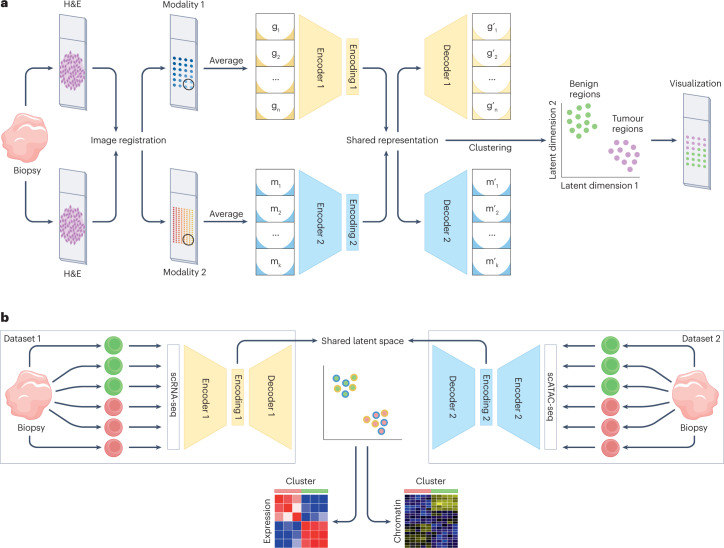
The joint analysis of the genome, epigenome, transcriptome, proteome and/or metabolome from single cells is transforming our understanding of cell biology in health and disease. In less than a decade, the field has seen tremendous technological revolutions that enable crucial new insights into the interplay between intracellular and intercellular molecular mechanisms that govern development, physiology and pathogenesis. In this Review, we highlight advances in the fast-developing field of single-cell and spatial multi-omics technologies (also known as multimodal omics approaches), and the computational strategies needed to integrate information across these molecular layers. We demonstrate their impact on fundamental cell biology and translational research, discuss current challenges and provide an outlook to the future.


Conflict of interest statement

T.V. is co-inventor on licensed patents WO/2011/157846 (Methods for haplotyping single cells), WO/2014/053664 (High-throughput genotyping by sequencing low amounts of genetic material) and WO/2015/028576 (Haplotyping and copy number typing using polymorphic variant allelic frequencies).

Figures

Fig. 1
Fig. 1. Timeline of single-cell and spatial multimodal methods.
In addition to the year of publication, other key features of the methods are indicated. For single-cell multi-omics assays, this includes the nature of molecular analytes they analyse as well as the method used for cell barcoding. For spatial multi-omics assays, this includes the resolution, sample type, order and number of analytes that can be profiled simultaneously. FFPE, formalin-fixed paraffin-embedded; IVT, in vitro transcription; MATQ, multiple annealing and dC-tailing-based quantitative single-cell RNA-seq; STRT: single-cell tagged reverse transcription sequencing; RT, reverse transcription; TdT, terminal deoxynucleotidyl transferase; TELP, tailing extension ligation and PCR.
Fig. 2
Fig. 2. The four general principles for multi-ome measurements from single cells.
All principles are visualized with RNA and DNA as example analytes. Principle 1 is based on physical separation of the distinct molecular analytes (parts a,b). a, Following complete lysis of the isolated cell or nucleus, poly(A) RNA hybridizes to oligo-dT-coated paramagnetic beads, and following magnetic pulldown, the supernatant that contains the genomic DNA is transferred to a new reaction vessel,. Alternatively, biotinylated nucleotides are incorporated into RNA-derived cDNA, allowing their capture with streptavidin-coated paramagnetic beads (not shown). Advantages include flexibility in downstream processing of DNA and/or RNA and compatibility with intact cells and nuclei from fresh and frozen tissue. Disadvantages include potential loss of RNA and/or DNA molecules during physical separation. b, In an alternative approach, lysis conditions that rupture the cell but not the nuclear envelope allow separation of nuclear from cytoplasmic molecular analytes, either by precipitating the nucleus with centrifugation or magnetic pulldown followed by aspiration of the cytosolic supernatant, or by microfluidic-controlled nucleus-from-cytoplasm separation,. Advantages include flexibility in downstream processing of DNA and RNA and availability of non-poly(A) RNA. Disadvantages include loss of nuclear RNA plus some cytoplasmic RNA during nuclear–cytoplasmic separation, loss of mitochondrial analytes, need for intact single cells, incompatibility with frozen tissue and likely incompatibility with mitotic cells (in which the nuclear envelope disaggregates). c, In principle 2, termed preamplification and split, distinct analytes are differentially tagged and jointly preamplified, followed by splitting the preamplification reaction for analyte-specific sequencing library preparations. Advantages include minimal risk of analyte loss and compatibility with intact cells and nuclei from fresh and frozen tissue. Disadvantages include limited flexibility, as the preamplification protocol needs to be suitable for all analytes of interest, and risk of cross-contaminating molecular analytes. d, Principle 3, termed seq-split, involves analyte-specific barcoding and sequencing library preparation in a single-pot reaction. Multi-omic information is uncoupled computationally following sequencing. Advantages include minimal risk of analyte loss and compatibility with intact cells and nuclei from fresh and frozen tissue. Disadvantages include that libraries cannot be sequenced separately to optimal depth for each modality, and potential risk of cross-contaminating molecular analytes. e, In principle 4, termed combinatorial indexing, molecular analytes of single cells are tagged without isolating single cells. Multiple cells or nuclei are deposited per well of a multi-well plate, whereby each cell or nucleus serves as a reaction container. Each receives an analyte-specific tag and a well-specific barcode. By pooling, mixing and randomly re-distributing the cells or nuclei in subsequent rounds of well-specific barcoding, molecular analytes uniquely barcoded per cell are obtained. Combination with concepts of principle 2 and/or 3 achieves single-cell or single-nucleus multi-omics. Advantages include that there is no need for isolating single cells, ability to achieve extremely high throughput, and compatibility with intact cells and nuclei from fresh and frozen tissue. Disadvantages include typically lower sensitivity, risk of analyte loss and limited flexibility in whole-genome and whole-transcriptome amplification protocols. dsDNA, double-stranded DNA; NGS, next generation sequencing; poly(A), polyadenylated.
Fig. 3
Fig. 3. Selected tagmentation-based methods for single-cell multi-omic analyses.
Summaries of experimental workflows highlighting how and in what order different modalities are probed and separated for analysis, while retaining single-cell information. Shown are SHARE-seq (part a), Paired-seq2 (part b, left) and Paired-Tag (part b, right), SNARE-seq (part c) and TEA-seq (part d). In all methods shown, an assay for transposase-accessible chromatin (ATAC) precedes reverse transcription (RT) of polyadenylated RNA. Cell barcoding can occur through successive rounds of combinatorial indexing (parts a,b) or by compartmentalizing cells and barcoded oligonucleotides in microdroplets (parts c,d). DNA fragments originating from mRNA and DNA can be separated by binding to paramagnetic beads (part a), differential restriction digestion (part b) or using specific PCR primers (parts c,d). Part b illustrates how similar workflows can either map accessible chromatin (left) and chromatin-associated proteins or their post-translational modifications (right). TEA-seq illustrates that barcoded oligonucleotides conjugated to antibodies can be detected using approaches similar to those developed for measuring gene expression. cDNA, complementary DNA; ChIP–seq, chromatin immunoprecipitation followed by sequencing; RNA-seq, RNA sequencing; TdT, terminal deoxynucleotidyl transferase; TSO, template-switching oligonucleotide; UMI, unique molecular identifier.
Fig. 4
Fig. 4. Selected DNA methylation-based methods for single-cell multi-omic analyses.
Summaries of experimental workflows highlighting how and in what order different modalities are probed and separated for analysis, while retaining single-cell information. Shown are scNMT-seq (part a), snmCAT-seq (part b), scMethyl-HiC (part c) and EpiDamID with scDam&T-seq (part d). In all methods shown, several types of epigenetic information can be discerned from a single sequencing library: DNA methylation and accessibility (part a), DNA methylation, accessibility and gene expression (part b), DNA methylation and chromatin conformation (part c), and histone modifications and transcription (part d). These layers of information can be discriminated by analysing DNA methylation patterns (parts a,b), DNA methylation and read-pair mapping (part c) or read-associated barcode tags (part d). Only scNMT-seq (part a) involves physical separation of modalities to be probed (mRNA from intact cells). Each of these methods is plate-based and therefore restricted in its throughput. DNA methylation patterns can be read using bisulfite conversion of unmethylated cytosines to uracil (U) (parts a–c) or methylation-sensitive restriction digestion (part d), and reflect endogenous methylation alone (part c), endogenous methylation as well as exogenously added methylation reflecting chromatin accessibility (parts a,b), or endogenous adenine methylation added after genetic transformation (part d). cDNA, complementary DNA; Dam, DNA adenine methyltransferase; FACS, fluorescence-activated cell sorting; gDNA, genomic DNA; 5mCTP: 5-methyl-deoxycytidine triphosphate; NGS, next-generation sequencing; RT, reverse transcription; T7, T7 promoter; TdT, terminal deoxynucleotidyl transferase; TSO, template-switching oligonucleotide.
Fig. 5
Fig. 5. Methods for spatial multi-omics.
Spatial multi-ome profiling of tissue samples can be achieved by applying spatial mono-omics assays separately on adjacent or serial tissue sections (part a) or in a combined way on the same tissue section (parts be). a, Serial fresh-frozen or formalin-fixed paraffin-embedded (FFPE) tissue sections can be analysed using different spatial mono-omic assays, potentially also combining with morphological stainings and annotations on the same or adjacent sections, followed by computational data integration. b, Microfluidic deterministic barcoding strategies in tissue allow next-generation sequencing (NGS)-based spatial multi-omics profiling of transcriptome-plus-proteins, as in DBiT-seq and Spatial-CITE-seq, and epigenome-plus-transcriptome, as in ATAC&RNA-seq and CUT&Tag-RNAseq. Using dual microfluidic chip-based spatial barcoding of poly(A) RNAs together with proteins or epigenome information at the crossroads of chip channels, a spatially barcoded 2D pixel map of the tissue is created. c, Advanced fluorescence in situ hybridization (FISH)-based methods, including MERFISH,, and seqFISH+,,, allow microscopy-based identification of thousands of transcripts together with genomic loci in single cells, in addition to being compatible with limited protein readouts using fluorescent or DNA-conjugated antibody readout strategies. These high-resolution imaging methods leverage predefined optical barcoding schemes and complex encoding and readout probe designs. d, Array-based assays, including Spatial Transcriptomics (ST) and 10x Genomics Visium, make use of slides with arrayed oligo-dT spots for capturing and spatial barcoding of poly(A) RNAs followed by NGS profiling. This can be combined with upfront haematoxylin and eosin (H&E) staining or limited protein antibody staining and tissue imaging for spatial mapping. In SM-Omics and SPOTS, these technologies have also been shown to be compatible with antibody-derived tag (ADT)-conjugated antibody-based co-profiling of a larger number of proteins. e, NanoString GeoMx digital spatial profiling (DSP),, allows quantification of RNAs and proteins in specific regions of interest (ROIs) by counting uniquely barcoded oligonucleotides that are covalently linked through a UV-photocleavable linker with probes or antibodies. Tissue marker staining, imaging, ROI selection and illumination by directed UV light causes disintegration of the photocleavable linkers that are collected and profiled by NGS, followed by spatial mapping to the ROIs. cDNA, complementary DNA; gDNA, genomic DNA; OCT, optimal cutting temperature compound; UMI, unique molecular identifier.
Fig. 6
Fig. 6. Data integration strategies.
Examples of different scenarios in which various types of data integration strategies can be used. a, Vertical integration strategies aim to integrate information from paired molecular layers to obtain holistic representations of biological systems, at the single-cell level or at the tissue region level. Here, we illustrate an example of a spatial multi-omics experiment in which mirrored tissue slices have been assayed by two different spatial modalities (yellow and blue). To integrate both data sources, haematoxylin and eosin (H&E) staining images of each modality are first registered to account for deformations during sample preparation. Subsequently, to account for differences in resolutions across modalities, data points are averaged in windows of a predetermined region size. For every region the averaged regional profiles can be used as paired inputs for either linear or nonlinear vertical integration approaches. In this example, we illustrate integration through the use of a multi-view autoencoder neural network. Each modality is used as input into a dedicated encoder–decoder network that learns a shared data representation, effectively integrating both data modalities. This shared representation can be used for downstream analysis and/or visualization. The terms gi and mi correspond to the measurements of region i for modality 1 and modality 2, respectively, with g’i and m’i being the molecular profiles reconstructed from the shared representation by the decoder networks. b, Integration of datasets from different experiments with independent observations of individual cells and non-overlapping molecular features is the hardest integration problem and requires diagonal integration approaches. Here, we illustrate this problem for the integration of independently acquired single-cell RNA sequencing (scRNA-seq) and single-cell assay for transposase-accessible chromatin (scATAC-seq) datasets through the use of autoencoder neural networks with a probabilistic coupling to map the different data modalities to a shared latent space. Although single-cell resolution is lost in this coupling, clusters obtained in this shared latent space can be used to ascertain correlations between molecular layers, discover multimodal biomarkers and/or translate between the different modalities.

Similar articles

Cited by

References

    1. Regev A, et al. The Human Cell Atlas. eLife. 2017;6:e27041–e27041. doi: 10.7554/eLife.27041. - DOI - PMC - PubMed
    1. Kolodziejczyk AA, Kim JK, Svensson V, Marioni JC, Teichmann SA. The technology and biology of single-cell RNA sequencing. Mol. Cell. 2015;58:610–620. doi: 10.1016/j.molcel.2015.04.005. - DOI - PubMed
    1. Grün D, van Oudenaarden A. Design and analysis of single-cell sequencing experiments. Cell. 2015;163:799–810. doi: 10.1016/j.cell.2015.10.039. - DOI - PubMed
    1. Elmentaite R, Domínguez Conde C, Yang L, Teichmann SA. Single-cell atlases: shared and tissue-specific cell types across human organs. Nat. Rev. Genet. 2022;23:395–410. doi: 10.1038/s41576-022-00449-w. - DOI - PubMed
    1. Wen L, Tang F. Recent advances in single-cell sequencing technologies. Precis. Clin. Med. 2022;5:pbac002. doi: 10.1093/pcmedi/pbac002. - DOI - PMC - PubMed

Publication types