. 2023 Apr;20(4):351-364.
doi: 10.1038/s41423-023-00985-3. Epub 2023 Mar 2.

A SARS-CoV-2-specific CAR-T-cell model identifies felodipine, fasudil, imatinib, and caspofungin as potential treatments for lethal COVID-19

Affiliations

A SARS-CoV-2-specific CAR-T-cell model identifies felodipine, fasudil, imatinib, and caspofungin as potential treatments for lethal COVID-19

Lin Xia et al. Cell Mol Immunol. 2023 Apr.

Abstract

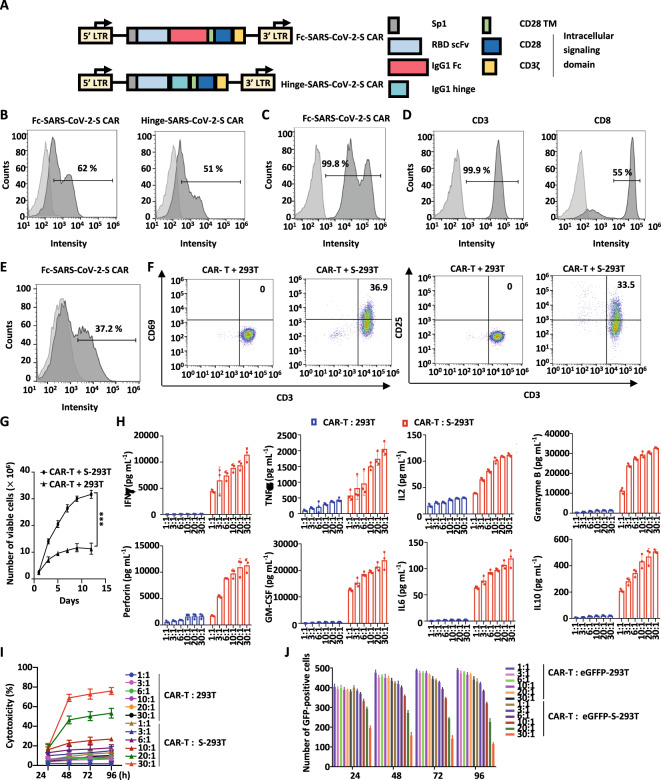
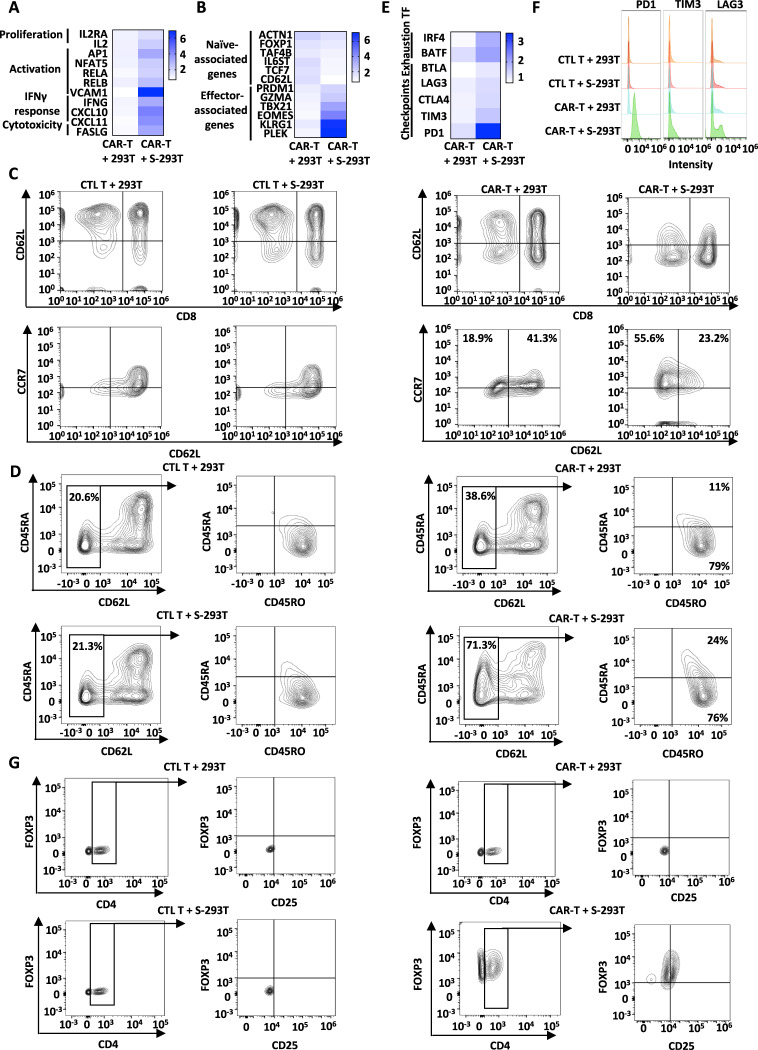
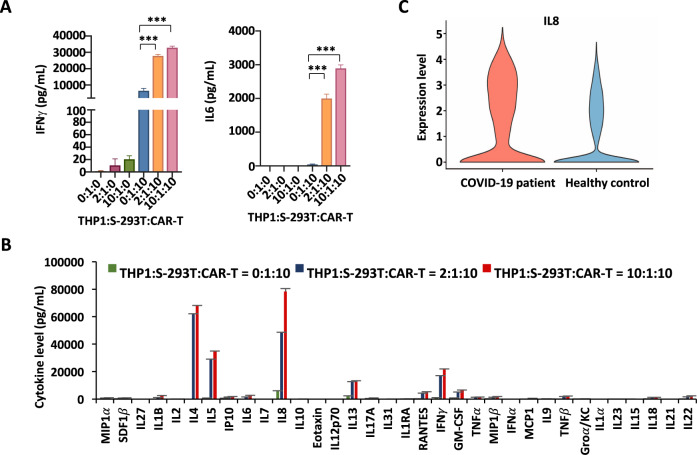
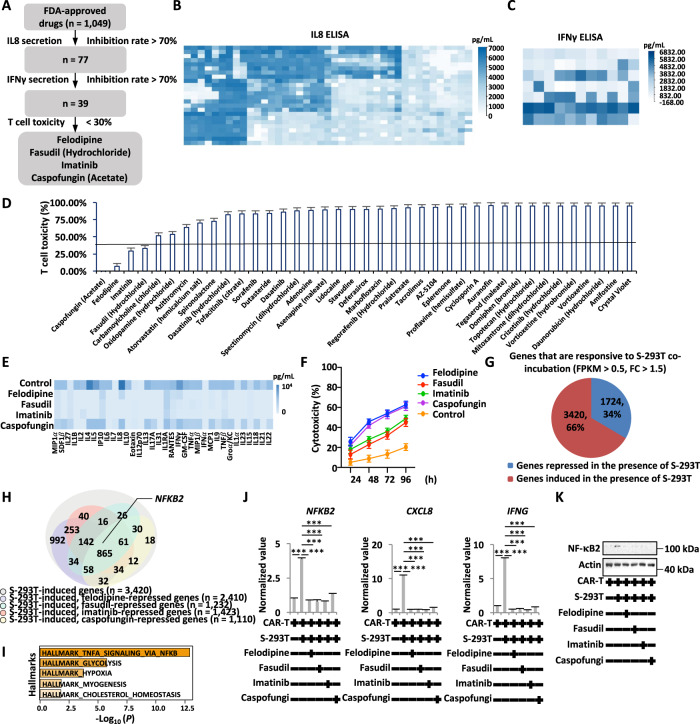
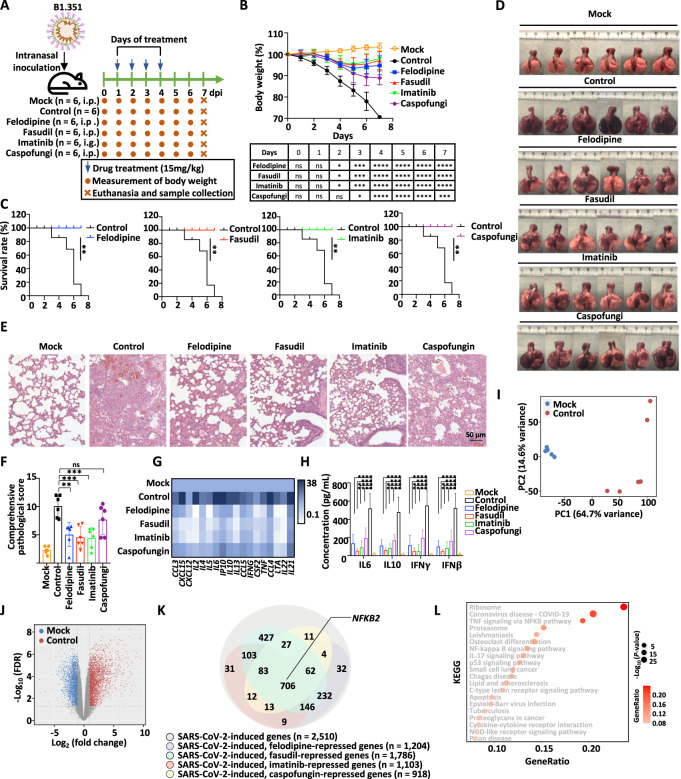
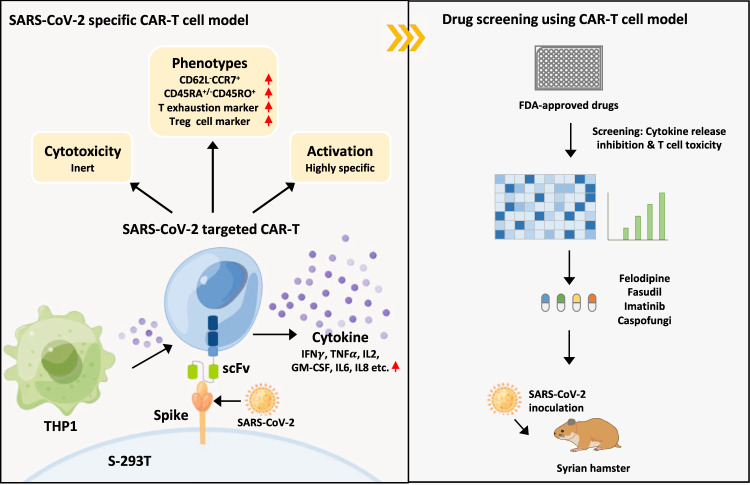
Severe acute respiratory syndrome coronavirus 2 (SARS-CoV-2)-induced cytokine storm is closely associated with coronavirus disease 2019 (COVID-19) severity and lethality. However, drugs that are effective against inflammation to treat lethal COVID-19 are still urgently needed. Here, we constructed a SARS-CoV-2 spike protein-specific CAR, and human T cells infected with this CAR (SARS-CoV-2-S CAR-T) and stimulated with spike protein mimicked the T-cell responses seen in COVID-19 patients, causing cytokine storm and displaying a distinct memory, exhausted, and regulatory T-cell phenotype. THP1 remarkably augmented cytokine release in SARS-CoV-2-S CAR-T cells when they were in coculture. Based on this "two-cell" (CAR-T and THP1 cells) model, we screened an FDA-approved drug library and found that felodipine, fasudil, imatinib, and caspofungin were effective in suppressing the release of cytokines, which was likely due to their ability to suppress the NF-κB pathway in vitro. Felodipine, fasudil, imatinib, and caspofungin were further demonstrated, although to different extents, to attenuate lethal inflammation, ameliorate severe pneumonia, and prevent mortality in a SARS-CoV-2-infected Syrian hamster model, which were also linked to their suppressive role in inflammation. In summary, we established a SARS-CoV-2-specific CAR-T-cell model that can be utilized as a tool for anti-inflammatory drug screening in a fast and high-throughput manner. The drugs identified herein have great potential for early treatment to prevent COVID-19 patients from cytokine storm-induced lethality in the clinic because they are safe, inexpensive, and easily accessible for immediate use in most countries.

Keywords: CAR-T; COVID-19; NF-κB pathway; SARS-CoV-2; anti-inflammation.


Conflict of interest statement

The authors declare no competing interests.

Figures

Fig. 1
Fig. 1
The expression, activation, and function of SARS-CoV-2 S protein-targeted CAR-T cells (SARS-CoV-2-S CAR-T). A Schematic illustration of two second-generation SARS-CoV-2-S CAR constructs. The CAR is composed of a signal peptide of the interleukin (IL)2 receptor (Sp1), an anti-RBD scFv, a spacer (IgG1 Fc or IgG1 hinge), a CD28 transmembrane domain (CD28 TM), and intracellular signaling domains (CD28 and CD3ζ). The spacers IgG1 Fc and IgG1 hinge were used in Fc-SARS-CoV-2-S and Hinge-SARS-CoV-2-S CAR constructs, respectively. B 293 T cells transfected with a control lentiviral vector (CTL vector) or SARS-CoV-2-S CAR expression vectors as described in A were stained with eGFP-tagged S protein followed by flow cytometry analysis. Light gray, CTL vector; dark gray, SARS-CoV-2-S CAR. C 293 T cells transfected with a CTL vector or Fc-SARS-CoV-2-S CAR expression vector as described in A were stained with an APC-conjugated anti-human IgG-Fc antibody followed by flow cytometry analysis. Light gray, CTL vector; dark gray, Fc-SARS-CoV-2-S CAR. D Primary T lymphocytes from a healthy donor were expanded and stained with an anti-CD3 antibody conjugated with FITC (CD3-FITC) (left panel) or an anti-CD8 antibody conjugated with APC (CD8-APC) (right panel) followed by flow cytometry analysis. Light gray, blank; dark gray, CD3 or CD8 staining. E Primary T lymphocytes infected with control lentivirus (CTL lentivirus) or Fc-SARS-CoV-2-S CAR lentivirus as described in A were stained with an APC-conjugated anti-human IgG-Fc antibody followed by flow cytometry analysis. Light gray, CTL lentivirus; dark gray, Fc-SARS-CoV-2 CAR-S lentivirus. F SARS-CoV-2-S CAR-T cells were incubated with 293 T cells or 293 T cells transfected with S protein (S-293T cells) at a ratio of 3:1 for two days, and T cells in suspension were separated from adherent 293 T cells and costained with CD3-APC and CD69-PE or CD25-FITC followed by flow cytometry analysis. G SARS-CoV-2-S CAR-T cells were incubated with 293 T or S-293T cells and maintained in culture medium for the indicated durations. The number of viable cells was counted at the indicated time points (mean ± s.e.m, ***P < 0.001). H SARS-CoV-2-S CAR-T cells were incubated with 293 T or S-293T cells at different ratios (1:1, 3:1, 6:1, 10:1, 20:1 or 30:1) for three days before measuring the secretion of cytokines, including IFNγ, TNFα, IL2, granzyme B, perforin, GM-CSF, IL6, and IL10. CTL T cells were used as a negative control (mean ± s.e.m). I SARS-CoV-2-S CAR-T cells were incubated with 293 T or S-293T cells at different ratios for the indicated durations, followed by a cytotoxicity assay (mean ± s.e.m). J SARS-CoV-2-S CAR-T cells were incubated with 293 T cells fused with eGFP (eGFP-293T) or 293 T cells expressing spike fused with eGFP (eGFP-S-293T) at different ratios for the indicated duration, followed by GFP fluorescence detection. The number of GFP-positive cells was counted (mean ± s.e.m)
Fig. 2
Fig. 2
Phenotypical characterization of SARS-CoV-2-S CAR-T cells upon antigen stimulation. SARS-CoV-2-S CAR-T cells were incubated with 293 T or S-293T cells at a ratio of 3:1 for two days, and T cells in suspension were separated from adherent 293 T cells and collected, followed by RNA extraction and RT‒qPCR analysis to examine the expression of representative genes associated with T-cell proliferation, activation, IFNγ response and cytotoxicity (A), naive and effector T-cell gene signatures (B), and check points and transcription factors (E). The significance test is shown in Fig. S2 (*P < 0.05; **P < 0.01; ***P < 0.001). C CTL T or SARS-CoV-2-S CAR-T cells were incubated with or without 293 T or S-293T cells at a ratio of 3:1 for two days, and T cells in suspension were separated from adherent 293 T cells and stained with an anti-CD8 antibody conjugated with APC (CD8-APC), an anti-CD62L antibody conjugated with PE (CD62L-PE), and an anti-CCR7 antibody conjugated with FITC (CCR7-FITC) followed by flow cytometry analysis. D CAR-T cells as described in A were subjected to staining with an anti-CD45RA antibody conjugated with APC (CD45RA-APC), an anti-CD45RO antibody conjugated with FITC (CD45RO-FITC), and an anti-CD62L antibody conjugated with PE (CD62L-PE). Coexpression of CD62L and CD45RA was analyzed by flow cytometry. The expression of CD45RO and CD45RA was further measured on gated CD62L-negative cells. F CAR-T cells as described in A were subjected to staining with an anti-PD1 antibody conjugated with FITC (PD1-FITC), an anti-TIM3 antibody conjugated with APC (TIM3-APC) and an anti-LAG3 antibody conjugated with PE (LAG3-PE) followed by flow cytometry analysis. G CAR-T cells as described in A were subjected to staining with an anti-CD25 antibody conjugated with APC (CD25-APC), an anti-CD4 antibody conjugated with PE (CD4-PE) and an anti-FOXP3 antibody conjugated with Alexa Fluor® 488 (FOXP3-488). Coexpression of CD4 and FOXP3 was analyzed by flow cytometry. The expression of CD25 and FOXP3 was further measured on gated CD4-positive cells. All data are representative of three independent experiments
Fig. 3
Fig. 3
Monocytes enhance the cytokine release of SARS-CoV-2-S CAR-T cells. A THP1, S-293T, and SARS-CoV-2-S CAR-T cells were mixed at the indicated ratios for three days before measuring the secretion of IFNγ and IL6 (mean ± s.e.m, ***P < 0.001). Data presented are the mean (± s.e.m) from three repeats. B Cells as described in A were subjected to measurement of the secretion of multiple cytokines by a multiplex bead array (mean ± s.e.m). C The violin plot shows the expression of IL8 (CXCL8) in the PBMCs of COVID-19 patients and healthy controls (***P < 0.001)
Fig. 4
Fig. 4
Felodipine, fasudil, imatinib, and caspofungin, screened by the SARS-CoV-2-S CAR-T-cell model, suppress cytokine release. A The flowchart for drug screening that can suppress SARS-CoV-2-induced inflammation based on the SARS-CoV-2-S CAR-T-cell model is shown. B S-293T, SARS-CoV-2-S CAR-T, and THP1 cells (1:10:10) were coincubated and treated with or without individual drugs (10 μM) from an FDA-approved library (~1049) before measuring the secretion of IL8 in the culture supernatants by ELISA. C The culture supernatants from drugs with more than 70% inhibition of IL8 secretion screened from B were further subjected to measurement of IFNγ by ELISA. D T cells were treated with drugs with more than 70% inhibition of IFNγ secretion screened from C for three days followed by toxicity assay (mean ± s.e.m). E S-293T, SARS-CoV-2-S CAR-T, and THP1 cells (1:10:10) were coincubated and treated with or without felodipine (#1), fasudil (#2), imatinib (#3), or caspofungin (#4) (10 μM) for three days before measuring the secretion of cytokines by a multiplex bead array. The inhibition rate is presented by a heatmap. F SARS-CoV-2-S CAR-T cells coincubated with S-293T cells (5:1) were treated with or without felodipine (#1), fasudil (#2), imatinib (#3), or caspofungin (#4) (10 μM) for the indicated duration, followed by a cytotoxicity assay (mean ± s.e.m). G SARS-CoV-2-S CAR-T cells were incubated with control 293 T or S-293T cells at a ratio of 3:1 for two days, and cells in suspension were subjected to RNA-seq analysis. Genes up- and downregulated by S-293T cells are shown in a pie chart (FDR < 0.01, FC > 1.5). H SARS-CoV-2-S CAR-T cells incubated with S-293T cells were treated with or without felodipine, fasudil, imatinib, or caspofungin (10 μM) for two days, and cells in suspension were subjected to RNA-seq analysis. Genes that were upregulated by S-293T cells but suppressed by felodipine, fasudil, imatinib, and caspofungin are shown. I Hallmark gene set enrichment analysis for overlapping genes (n = 865) as described in H. J, K SARS-CoV-2-S CAR-T cells were incubated with S-293T cells and treated with or without felodipine, fasudil, imatinib, or caspofungin (10 μM) for two days. T cells in suspension were subjected to RT‒qPCR analysis (J) to examine the expression of genes as indicated or immunoblotting analysis (K) using antibodies as indicated (Student’s t test, unpaired, two-tailed, *P < 0.05; **P < 0.01; ***P < 0.001)
Fig. 5
Fig. 5
Felodipine, fasudil, imatinib, and caspofungin attenuate lethal inflammation, ameliorate severe pneumonia, and prevent mortality in SARS-CoV-2-infected Syrian hamsters. A Schematic representation of SARS-CoV-2 infection and drug treatment. Hamsters were intranasally inoculated with SARS-CoV-2 (1 × 104 PFU) and then treated with or without felodipine (i.p.), fasudil (i.p.), imatinib (i.g.), or caspofungin (i.p.) on the indicated days (n = 6). Hamsters intranasally inoculated with SARS-CoV-2 without treatment were used as controls. Body weight was measured daily. Animals were euthanized to collect tissue samples at Day 7 post infection for virological and histological analysis. B The body weight of hamsters in each group from Day 0 to 7 post infection is shown. Significance was calculated using two-way ANOVA and is shown in the table (*P < 0.05, **P < 0.01, ***P < 0.001, ****P < 0.0001, ns: nonsignificant). C The survival curve for hamsters in each group from Day 0 to 7 post infection is shown. Significance was calculated using the log-rank (Mantel‒Cox) test (**P < 0.01). D Gross images of lung tissues collected from hamsters at Day 7 post infection are shown. E Representative images after H&E staining for lung lobe sections in hamsters at Day 7 post infection are shown. Scale bars, 50 μm. F Comprehensive pathological scores based on the severity and percentage of injured areas for each lung lobe for lung sections shown in Fig. S3A are shown. Significance was calculated using one-way ANOVA (*P < 0.05, **P < 0.01, ***P < 0.001, ****P < 0.0001, ns: nonsignificant). G The expression of inflammatory genes in lung tissues collected from hamsters at Day 7 post infection was detected by RT‒qPCR and represented by a heatmap. Data presented are the normalized value to the mock group after normalization to the expression of β-actin. The significance test is shown in Fig. S3B (*P < 0.05; **P < 0.01; ***P < 0.001). H The levels of cytokines, including IL6, IL10, IFNγ, and IFNβ in the lung tissues collected from hamsters at Day 7 post infection were measured by ELISA. Significance was calculated using one-way ANOVA (*P < 0.05, **P < 0.01, ***P < 0.001, ****P < 0.0001). I RNA was extracted from the lungs of hamsters as described in A at Day 7 post infection followed by RNA-seq analysis. The similarity in the gene expression profile for the mock and SARS-CoV-2-infected groups is shown by a PCA plot. J Genes regulated by SARS-CoV-2 infection are shown in a volcano plot. Blue and red dots represent down- and upregulated genes, respectively (FDR < 0.01, FC > 1.5). K Genes that were upregulated by SARS-CoV-2 infection as shown in J but repressed by felodipine, fasudil, imatinib, and caspofungin are shown in a Venn diagram. L KEGG analysis for those 706 genes that were upregulated by SARS-CoV-2 infection but commonly suppressed by felodipine, fasudil, imatinib, and caspofungin as described in K is shown
Fig. 6
Fig. 6
A SARS-CoV-2-specific CAR-T-cell model identifies felodipine, fasudil, imatinib, and caspofungin as effective treatments for SARS-CoV-2-infected Syrian hamsters. We demonstrated the feasibility of producing SARS-CoV-2-S CAR-T cells that have immunological profiles similar to those of T cells from COVID-19 patients in the presence of the S protein. This CAR-T-cell model can be used to screen drugs to suppress SARS-CoV-2-induced cytokine release. Among the drugs screened, felodipine, fasudil, imatinib, and caspofungin are effective in protecting against SARS-CoV-2-induced lethal inflammation in Syrian hamsters

Similar articles

Cited by

References

    1. Zhou F, Yu T, Du R, Fan G, Liu Y, Liu Z, et al. Clinical course and risk factors for mortality of adult inpatients with COVID-19 in Wuhan, China: a retrospective cohort study. Lancet. 2020;395:1054–62. doi: 10.1016/s0140-6736(20)30566-3. - DOI - PMC - PubMed
    1. Azkur AK, Akdis M, Azkur D, Sokolowska M, van de Veen W, Brüggen MC, et al. Immune response to SARS-CoV-2 and mechanisms of immunopathological changes in COVID-19. Allergy. 2020;75:1564–81. doi: 10.1111/all.14364. - DOI - PMC - PubMed
    1. Tufan A, Avanoğlu Güler A, Matucci-Cerinic M. COVID-19, immune system response, hyperinflammation and repurposing antirheumatic drugs. Turkish J Med Sci. 2020;50:620–32. doi: 10.3906/sag-2004-168. - DOI - PMC - PubMed
    1. Mangalmurti N, Hunter CA. Cytokine Storms: Understanding COVID-19. Immunity. 2020;53:19–25. doi: 10.1016/j.immuni.2020.06.017. - DOI - PMC - PubMed
    1. Yang L, Xie X, Tu Z, Fu J, Xu D, Zhou Y. The signal pathways and treatment of cytokine storm in COVID-19. Signal Transduct Target Ther. 2021;6:255.. doi: 10.1038/s41392-021-00679-0. - DOI - PMC - PubMed

Publication types