. 2023 Jul;19(7):825-836.
doi: 10.1038/s41589-023-01270-0. Epub 2023 Mar 2.

Remodeling oncogenic transcriptomes by small molecules targeting NONO

Affiliations

Remodeling oncogenic transcriptomes by small molecules targeting NONO

Stefan G Kathman et al. Nat Chem Biol. 2023 Jul.

Abstract

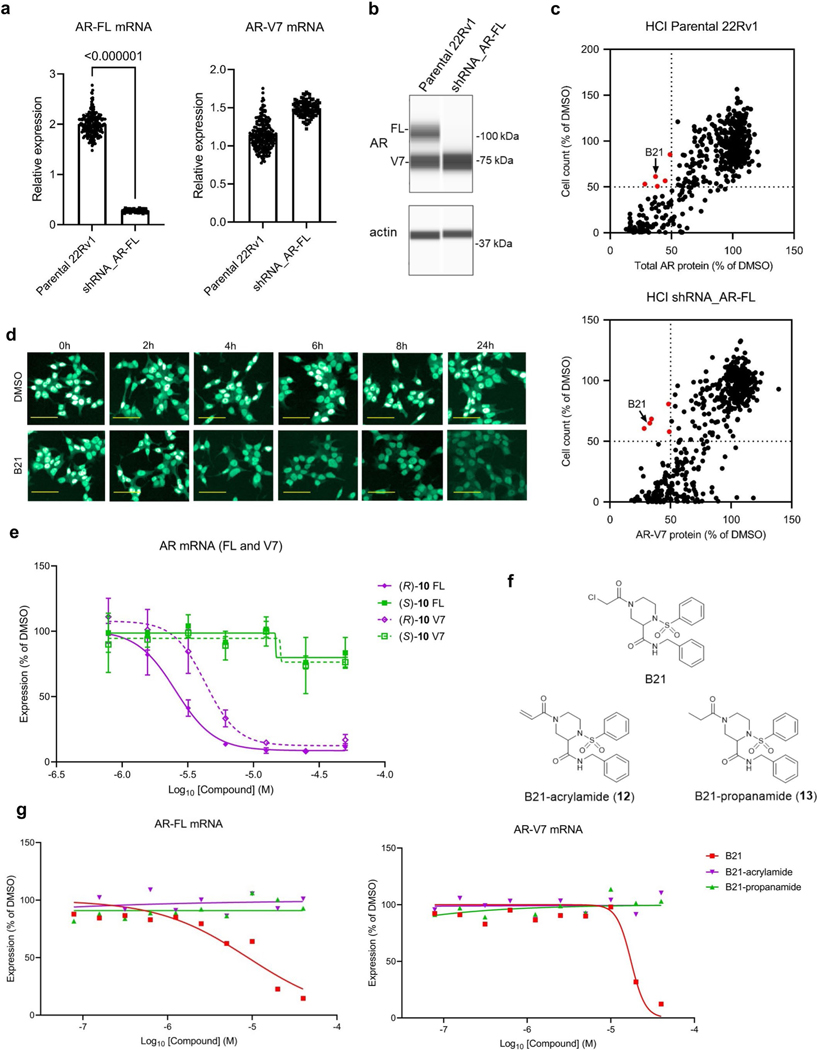
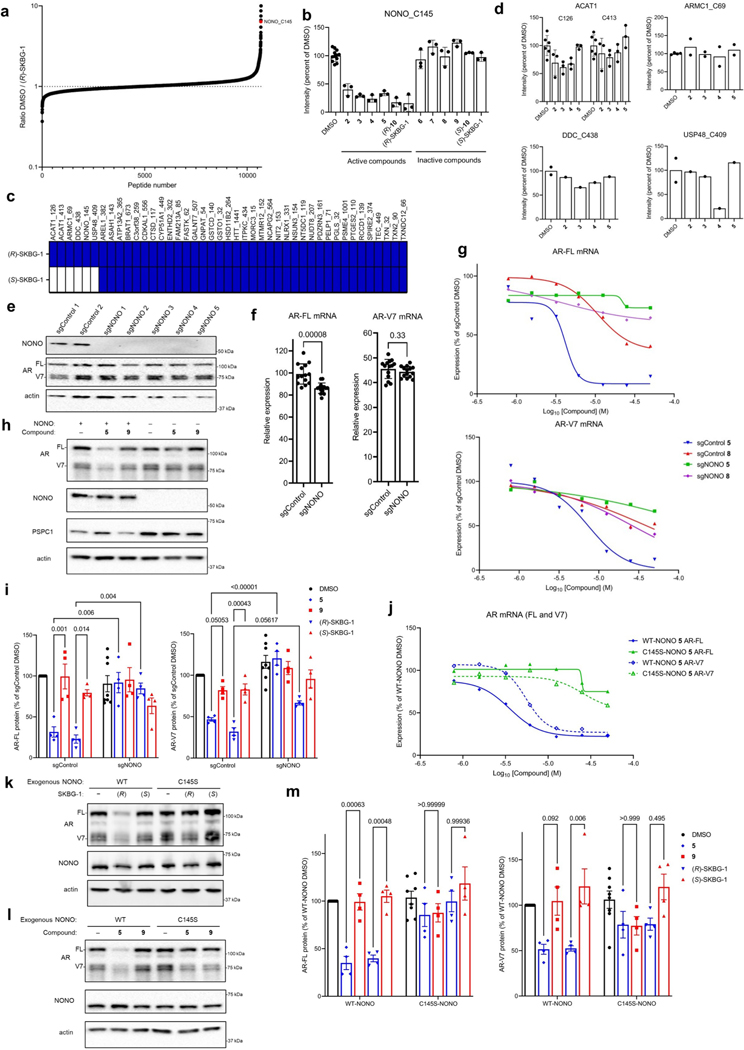
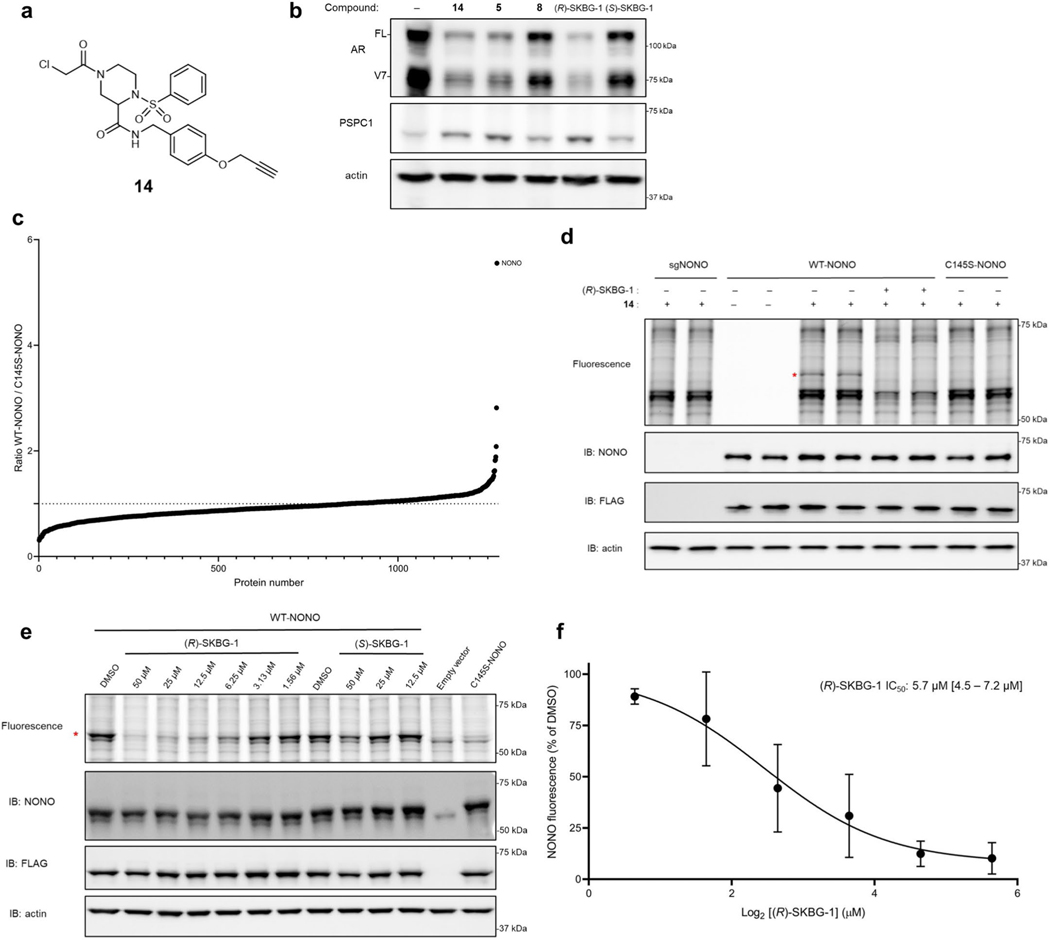
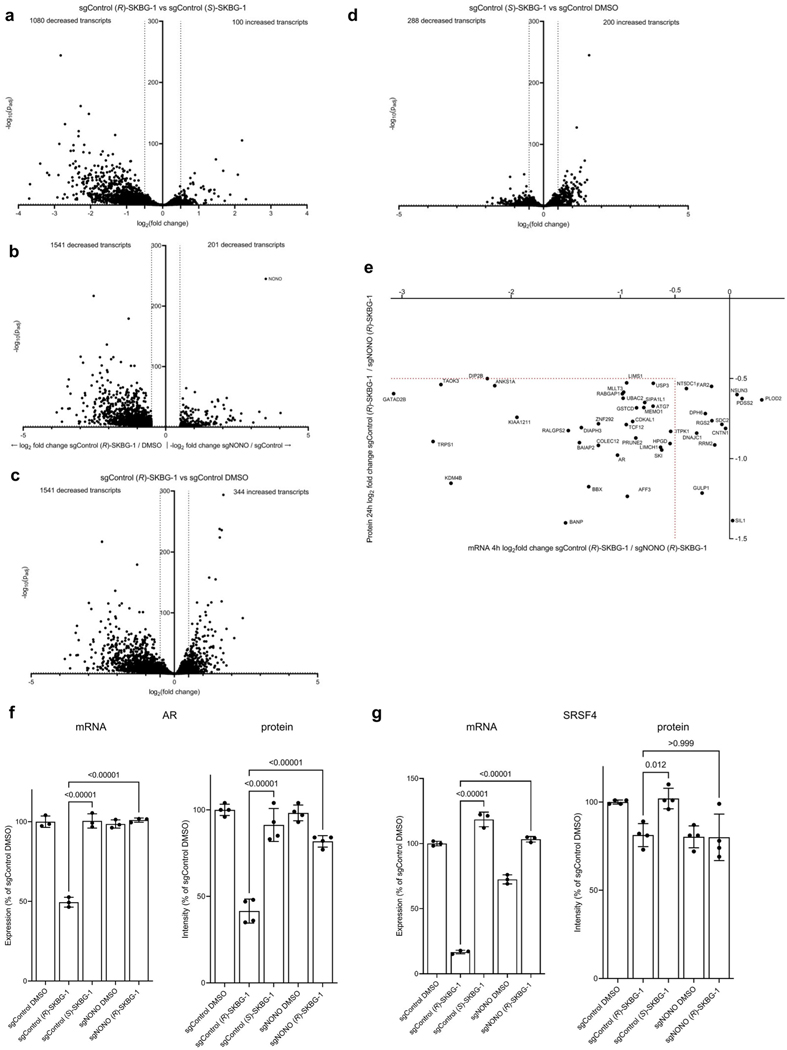
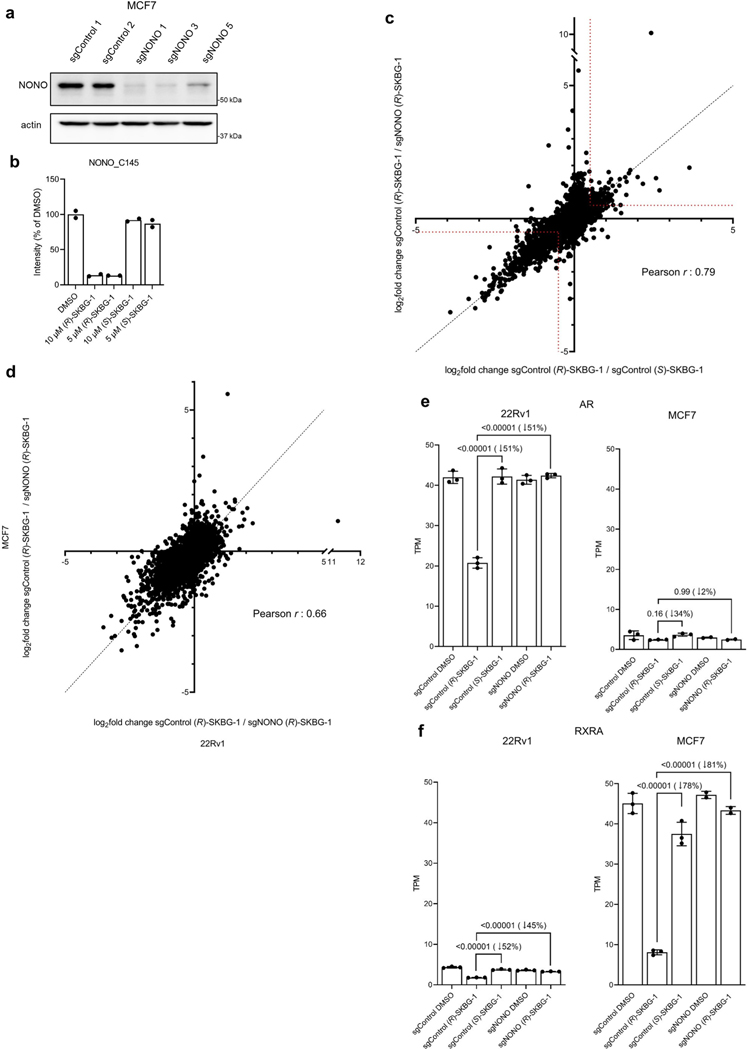
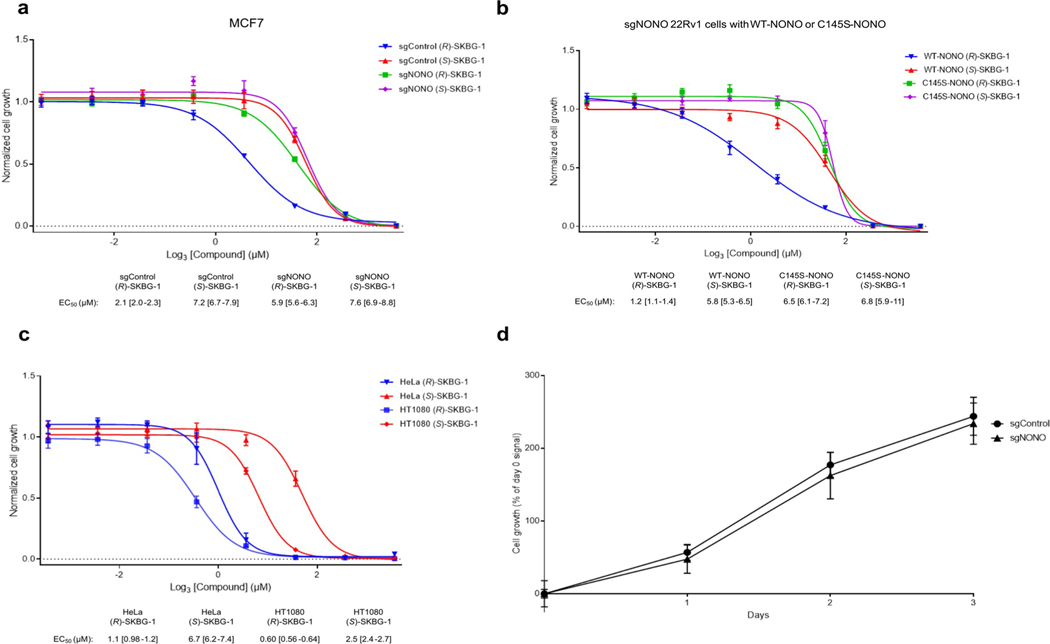
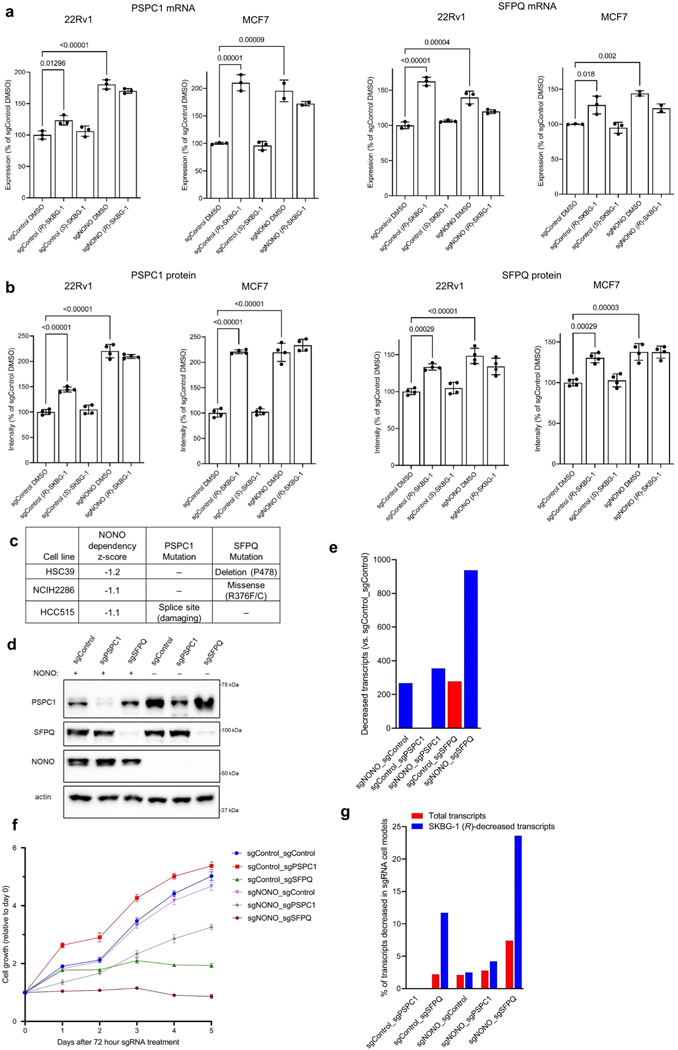
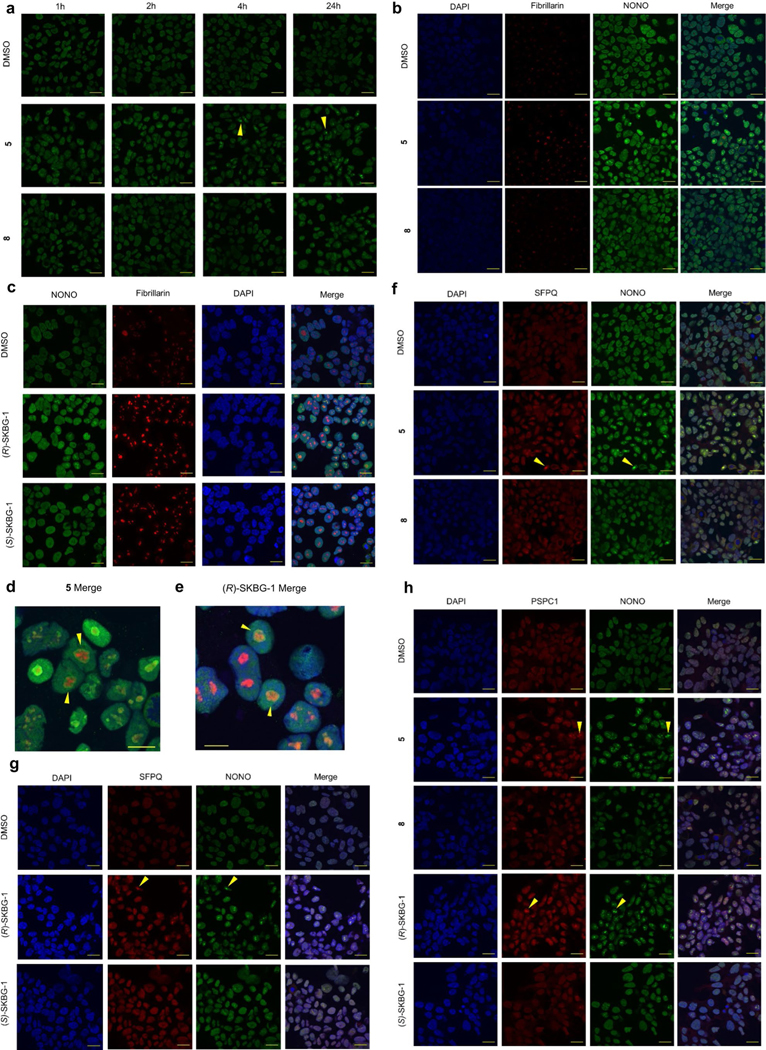
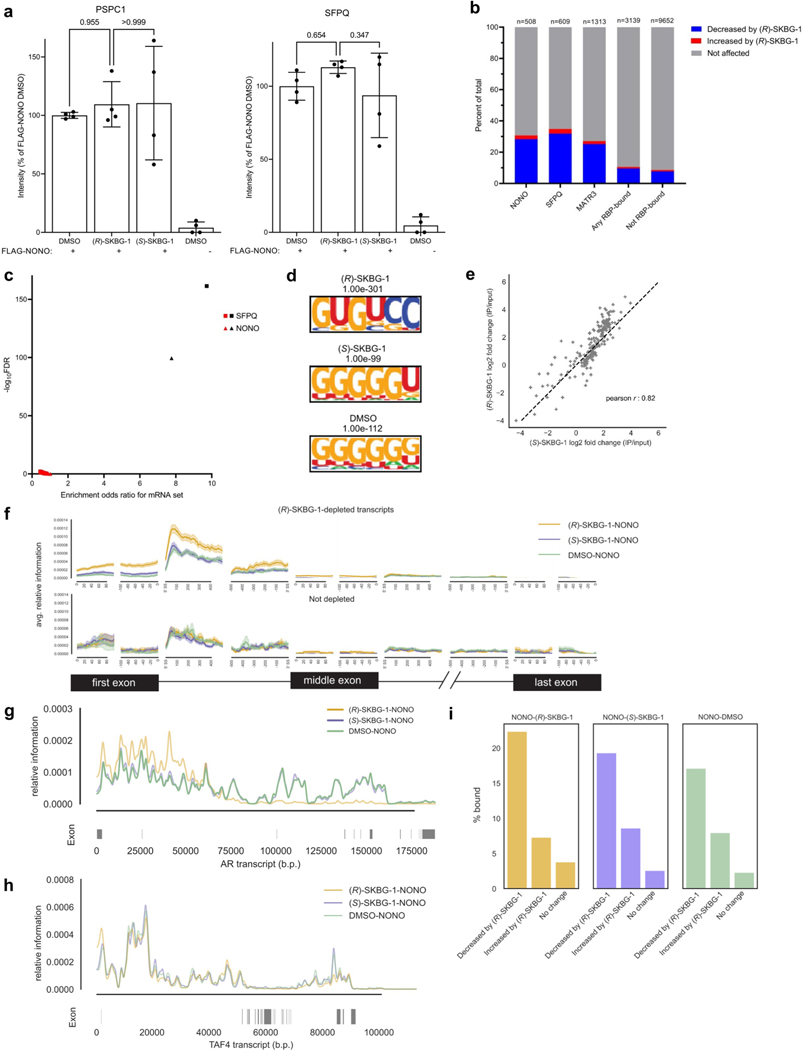
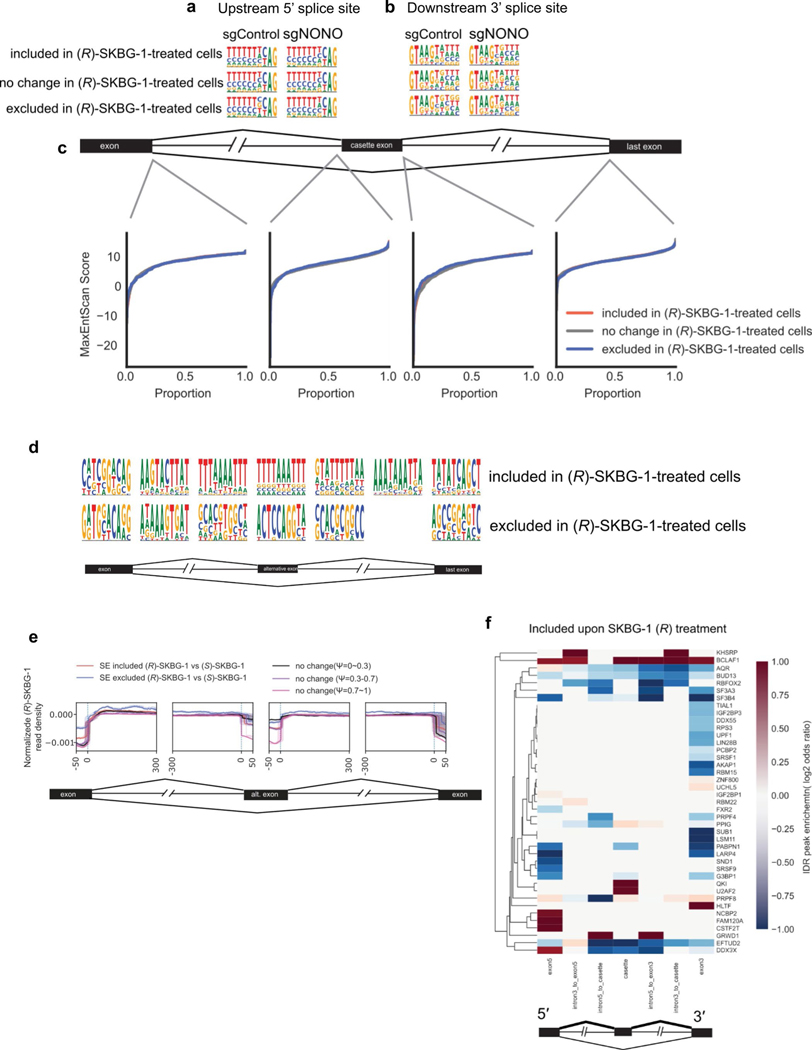
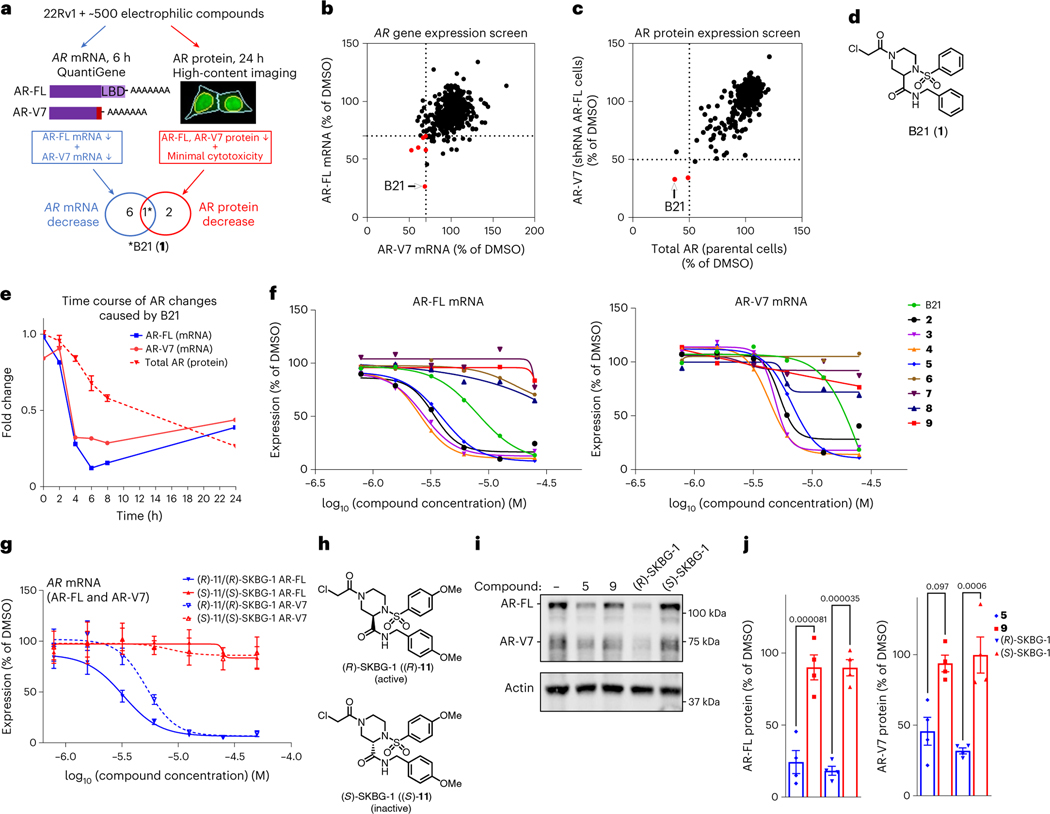
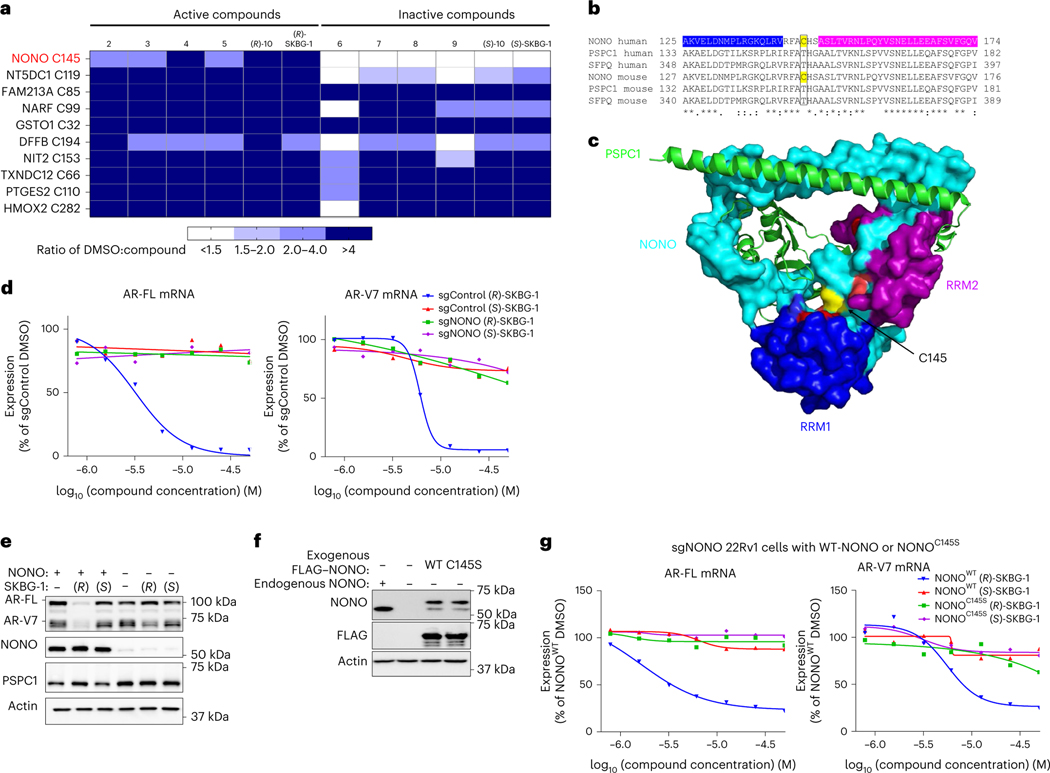
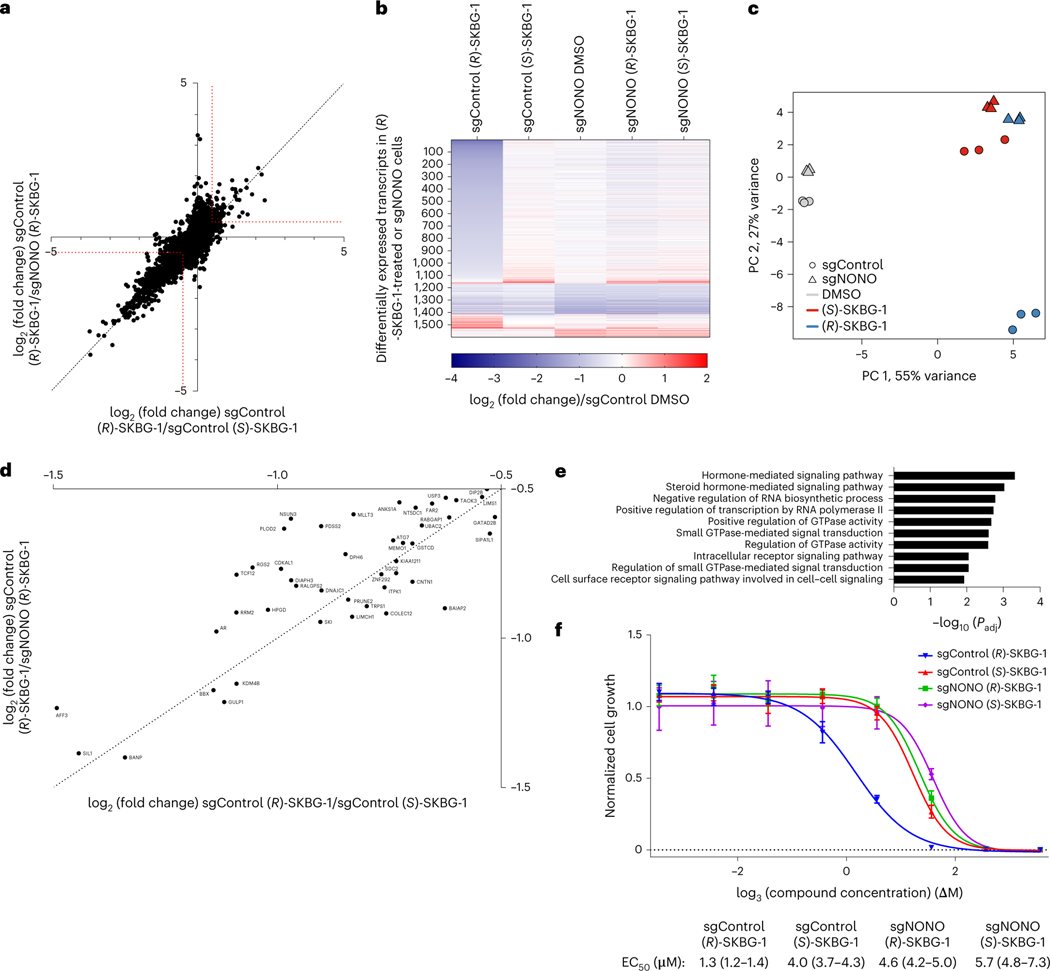
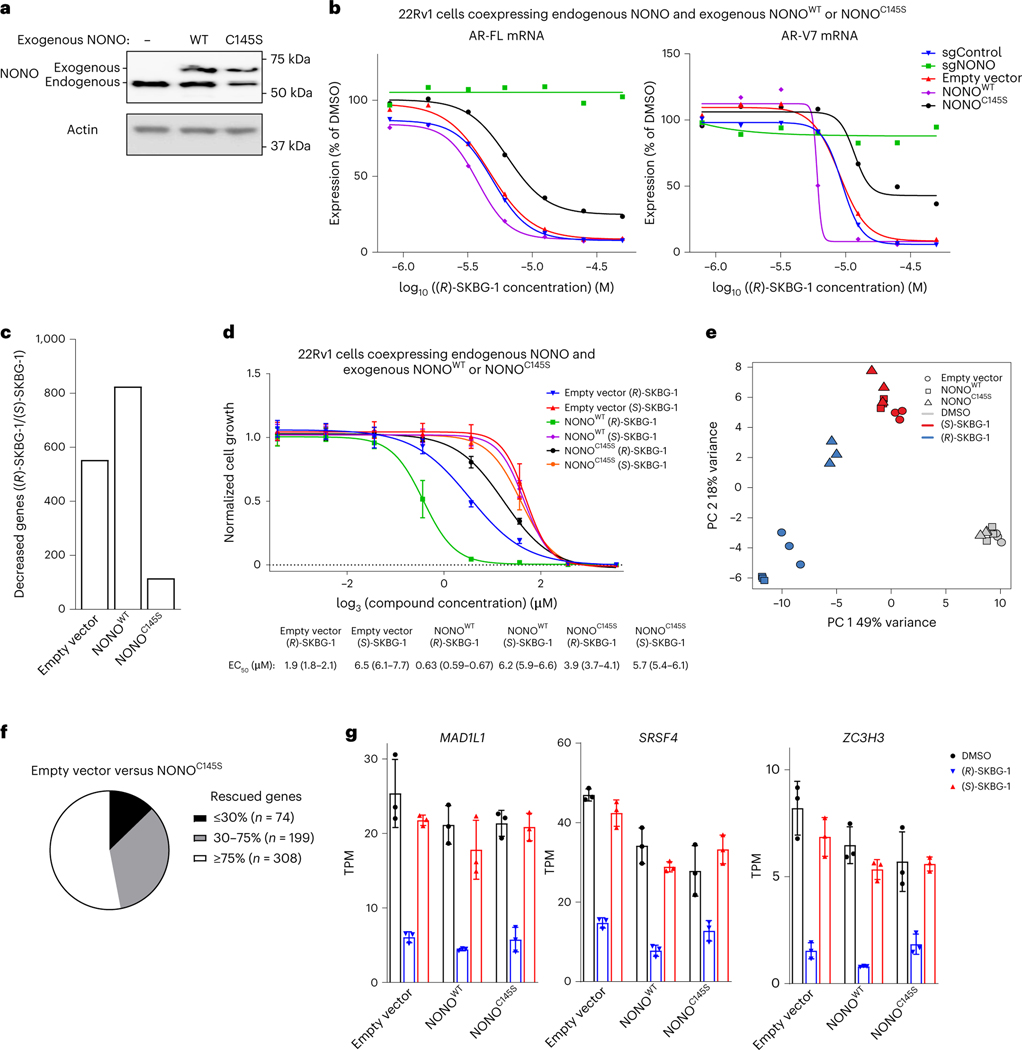
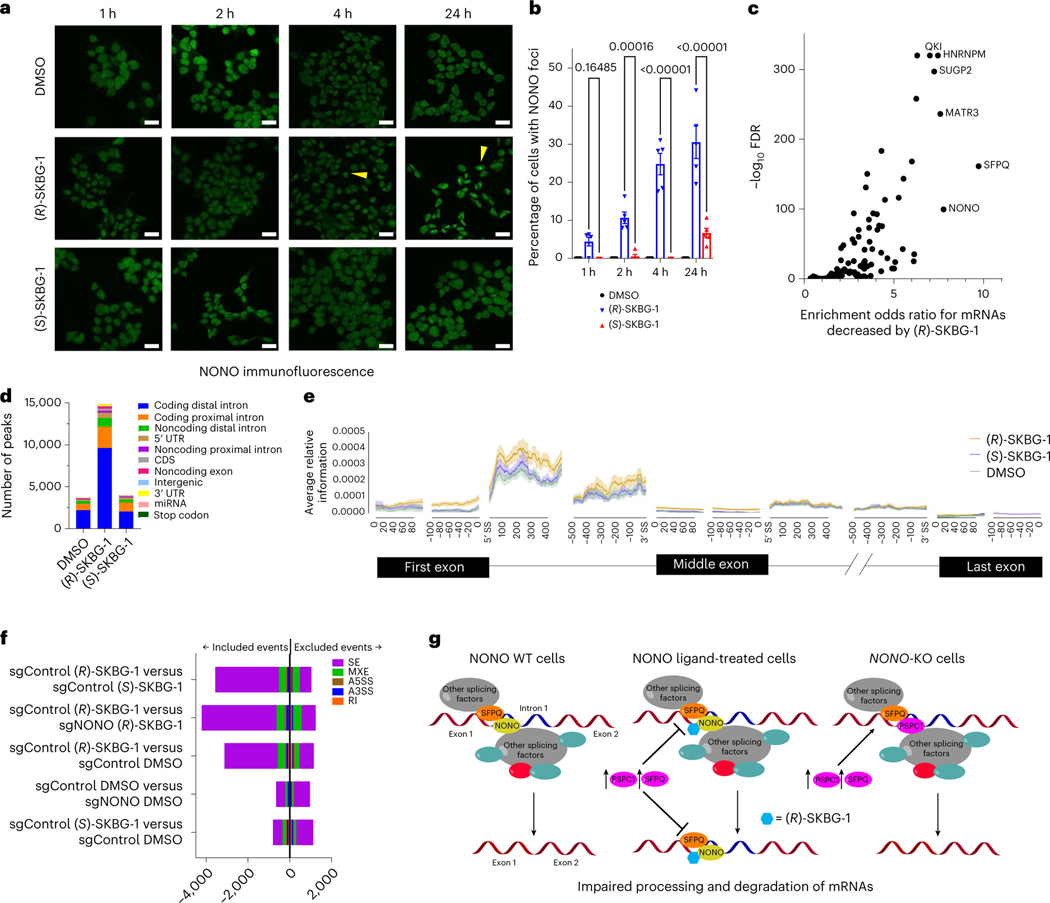
Much of the human proteome is involved in mRNA homeostasis, but most RNA-binding proteins lack chemical probes. Here we identify electrophilic small molecules that rapidly and stereoselectively decrease the expression of transcripts encoding the androgen receptor and its splice variants in prostate cancer cells. We show by chemical proteomics that the compounds engage C145 of the RNA-binding protein NONO. Broader profiling revealed that covalent NONO ligands suppress an array of cancer-relevant genes and impair cancer cell proliferation. Surprisingly, these effects were not observed in cells genetically disrupted for NONO, which were instead resistant to NONO ligands. Reintroduction of wild-type NONO, but not a C145S mutant, restored ligand sensitivity in NONO-disrupted cells. The ligands promoted NONO accumulation in nuclear foci and stabilized NONO-RNA interactions, supporting a trapping mechanism that may prevent compensatory action of paralog proteins PSPC1 and SFPQ. These findings show that NONO can be co-opted by covalent small molecules to suppress protumorigenic transcriptional networks.


Conflict of interest statement

Competing interests

The authors declare no other competing financial interests.

Figures

Extended Data Fig. 1 |
Extended Data Fig. 1 |. Discovery of electrophilic compounds that deplete AR mRNA and protein.
a, AR-FL and AR-V7 mRNA content in parental 22Rv1 cells and 22Rv1 cells stably expressing an shRNA targeting AR-FL (shRNA_ARFL cells) as quantified by QuantiGene assays and normalized relative to a set of housekeeping genes. Data are mean values ± s.e.m. for 96 data points from two independent experiments. p values from unpaired t-test (two-tailed) are indicated above the bars. b, Western blot showing AR-FL and AR-V7 protein content in parental 22Rv1 cells and shRNA_AR-FL 22Rv1 cells. Data are from a single experiment representative of at least two independent experiments. c, AR protein content and cell counts (used as a cytotoxicity estimate counter screen) measured by high content imaging (HCI) after treatment of parental (upper) or shRNA_AR-FL (lower) 22Rv1 cells with electrophilic compounds (10 μM, 24 h). Hit compounds depleting AR protein content by ≥ 50% while maintaining cell counts ≥ 50% relative to DMSO are highlighted in red. See Supplementary Table 3 for structures of other hit compounds in addition to B21. d, Representative HCI images of time-dependent effects of hit compound B21 (25 μM) on total AR protein in 22Rv1 cells. See Fig. 1e for quantification of these data. Scale bar: 50 μM. e, Concentration-dependent effects of active (R)-10 and inactive (S)-10 enantiomers (see Table 1 for compound structures) on AR-FL and AR-V7 mRNA in 22Rv1 cells. Compound treatments were for 6 h, and Data are mean values ± s.e.m. for four replicates of a single experiment representative of two independent experiments. f, Structures of B21 (1) and analogues where the α-chloroacetamide reactive group was replaced with an acrylamide (12) or non-electrophilic propanamide (13). g, Concentration-dependent effects of B21, 12, and 13 on ARFL and AR-V7 mRNA in 22Rv1 cells. Compound treatments were for 6 h, and Data are mean values for two replicates of a single experiment representative of two independent experiments.
Extended Data Fig. 2 |
Extended Data Fig. 2 |. Active compounds suppress AR expression by targeting NONO.
a, Global cysteine reactivity profiles of 22Rv1 cells treated with DMSO or (R)-SKBG-1 (20 μM, 1 h) as determined by MS-ABPP. Data are mean values from three independent experiments, where cysteines were quantified in at least two experiments. Maximum quantifiable ratio values were set at 10 and 0.1. The ratio for NONO_C145 is marked in red. b, Quantification of NONO_C145 engagement by active (2–5, (R)-10 and (R)-SKBG-1) and inactive (6–9, (S)-10 and (S)-SKBG-1) compounds as determined by MS-ABPP. Data are mean values ± s.e.m for three independent experiments. c Heat map showing cysteines substantially (> 75%) engaged by (R)-SKBG-1 (20 μM) at 6 h in 22Rv1 cells and their corresponding engagement by (S)-SKBG-1 as determined by MS-ABPP. Blue and white respectively designate cysteines engaged ≥ 50% or < 50% by the indicated compounds. d, Engagement of the stereoselective targets of (R)-SKBG-1 from (c) by other active compounds 25 (20 μM, 1 h) in MS-ABPP experiments. For c, d, data represent mean values from three independent experiments. For a-d, see Supplementary Data 1 for full MS-ABPP data. e, Western blot showing NONO and AR-FL and V7 protein content of sgControl and sgNONO 22Rv1 cell populations generated by CRISPR-Cas9. sgControl 1 and sgNONO 5 cells were used for subsequent experiments. Data are from a single experiment representative of two independent experiments. f, AR-FL and AR-V7 mRNA content of sgControl and sgNONO cells. Data are mean values ± s.e.m. for 14 data points from two independent experiments. p values from unpaired t-tests. g, Concentrationdependent effects of active compound 5 and inactive control 8 (6 h treatments) on AR-FL (left) and AR-V7 (right) mRNA content of sgControl and sgNONO cells. Data are mean values for two replicates of a single experiment representative of two independent experiments. h, Western blots showing AR-FL and AR-V7 protein content in sgControl (NONO+) or sgNONO (NONO-) cells treated with active compound 5 and inactive control 9 (20 μM, 24 h). Also shown are western blotting signals for NONO and PSPC1. i, Quantification of western blotting data for AR-FL and AR-V7 in h and Fig. 2e. Data are mean values ± s.e.m. for four independent experiments. p values from two-way ANOVA. j, Concentration-dependent effects of compound 5 (6 h treatment) on AR-FL and AR-V7 mRNA content of sgNONO cells expressing WT-NONO or C145S-NONO. Data are mean values for two replicates of a single experiment representative of two independent experiments. For g and j, AR mRNAs were quantified by QuantiGene. k, l, Western blots showing AR-FL and AR-V7 protein content of sgNONO cells expressing WT-NONO or C145SNONO treated with active compounds (R)-SKBG-1 (k) or 5 (l) and inactive controls (S)-SKBG-1 (k) or 9 (l) (20 μM compounds, 24 h). m, Quantification of western blotting data for AR-FL and AR-V7 in k and l. Data are mean values ± s.e.m. for four independent experiments. p values from two-way ANOVA.
Extended Data Fig. 3 |
Extended Data Fig. 3 |. Confirming direct engagement of NONO_C145 by active compounds using alkyne probe 14.
a, Structure of alkyne probe 14. b, Western blots showing effects of alkyne probe 14 on AR-FL and AR-V7 protein content of 22Rv1 cells. Active compounds 5 and (R)-SKBG-1 and inactive control compounds 8 and (S)-SKBG-1 are shown for comparison. Cells were treated with 20 μM of each compound for 24 h. Also shown are western blotting signals for PSPC1. Data are from a single experiment representative of two independent experiments. c, Waterfall plot showing global protein enrichment profiles from MS-ABPP experiments performed with alkyne 14-treated sgNONO 22Rv1 cells expressing FLAG-WT- or C145S-NONO. Cells were treated with 20 μM of 14 for 1 h prior to lysis and enrichment and quantification of 14-labeled proteins (see Methods section for more details). Data are presented as the ratio of enrichment of proteins from WT-NONO/C145S-NONO cells. Data are average values for all quantified peptides for each protein from two independent replicates. d, Gel-based ABPP experiment showing that alkyne 14 labels WT-NONO, but not C145S-NONO expressed as FLAG epitope-tagged proteins in sgNONO 22Rv1 cells. sgNONO cells (with or without exogenous expression of WT- or C145S-NONO) were pretreated with DMSO or (R)-SKBG-1 (20 μM, 2 h) followed by DMSO or alkyne 14 (20 μM, 1 h), lysed, conjugated to a rhodamine-azide (Rh-N3) by copper-catalyzed azide-alkyne cycloaddition chemistry, and analyzed by SDS-PAGE and in-gel fluorescence. e, Concentration-dependent effects of (R)-SKBG-1 and (S)-SKBG-1 on alkyne 14 labeling of FLAG-tagged WT-NONO expressed in HEK cells. Cells were treated with (R)-SKBG-1 or (S)-SKBG-1 for 2 h, followed by 14 (20 μM, 1 h), and then processed as described in d. Mock (empty vector-transfected) cells and cells expressing FLAG-tagged C145S-NONO are shown as controls. For d and e, red asterisk marks band corresponding to the MW of FLAG-NONO. IB, immunoblot. f, Quantification of blockade of 14 labeling of recombinant FLAG-WT-NONO by (R)-SKBG-1. Data are mean values ± s.e.m. for four independent experiments. 95% confidence interval or calculated IC50 value is shown in brackets.
Extended Data Fig. 4 |
Extended Data Fig. 4 |. Global effects of NONO ligands on the transcriptomes and proteomes of cancer cells.
a, Volcano plot of mRNA log2 fold changes in (R)-SKBG-1-treated sgControl cells/(S)-SKBG-1-treated sgControl cells. Dotted lines indicate cutoffs for genes with significantly decreased (log2 fold change ≤ −0.5, padj ≤ 0.01) or increased (log2 fold change ≥ 0.5, padj ≤ 0.01) expression. log2 fold change values are mean values from three independent replicates. Plotted are protein-coding genes with >50 counts in each of three independent replicates and a coefficient of variation for gene counts < 0.5. b, Volcano plot of genes significantly decreased by (R)-SKBG-1-treated sgControl cells relative to DMSO-treated sgControl cells (left) and of genes significantly decreased by DMSO-treated sgNONO cells relative to DMSO-treated sgControl cells (right). Significantly decreased was defined as log2 fold change ≤ −0.5, padj ≤ 0.01. log2 fold change values are mean values from three replicates. Plotted are proteincoding genes with at least 50 counts in at least three samples, and a coefficient of variation for gene counts < 0.5 among the three replicates. c, Volcano plot of mRNA log2 fold change in (R)-SKBG-1-treated sgControl cells / DMSO-treated sgControl cells. d, Volcano plot of mRNA log2 fold change in (S)-SKBG-1-treated sgControl cells / DMSO-treated sgControl cells. For ad, differential expression p values were adjusted with the Benjamini-Hochberg procedure for multiple comparisons. e, Scatter plot comparing mRNA log2 fold changes (x-axis) versus protein log2 fold changes (y-axis) in (R)-SKBG-1-treated sgControl / (R)-SKBG1-treated sgNONO 22Rv1 cells for proteins found by MS-based proteomics to be specifically decreased by (R)-SKBG-1 in a NONO-dependent manner (see Fig. 3d). Gene products inside the red dotted brackets show consistent mRNA and protein changes. f, g, Comparison of mRNA and protein content for AR (f) and SRSF4 (g) in the indicated treatment groups as measured by RNA-seq (4 h post-treatment with compounds) or MS-based proteomics (24 h post-treatment with compounds), respectively. Data are mean values ± s.e.m. for three (RNA-seq) or four (MS-based proteomics) independent replicates. p values from one-way ANOVA analysis are indicated above the bars.
Extended Data Fig. 5 |
Extended Data Fig. 5 |. (R)-SKBG-1 causes similar transcriptomic changes in human prostate and breast cancer cells.
a, Western blot showing NONO content of sgControl and sgNONO MCF7 cell populations generated by CRISPRCas9. sgControl 1 and sgNONO 1 or 3 cells were used for subsequent experiments. b, Quantification of NONO_C145 engagement by (R)-SKBG-1 versus (S)-SKBG-1 in MCF7 cells determined by MS-ABPP (indicated compound concentrations, 3 h). Data are mean values for two independent cell treatments analyzed in a single MS-ABPP experiment. See Supplementary Data 1 for complete proteomic data. c, Scatter plot of mRNA log2 fold changes for sgControl MCF7 cells treated with (R)-SKBG-1 or (S)-SKBG-1 (x-axis) versus mRNA log2fold changes for sgControl or sgNONO cells each treated with (R)-SKBG-1 (y-axis). Cells were treated with compounds (5 μM) for 4 h prior to RNA-seq analysis. Genes inside the red dotted brackets were designated as decreased (log2 fold change ≤ −0.5) or increased (log2 fold change ≥ 0.5) by (R)-SKBG-1 in a NONO-dependent manner. Data are mean values for protein-coding genes with at least 50 counts in each of two-three independent replicates. d, Scatter plot of mRNA log2fold changes in (R)-SKBG-1-treated sgControl / (R)-SKBG-1-treated sgNONO 22Rv1 cells (x-axis) versus (R)-SKBG-1-treated sgControl / (R)-SKBG-1-treated sgNONO MCF7 cells (y-axis). MCF7 and 22Rv1 cells were treated with 5 and 20 μM of compounds, respectively, for 4 h, to match the respective potency of NONO_C145 engagement by (R)-SKBG-1 in each cell line (see panel b and Extended Data Fig. 2b). Data are mean values for protein-coding genes with >50 counts in each of two-three independent replicates. e, f, Quantification of AR (e) and RXRA (f) mRNA from RNA-seq experiments performed in (R)-SKBG-1 or (S)-SKBG-1-treated sgControl or sgNONO 22Rv1 and MCF7 cells. Data are mean values ± s.e.m. for two-three independent replicates. TPM, transcripts per million reads. p values from oneway ANOVA analysis are indicated above the corresponding bars, with relative percent decreases in mRNA caused by (R)-SKBG-1 in sgControl cells shown in parentheses.
Extended Data Fig. 6 |
Extended Data Fig. 6 |. NONO ligand (R)-SKBG-1 impairs cancer cell growth in a stereoselective and NONO C145-dependent manner.
a, Effects of (R)-SKBG-1 and (S)-SKBG-1 on the growth of sgControl and sgNONO MCF7 cells. b, Effects of (R)-SKBG-1 and (S)-SKBG-1 on the growth of sgNONO 22Rv1 cells expressing WT-NONO or C145S-NONO. c, Effects of (R)-SKBG-1 and (S)-SKBG-1 on the growth of HeLa and HT1080 cells. Cells were treated with DMSO or (R)-SKBG-1 or (S)-SKBG-1. After 6 days (22Rv1), 5 days (MCF7) or 4 days (HeLa and HT1080), cell growth was determined by CellTiterGlo, normalized to cells treated with only DMSO. Data are mean values ± s.e.m. normalized to DMSO-treated control cells for four independent replicates. EC50 values are reported with 95% confidence intervals shown in brackets. d, sgControl and sgNONO 22Rv1 cells show similar growth rates. 10,000 cells were seeded overnight, and then cell growth was measured by CellTiterGlo, normalized to day 0 signal. Data are mean values ± s.e.m. for four independent replicates.
Extended Data Fig. 7 |
Extended Data Fig. 7 |. Crosstalk between NONO and DBHS paralogs PSPC1 and SFPQ in cells genetically or chemically disrupted for NONO.
a, Quantification of PSPC1 (left) and SFPQ (right) mRNA from RNA-seq experiments performed in (R)-SKBG-1 or (S)-SKBG-1-treated sgControl or sgNONO 22Rv1 and MCF7 cells. See Fig. 3a for more details on RNA-seq experiments. Data are mean values ± s.e.m. shown as % of the DMSO-treated sgControl groups for two-three independent replicates. p values from one-way ANOVA analysis are indicated above the bars. b, Quantification of PSPC1 (left) and SFPQ (right) protein from MS-based proteomic experiments performed in (R)-SKBG-1 or (S)-SKBG-1 -treated sgControl or sgNONO 22Rv1 and MCF7 cells. MCF7 and 22Rv1 cells were treated with 2.5 and 20 μM of compounds, respectively, for 24 h. Data are mean values ± s.e.m. for four independent replicates. p values from one-way ANOVA analysis are indicated above the bars. c, Dependency Map data showing that the three human cancer cell lines showing greatest dependency on NONO have predicted deleterious mutations in SFPQ or PSPC1. d, Western blot showing efficiency of disruption of PSPC1 and SFPQ expression in sgControl and sgNONO 22Rv1 cells following 72 h treatment with sgRNAs targeting PSPC1 or SFPQ using the Alt-R CRISPR-Cas9 nucleofection system. e, Number of transcripts that were strongly decreased (log2 fold change ≤ −0.75, padj ≤ 0.01) in the indicated sgRNA cell models relative to sgControl_sgControl cells. Red and blue bars correspond to transcripts decreased in sgControl_sgXXX (sgControl_ sgPSPC1, sgControl_sgSFPQ) and sgNONO_sgXXX (sgNONO_sgControl, sgNONO_sgPSPC1, sgNONO_sgSFPQ) cell models, respectively. f, Cell growth of indicated sgRNA cell models measured by seeding 10,000 cells overnight (72 h post-nucleofection) and following growth over a five-day additional time period as determined by CellTiterGlo, normalized to day 0 signal. Data are mean values ± s.e.m. for five independent replicates. g, Bar graph showing the percentage of overall transcripts or transcripts stereoselectively decreased by (R)-SKBG-1 (log2 fold change (R)-SKBG-1 / (S)-SKBG-1 ≤ −0.75, padj ≤ 0.01) that were also decreased in the indicated sgRNA cell models.
Extended Data Fig. 8 |
Extended Data Fig. 8 |. NONO ligands induce accumulation of NONO and the paralogous proteins PSPC1 and SFPQ into nuclear foci.
a, Immunofluorescence data showing time-dependent effects of active compound 5 and inactive control 8 (20 μM) on the localization of NONO in nuclear foci (yellow wedge) in 22Rv1 cells. NONO was imaged with primary antibody (Bethyl Laboratories, A300–587A) and an Alexa-488 secondary antibody. Scale bar: 20 μm. b, c, NONO foci induced by compounds 5 (b) and (R)-SKBG-1 (c) localize proximal to the nucleolar marker fibrillarin (20 μM compound treatment, 24 h). NONO was imaged with primary antibody (BD Biosciences, 611278) and an Alexa-488 secondary antibody. Fibrillarin was imaged with primary antibody (Cell Signaling, 2639 S) and an Alexa-647 secondary. Scale bar: 20 μm. d, e, Zoomed-in merged images of NONO (green) and fibrillarin (red) localization from compounds 5 (d) or (R)-SKBG-1 (e) treated 22Rv1 cells (24 h time point). DAPI stain, blue. Scale bar: 10 μm. f, g, Immunofluorescence data showing effects of active compounds 5 (f) and (R)-SKBG-1 (g) and inactive controls 8 and (S)-SKBG-1 on the localization of SFPQ in nuclear foci (yellow wedge) in 22Rv1 cells (20 μM of each compound, 24 h). NONO was imaged with primary antibody (Bethyl Laboratories, A300–587A) and an Alexa-488 secondary antibody. SFPQ was imaged with primary antibody (Sigma-Aldrich, WH0006421M2) and an Alexa-647 secondary. Scale bar: 20 μm. h, Immunofluorescence data showing effects of active compounds 5 and (R)-SKBG-1 and inactive controls 8 and (S)-SKBG-1 on the localization of PSPC1 in nuclear foci (yellow wedge) in 22Rv1 cells (20 μM of each compound, 24 h). NONO was imaged with primary antibody (Bethyl Laboratories, A300–587A) and an Alexa-488 secondary antibody. PSPC1 was imaged with primary antibody (SigmaAldrich, SAB4200503) and an Alexa-647 secondary. Scale bar: 20 μm.
Extended Data Fig. 9 |
Extended Data Fig. 9 |. Effects of NONO ligands on NONO-protein and NONO-mRNA interactions.
a, Quantification of PSPC1 and SFPQ from anti-FLAG immunoprecipitation-MS experiments of FLAG-NONO-expressing cells treated with (R)-SKBG-1 or (S)-SKBG-1 (20 μM, 4 h). Data are mean values ± s.e.m.for four independent replicates. b, (R)-SKBG-1 effects on the abundance of transcripts previously shown in eCLIP experiments to bind NONO or NONO-associated RBPs (SFPQ, MATR3) versus transcripts bound to any RBP or not bound to RBPs,. Transcript abundances determined by RNA-seq of 22Rv1 cells treated with (R)-SKBG-1 or (S)-SKBG-1 (20 μM, 4 h). Transcripts stereoselectively decreased or increased by (R)-SKBG-1 determined as described in Fig. 3a. A bound transcript was defined as having ≥ 1 eCLIP IDR peak for a given RBP. c, Volcano plot comparing enrichment of mRNAs stereoselectively decreased by (R)-SKBG-1 in 22Rv1 cells among NONO and SFPQ-bound transcripts (in black) to 30 sets of randomly selected transcripts of matched number and expression levels (in red). Enrichment odds ratio and FDR values were determined as in Fig. 5c. d, Motifs enriched in NONO eCLIP-seq peaks from cells treated with (R)-SKBG-1 or (S)-SKBG-1 (20 μM, 4 h) or DMSO. e, Scatter plot showing repetitive element distribution between (R)-SKBG-1 and (S)-SKBG-1-treated eCLIP-seq. f, eCLIP-seq relative information content determined for transcripts bound to NONO in 22Rv1 cells treated with (R)-SKBG-1 or (S)-SKBG-1 (20 μM, 4 h) that were stereoselectively decreased or not decreased by (R)-SKBG-1. g, h, eCLIP-seq reads for total mRNA for AR (g) or TAF4 (h) in 22Rv1 cells treated with (R)-SKBG-1 or (S)-SKBG-1 (20 μM, 4 h). TAF4 is a representative mRNA that was bound to NONO but not altered in abundance by (R)-SKBG-1. For fh, relative information content was determined as described in Fig. 5e. i, Percent of transcripts from the indicated categories bound to NONO in 22Rv1 cells treated with (R)-SKBG-1 or (S)-SKBG-1 (20 μM, 4 h) or DMSO. d-i, results are from a single eCLIP-seq experiment representative of two independent replicates.
Extended Data Fig. 10 |
Extended Data Fig. 10 |. Effects of NONO ligands on mRNA splicing.
a, b, 5’ splice site sequence upstream (a) and 3’ splice site sequence downstream (b) of cassette exons in different contexts. Included, excluded or no change refers to the effect on cassette exons upon (R)-SKBG-1 treatment compared to (S)-SKBG-1 treatment in sgControl or sgNONO cells. c, Splice site strength of the splice sites surrounding the alternatively-spliced exons was determined using MaxEntScore. No difference was observed comparing the included/excluded group to the no change group. d, Motif enrichment comparing inclusion/exclusion events following (R)-SKBG-1 treatment to cassette exons with no change, spread across surrounding regions. Intronic sequences are defined as 500 b.p. surrounding the splice site e, Normalized eCLIP density around alternatively spliced exons for transcripts bound to NONO in 22Rv1 cells under the three indicated treatment conditions (DMSO or (R)-SKBG-1 or (S)-SKBG-1 (20 μM, 4 h treatment)), and control exons with various inclusion levels (ψ). f, Overlapping ENCODE HepG2 eCLIP IDR peaks with regions near cassette exons included after (R)-SKBG-1 treatment. Coloring shows the log2 (odds ratio) comparing included exons to regions with no change.
Fig. 1 |
Fig. 1 |. Discovery of electrophilic compounds that deplete AR mRNA and protein in prostate cancer cells.
a, Screening workflow to discover compounds that deplete AR-FL and AR-V7 mRNA and protein content in 22Rv1 prostate cancer cells; LBD, ligand-binding domain. The light red bar in AR-V7 marks the alternative exon 3b. b,c, Screening results showing the effects of electrophilic compounds (20 μM) on the expression of AR-FL and AR-V7 mRNA (b; 20 μM compound for 6 h) and protein (c; 10 μM compound for 24 h). Hit compounds that reduced AR-FL and AR-V7 mRNA and protein by ≥30% and ≥50%, respectively, are highlighted in red. Full screens were performed once. See Supplementary Table 3 for structures of other compounds shown in red in b and c. d, Hit compound B21 (1). e, Time course of depletion of AR-FL and AR-V7 mRNA and total AR protein in 22Rv1 cells treated with B21 (25 μM). Data are shown as mean values for two replicates (mRNA) or mean values ± s.e.m. for four replicates (protein) of a single experiment representative of two independent experiments. f, Concentration-dependent effects of B21 and structural analogs (active, 25; inactive, 69; see Table 1 and Supplementary Table 4 for compound structures) on AR-FL and AR-V7 mRNA expression in 22Rv1 cells. g, Concentration-dependent effects of active (R)-SKBG-1 and inactive (S)-SKBG-1 enantiomers on AR-FL and AR-V7 mRNA expression in 22Rv1 cells. For f and g, compound treatments were for 6 h, and data are shown as mean values for two replicates (f) or mean values ± s.e.m. for four replicates (g) of a single experiment representative of two independent experiments. h, Structures of (R)-SKBG-1 and (S)-SKBG-1. i, Western blots showing AR-FL and AR-V7 protein content in 22Rv1 cells treated with active compounds (5 and (R)-SKBG-1), inactive compounds (9 and (S)-SKBG-1) or DMSO for 24 h. j, Quantification of western blotting data described in i. Data are shown as mean values ± s.e.m. for four independent experiments. P values calculated by one-way ANOVA are indicated above the bars.
Fig. 2 |
Fig. 2 |. Active compounds suppress AR expression by targeting the RBP NONO.
a, Heat map showing cysteines that were substantially (>50%) engaged by all active compounds (25, (R)-10 and (R)-SKBG-1; 20 μM, 1 h) in 22Rv1 cells as determined by MS-ABPP. Colors in the heat map represent the extent of cysteine engagement in DMSO-treated versus compound-treated cells. Data represent mean values from three independent experiments. See Supplementary Data 1 for full proteomic data. b, Sequence alignment of human and mouse DBHS proteins NONO, PSPC1 and SFPQ for the region around NONO C145 (yellow). The RNA-binding domains RRM1 and RRM2 of human NONO are colored in blue and magenta, respectively. c, Crystal structure of the NONO (cyan)–PSPC1 (green) dimer (Protein Data Bank ID: 3SDE) showing the location of NONO C145 (yellow) in a hinge between the RRM1 (blue) and RRM2 (magenta) domains; red, residues shown to be important for RNA binding. d, Concentration-dependent effects of active (R)-SKBG-1 and inactive control (S)-SKBG-1 on AR-FL (left) and AR-V7 (right) mRNA content of sgControl and sgNONO cells (6 h of compound treatment). Data are shown as mean values for two replicates of a single experiment representative of two independent experiments. e, Western blots showing AR-FL and AR-V7 protein content in sgControl (NONO+) or sgNONO (NONO) cells treated with (R)-SKBG-1 or (S)-SKBG-1 (20 μM, 24 h). Also shown are western blotting signals for NONO and PSPC1. f, Western blots showing signals for endogenous NONO in sgControl (NONO+) 22Rv1 cells and recombinantly expressed FLAG–NONO (WT or C145S) in sgNONO (NONO) 22Rv1 cells. The FLAG–NONO-expressing sgNONO cells were generated by first stably introducing FLAG–NONO with a silent PAM site mutation and then genetically disrupting endogenous NONO by CRISPR–Cas9. g, Concentration-dependent effects of (R)-SKBG-1 and (S)-SKBG-1 on AR-FL (left) and AR-V7 (right) mRNA content of sgNONO cells expressing NONOWT or NONOC145S. AR mRNAs were quantified by QuantiGene assays at 6 h after compound treatment, and expression was normalized to DMSO-treated NONOWT cells. Data are shown as mean values of two replicates of a single experiment representative of two independent experiments.
Fig. 3 |
Fig. 3 |. Global effects of NONO ligands on the transcriptomes and proteomes of cancer cells.
a, Scatter plot of mRNA log2 (fold change) values for sgControl 22Rv1 cells treated with (R)-SKBG-1 or (S)-SKBG-1 (x axis) versus mRNA log2 (fold change) values for sgControl or sgNONO cells each treated with (R)-SKBG-1 (y axis). Cells were treated with compounds at a concentration of 20 μM for 4 h. Red dotted brackets designate genes decreased (log2 (fold change) ≤ –0.5) or increased (log2 (fold change) ≥ 0.5) in expression by (R)-SKBG-1 in a NONO-dependent manner. Data are shown as mean values for protein-coding genes with >50 counts in each of three independent replicates. b, Heat map showing transcripts that were substantially and significantly changed (log2 (fold change) ≤ −0.5 or log2 (fold change) ≥ 0.5, Padj ≤ 0.01) by (R)-SKBG-1/(S)-SKBG-1 in sgControl cells or DMSO-treated sgNONO/sgControl cells. c, PCA plot of RNA-seq data for the indicated groups, revealing that sgControl 22Rv1 cells treated with (R)-SKBG-1 are substantially separated from the other three compound-treated groups ((R)-SKBG-1-treated sgNONO cells and (S)-SKBG-1-treated sgControl and sgNONO cells). d, Scatter plot showing proteins that were specifically decreased in expression by (R)-SKBG-1 in a NONO-dependent manner. Cells were treated with compounds at a concentration of 20 μM for 24 h. The following are the displayed plotted proteins: (1) ≥30% decrease in (R)-SKBG-1-treated sgControl cells relative to DMSO control, (2) a log2 (fold change) for (R)-SKBG-1/(S)-SKBG-1 in sgControl cells of ≤−0.5 and (3) a log2 (fold change) for (R)-SKBG-1 in sgControl cells/(R)-SKBG-1 in sgNONO cells of ≤−0.5. Data are shown as average values from two independent experiments each containing two replicates. e, GSEA showing the ten most significantly downregulated pathways in (R)-SKBG-1-treated sgControl 22Rv1 cells compared to (R)-SKBG-1-treated sgNONO cells. f, Effects of (R)-SKBG-1 and (S)-SKBG-1 on the growth of sgControl and sgNONO cells. Cells were treated with the indicated concentrations of compounds for 6 d, and cell growth was determined by CellTiterGlo. Data are shown as mean values ± s.e.m. normalized to DMSO-treated control cells for four independent replicates. EC50 values are reported with 95% confidence intervals shown in parentheses.
Fig. 4 |
Fig. 4 |. Ectopic NONOC145S attenuates the activity of (R)-SKBG-1 in cancer cells coexpressing endogenous NONOWT.
a, Western blot showing coexpression of endogenous NONO (lower-molecular-weight band) and exogenous FLAG-tagged NONOWT or NONOC145S (higher-molecular-weight band). b, Concentration-dependent effects of (R)-SKBG-1 on AR-FL (left) and AR-V7 (right) mRNA content of 22Rv1 cells coexpressing exogenous NONOWT or NONOC145S. Data for sgControl, sgNONO and empty vector control cells are shown for comparison. AR mRNAs were quantified by QuantiGene assays at 6 h after compound treatment, and expression was normalized relative to DMSO treatment for each experimental group. Data are shown as mean values for two replicates of a single experiment representative of two independent experiments. c, Number of genes that were substantially and significantly decreased by (R)-SKBG-1/(S)-SKBG-1 (log2 (fold change) ≤ −0.75, Padj ≤ 0.01) in 22Rv1 cells coexpressing exogenous NONOWT or NONOC145S compared to empty vector control cells. d, Effects of (R)-SKBG-1 and (S)-SKBG-1 on the growth of 22Rv1 cells coexpressing exogenous NONOWT or NONOC145S compared to empty vector control cells. Cells were treated with the indicated concentrations of compounds or DMSO, and, after 6 d, cell growth was determined by CellTiterGlo. Data are shown as mean values ± s.e.m. normalized to DMSO-treated control cells for two independent experiments with four replicates per experiment. EC50 values are reported with 95% confidence intervals shown in parentheses. e, PCA plot of RNA-seq data for the indicated cell models, revealing that (R)-SKBG-1 effects in 22Rv1 cells coexpressing exogenous NONOC145S shift to resemble the effects of the inactive enantiomer (S)-SKBG-1. f, Pie chart showing the effects of coexpression of exogenous NONOC145S and endogenous NONOWT in 22Rv1 cells on genes stereoselectively regulated by (R)-SKBG-1 in empty vector 22Rv1 cells (genes with (R)-SKBG-1/(S)-SKBG-1 log2 (fold change) ≤ −0.75, Padj ≤ 0.01). Rescue refers to genes for which NONOC145S coexpression substantially nullified the effects of (R)-SKBG-1. g, Bar graphs for representative (R)-SKBG-1-regulated genes that were unaffected by coexpression of NONOC145S. Data are shown as mean values ± s.e.m. for three independent replicates; TPM, transcript per million.
Fig. 5 |
Fig. 5 |. Effects of (R)-SKBG-1 on NONO localization and RNA interactions.
a, Time-dependent effects of (R)-SKBG-1 and (S)-SKBG-1 (20 μM) on the localization of NONO in nuclear foci (yellow wedges) in 22Rv1 cells. NONO was imaged with a primary antibody (Bethyl Laboratories) and an Alexa 488 secondary antibody; scale bar, 20 μm. b, Quantification of NONO nuclear foci induced by (R)-SKBG-1 and (S)-SKBG-1. The percentage of cells with NONO foci was determined manually in a blinded manner. Data are shown as mean values ± s.e.m. for five representative images from two independent experiments where 17–124 cells (median: 58 cells) were analyzed per image. c, Volcano plot comparing enrichment of mRNAs stereoselectively decreased by (R)-SKBG-1 in 22Rv1 cells (as described in Fig. 3a) among the RNAs interacting with 104 RBPs in previous eCLIP experiments performed in HepG2 cells,. A bound transcript was defined as ≥1 eCLIP IDR peak for a given RBP. d,e, eCLIP–seq significant peak quantity and regional distribution (d) and relative information content (e) determined for transcripts bound to NONO in 22Rv1 cells treated with (R)-SKBG-1 and (S)-SKBG-1 (20 μM, 4 h). Relative information defined as pi×log2(piqi), where pi and qi are the fractions of total reads of a given transcript in the NONO immunoprecipitation and SM-Input, respectively, that map to element i. Results are from a single experiment representative of two independent experiments; UTR, untranslated region; CDS, coding sequence; miRNA, microRNA; SS, splice site. f, Effects of (R)-SKBG-1 and (S)-SKBG-1 (20 μM, 4 h) on alternative splicing events in sgControl and sgNONO 22Rv1 cells, as determined by RNA-seq. Bars indicate whether the alternative splicing event was included or excluded, respectively, by the indicated first condition compared to the second condition listed on the y axis. Significant alternative splicing events had an FDR of <0.1 and an | InclusionLevelDifference | of >0.05 (n = 3); SE, skipped exons; MXE, mutually exclusive exons; A5SS, alternative 5′ splice site; A3SS, alternative 3′ splice site; RI, retained intron. g, Trapping model for how covalent ligands targeting NONO C145 affect mRNA processing in cancer cells and subvert the compensatory action of paralogous proteins PSPC1 and SFPQ.

References

    1. Bentley DL Coupling mRNA processing with transcription in time and space. Nat. Rev. Genet 15, 163–175 (2014). - PMC - PubMed
    1. Gerstberger S, Hafner M.& Tuschl T.A census of human RNA-binding proteins. Nat. Rev. Genet 15, 829–845 (2014). - PMC - PubMed
    1. Gebauer F, Schwarzl T, Valcárcel J.& Hentze MW RNA-binding proteins in human genetic disease. Nat. Rev. Genet 22, 185–198 (2021). - PubMed
    1. Pereira B, Billaud M.& Almeida R.RNA-binding proteins in cancer: old players and new actors. Trends Cancer 3, 506–528 (2017). - PubMed
    1. Julio AR & Backus KM New approaches to target RNA binding proteins. Curr. Opin. Chem. Biol 62, 13–23 (2021). - PMC - PubMed

Publication types