Randomized Controlled Trial
. 2023 Mar;29(3):605-614.
doi: 10.1038/s41591-023-02240-8. Epub 2023 Mar 2.

Codon-specific KRAS mutations predict survival benefit of trifluridine/tipiracil in metastatic colorectal cancer

Affiliations
Randomized Controlled Trial

Codon-specific KRAS mutations predict survival benefit of trifluridine/tipiracil in metastatic colorectal cancer

Joris van de Haar et al. Nat Med. 2023 Mar.

Abstract

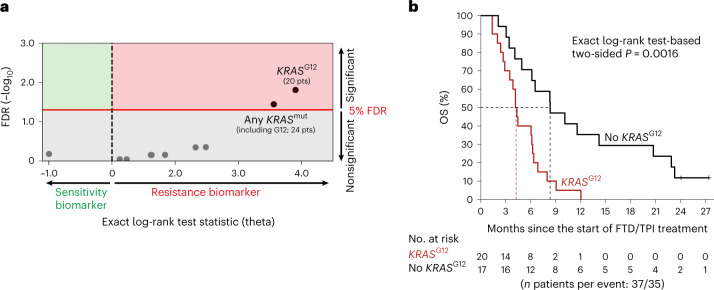
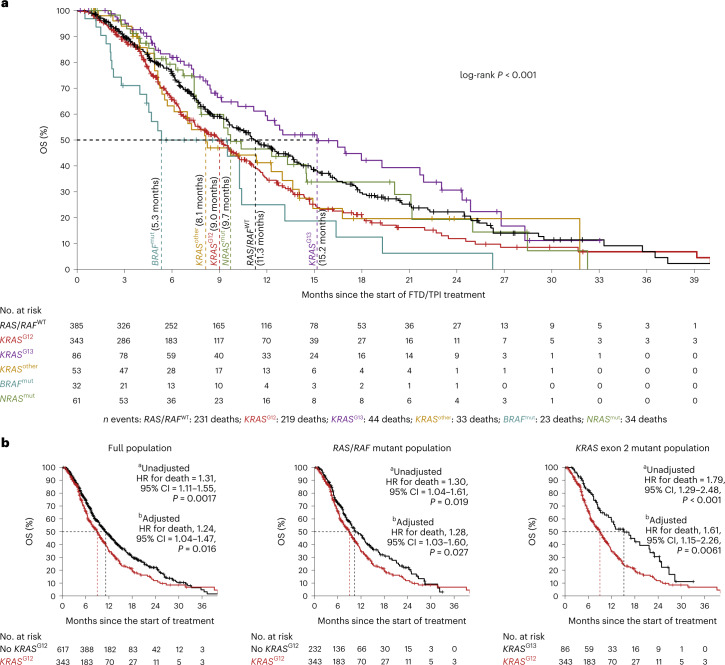
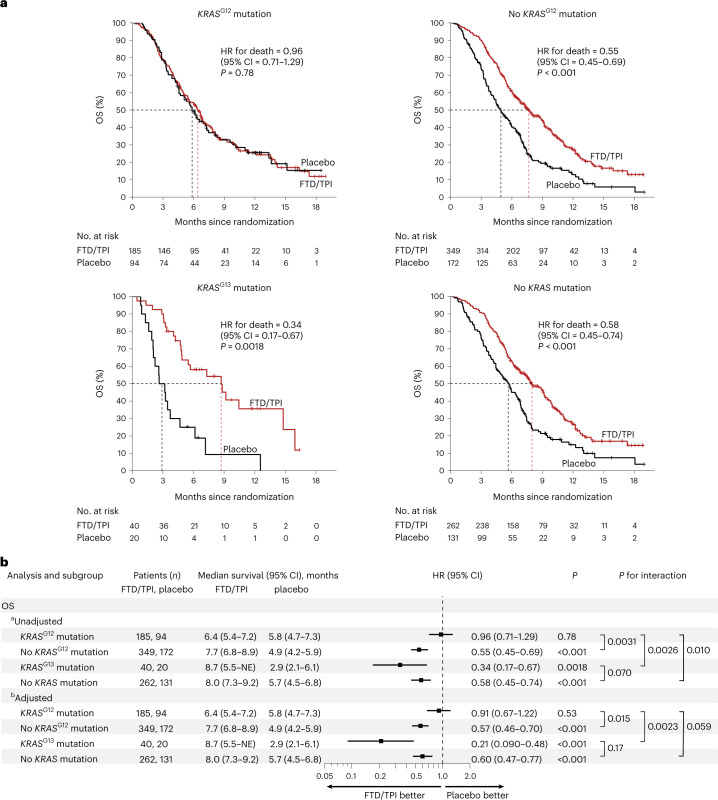
Genomics has greatly improved how patients with cancer are being treated; however, clinical-grade genomic biomarkers for chemotherapies are currently lacking. Using whole-genome analysis of 37 patients with metastatic colorectal cancer (mCRC) treated with the chemotherapy trifluridine/tipiracil (FTD/TPI), we identified KRAS codon G12 (KRASG12) mutations as a potential biomarker of resistance. Next, we collected real-world data of 960 patients with mCRC receiving FTD/TPI and validated that KRASG12 mutations were significantly associated with poor survival, also in analyses restricted to the RAS/RAF mutant subgroup. We next analyzed the data of the global, double-blind, placebo-controlled, phase 3 RECOURSE trial (n = 800 patients) and found that KRASG12 mutations (n = 279) were predictive biomarkers for reduced overall survival (OS) benefit of FTD/TPI versus placebo (unadjusted interaction P = 0.0031, adjusted interaction P = 0.015). For patients with KRASG12 mutations in the RECOURSE trial, OS was not prolonged with FTD/TPI versus placebo (n = 279; hazard ratio (HR) = 0.97; 95% confidence interval (CI) = 0.73-1.20; P = 0.85). In contrast, patients with KRASG13 mutant tumors showed significantly improved OS with FTD/TPI versus placebo (n = 60; HR = 0.29; 95% CI = 0.15-0.55; P < 0.001). In isogenic cell lines and patient-derived organoids, KRASG12 mutations were associated with increased resistance to FTD-based genotoxicity. In conclusion, these data show that KRASG12 mutations are biomarkers for reduced OS benefit of FTD/TPI treatment, with potential implications for approximately 28% of patients with mCRC under consideration for treatment with FTD/TPI. Furthermore, our data suggest that genomics-based precision medicine may be possible for a subset of chemotherapies.


Conflict of interest statement

E.E.V. reports research grants from Roche, Pfizer, GSK, Novartis, Merck, Bristol Myers Squibb, AstraZeneca, Amgen, Bayer, Sanofi, Seagen, Janssen, Eisai, Ipsen and Lilly. He is a founder, strategic advisor and shareholder of MOSAIC Therapeutics and nonexecutive, independent director and shareholder of Sanofi, all outside the submitted work. L.F.A.W. reports grants from Genmab, outside the submitted work. A.C. received grant consultancy fees from MSD, AstraZeneca, Oncoc4 and IQVIA. He also declares speaker’s fees from Eisai and AstraZeneca. A.P. received personal fees from Lilly, Servier, Merck, Amgen, Bristol Myers Squibb and MSD. A.T. declares speaker bureau fees from Bristol Myers Squibb and Servier. C.S. received honoraria from the speaker bureau at Servier. D.J.P. received lecture fees from ViiV Healthcare, Bayer Healthcare, Bristol Myers Squibb, Roche, Eisai and the Falk Foundation, travel expenses from Bristol Myers Squibb and Bayer Healthcare, consulting fees for Mina Therapeutics, H3B, Eisai, Roche, DaVolterra, Mursla, Exact Sciences, Avamune and AstraZeneca and research funding (to institution) from MSD, Bristol Myers Squibb and GSK. F.G. received honoraria for speaker/advisory roles from Servier, Lilly, IQVIA, Merck Serono, Bayer, Amgen and Bristol Myers Squibb outside the present work. F.M. received fees from the speaker bureaux of Servier, Amgen, Novartis, MSD and Merck. G.T. took part in the advisory boards for Bristol Myers Squibb, AstraZeneca, MSD, Merck and Servier. J.G. received honoraria for educational events organized by Servier. L.S. received speaker and consultancy fees from MSD, AstraZeneca, Servier, Bayer, Merck, Amgen and Pierre-Fabre. M.G.R. received consultancy fees from Roche. M.G. received grants and advisory board fees from Merck, Servier, Lilly, Amgen and Italfarmaco. N.L.V. received fees and honoraria from Eisai, MSD, Roche, Novartis, AstraZeneca, GSK, Pfizer, Gentili and Lilly. N.V. received honoraria from Merck Serono, Pfizer, Bayer, Lilly and Servier, consultancy fees from BenevolentAI and grants (institutional) from Roche and BenevolentAI. N.Z. declares personal fees from Bayer and Eisai. O.G. reports consulting fees from Eisai, Lilly, MSD and Seagen and payment or honoraria for lectures, presentations, speaker bureaux fees, manuscript writing or educational events from Novartis, Lilly and Eisai. P.R. received grants from Bayer and Sanofi, honoraria for advisory boards from AstraZeneca, Eisai, Servier and Sirtex, speaking fees from Amgen, Boston Scientific, HMP Education, Eisai, Roche and Servier and travel conference support from Bayer, Roche, Ipsen and Servier. R.G. took part in advisory boards for Merck, Amgen, Servier and Bayer. R.B. declares consultancies, advisory board roles and/or institutional donations from AstraZeneca, Boehringer Ingelheim, Novartis, MSD, Otsuka, Lully, Roche, Amgen, GSK and Eisai. T.I. received honoraria for educational symposia run by Servier. All other authors declare no competing interests.

Figures

Fig. 1
Fig. 1. Discovery of KRASG12 mutation status as potential biomarker of outcome of FTD/TPI treatment in mCRC.
a, Dot plot showing the associations of candidate genomic biomarkers to OS on FTD/TPI treatment in the discovery cohort (n = 37 patients). The exact log-rank test statistic (theta) for the death of patients with the candidate biomarker versus those without is plotted against the Benjamini–Hochberg-corrected FDR. The red line indicates the 5% FDR significance threshold. b, A Kaplan–Meier curve of OS in the discovery cohort for patients without (black) or with (red) a KRASG12 mutation. Censoring events are indicated by vertical bars on the corresponding curve. The dotted lines indicate the median OS. The table underneath the plot denotes the numbers at risk. The exact log-rank test-based two-sided P is shown. FDR, false discovery rate; OS, overall survival.
Fig. 2
Fig. 2. Associations of RAS/RAF mutations with the OS of 960 patients with mCRC receiving FTD/TPI treatment in a real-world setting.
a, Kaplan–Meier curve of OS in the full population, stratified according to RAS/RAF mutations, as indicated by the colors (see the table underneath the plot for the color coding used for each RAS/RAF mutation category). Censoring events are indicated by vertical bars on the corresponding curve. The dotted lines and corresponding annotation indicate the subgroup-specific median OS. The table underneath the plot denotes the numbers at risk. The two-sided log-rank test-based P value is shown. b, Kaplan–Meier curves of OS in the full population (left), RAS/RAF mutant population (middle) and KRASexon_2_mut population (right), stratified according to the presence (red) or absence (black) of a KRASG12 mutation. Censoring events are indicated by vertical bars on the corresponding curve. The dotted lines indicate the subgroup-specific median OS. The table underneath each plot denotes the numbers at risk. Two-sided Wald test-based P values are shown. aUnadjusted by univariate Cox regression. bAdjusted by stratified, multivariate Cox regression, adjusted for eight baseline characteristics (Methods). Note that all Cox regression models passed the proportional-hazards assumption. OS, overall survival.
Fig. 3
Fig. 3. KRAS mutations and OS benefit of FTD/TPI versus placebo in the RECOURSE trial.
a, Kaplan–Meier curves of OS with FTD/TPI (red) or placebo (black) for patients with KRASG12 mutations (upper left panel), without KRASG12 mutations (upper right panel), with KRASG13 mutations (lower left panel) and without KRAS mutations (lower right panel). Censoring events are indicated by vertical bars on the corresponding curve. The dotted lines indicate the median OS. The table underneath each plot denotes the numbers at risk. Two-sided Wald test-based P values are shown. b, Forest plot of HRs for death and 95% CIs for patients treated with FTD/TPI versus placebo, subgrouped according to codon-specific KRAS mutation status. Two-sided Wald test-based P values for interaction (as calculated using Cox regression) indicate if the OS benefit of FTD/TPI treatment versus placebo was significantly different between subgroups, for which pairwise comparisons are indicated by the square brackets. aUnadjusted: stratified for two stratification factors of the trial (time from diagnosis of metastases (<18 versus ≥18 months) and region (Japan versus USA, Europe and Australia)). bAdjusted: adjusted by the two stratification factors used in unadjusted analysis plus eight additional baseline characteristics (Methods). Note that all Cox regression models passed the proportional-hazards assumption. NE, not estimated; OS, overall survival.
Fig. 4
Fig. 4. KRASG12 mutations and in vitro resistance to FTD in isogenic cell lines and PDOs of mCRC.
a, Colony formation assay for KRASWT and KRASG12V SW48 colorectal cancer cell lines after 2 weeks’ exposure to a concentration range of FTD in vitro. b, As in a, but for KRASWT and KRASG12D isogenic Colo320 CRC cell lines. c, Dose–response curves of KRASWT (black) and KRASG12 (red) isogenic SW48 (dots) or Colo320 (diamonds) CRC cell lines exposed to a concentration range of FTD in vitro. The dots and error bars represent the mean and s.d. among four biological replicates at the tested concentrations, respectively. d, Half-maximal inhibitory concentrations (IC50; log2) for FTD of KRASWT and KRASG12 isogenic SW48 or Colo320 CRC cell lines, as indicated on the x axis. Data are plotted for four biological replicates. The box center lines, box ranges, whiskers and dots indicate the medians, quartiles, 1.5 times the IQR and data points of individual experiments (biological replicates; n = 4 for each line), respectively. The two-sided Wilcoxon rank-sum test-based P value is shown. e, Dose–response curves of mCRC PDOs harboring WT KRAS (black; n = 3) or different KRASG12 mutations (red; n = 4) exposed to FTD in vitro. The dots and error bars represent the mean and s.d. at the tested concentrations, respectively. f, IC50 (log2) for FTD of KRASWT (black; n = 3) and KRASG12 (red; n = 4) mCRC PDOs. The box center lines, box ranges, whiskers and dots indicate the medians, quartiles, 1.5 times the IQR and data points of individual organoid lines (see legend), respectively. The two-sided Wilcoxon rank-sum test-based P value is shown. g, Representative western blot of the DNA damage marker γH2AX on treatment of KRASWT (black) and KRASG12 (red) SW48 (left) and Colo320 (right) cells with FTD at increasing concentrations. Hsp90 was used as a loading control. Data were confirmed in three and two biological replicates for SW48 and Colo320, respectively. h, As in g, but for mCRC PDOs harboring KRASWT (black, left) or different KRASG12 mutations (red, right). The left and right panels were exposed together (Source Data 1). Data were confirmed in three biological replicates. i, As in c but for 5-FU. j, As in d but for 5-FU. k, As in e but for 5-FU. l, As in f but for 5-FU. Source data
Extended Data Fig. 1
Extended Data Fig. 1. Codon-specific KRAS mutation frequencies in mCRC (MSKCC cohort).
WT: wild type; DM: double mutation.
Extended Data Fig. 2
Overview of the study and the cohorts used in the analyses.
Extended Data Fig. 3
Extended Data Fig. 3. Discovery of KRASG12 mutation status as potential biomarker of outcome of FTD/TPI treatment in mCRC.
a dot plot showing the associations of candidate genomic biomarkers to time on FTD/TPI treatment in the discovery cohort (n = 37). The exact log-rank test statistic (theta) for treatment discontinuation for patients with the candidate biomarker versus those without is plotted against the Benjamini-Hochberg-corrected false discovery rate (FDR). The red line indicates the 5% FDR significance threshold. b A Kaplan-Meier curve of time on treatment in the discovery cohort, for patients without (black) or with (red) a KRASG12 mutation. Censoring events are indicated by vertical bars on the corresponding curve. Dotted lines indicate the median overall survival. The table underneath the plot denotes the numbers at risk. The exact log-rank test-based two-sided P value is shown.
Extended Data Fig. 4
Extended Data Fig. 4. Associations of KRASG12 mutations with progression-free survival of 960 patients with mCRC receiving FTD/TPI treatment in a real-world setting.
Kaplan-Meier curves of progression-free survival in the full population (left), RAS/RAF mutant population (middle), and KRAS exon 2 mutant population (right), stratified based on the presence (red) or absence (black) of a KRASG12 mutation. Censoring events are indicated by vertical bars on the corresponding curve. Dotted lines indicate the median overall survival. The table underneath each plot denotes the numbers at risk. Two-sided Wald test-based P values are shown. *Unadjusted: By univariate Cox regression. **Adjusted: By stratified, multivariate Cox regression, adjusted for eight baseline characteristics (see methods). Note that none of the Cox regression models significantly violated the proportional hazards assumption, despite crossing survival curves.
Extended Data Fig. 5
Extended Data Fig. 5. Kaplan-Meier curves of overall survival of KRASG12-mutated, KRASG13-mutated and KRASWT patients in the placebo arm of the RECOURSE trial.
Censoring events are indicated by vertical bars on the corresponding curve. Dotted lines and corresponding annotation indicate the median overall survival. The table underneath the plot denotes the numbers at risk. Cox regression-based hazard ratio (HR), 95% confidence interval (CI) and two-sided Wald test-based P values are plotted for pairwise comparisons.
Extended Data Fig. 6
Extended Data Fig. 6. Forest plot of hazard ratios and 95% CI for overall survival with FTD/TPI versus placebo, for the KRASG12-mutated population in amino acid change-based subgroups.
The five most frequent KRASG12 amino acid changes are shown as individual subgroups. KRASG12Other comprises all patients with KRASG12 mutations that induce amino acid changes other than these five most frequent changes. We excluded 21 patients with KRASG12 mutations for which data on the amino acid change was missing. Two-sided Wald test-based P values for interaction (as calculated using Cox regression) indicate if the survival benefit of FTD/TPI treatment versus placebo was significantly different for a specific subgroup, as compared to all patients with other KRASG12 mutations.
Extended Data Fig. 7
Extended Data Fig. 7. Progression-free survival in codon-specific KRAS mutation-based subgroups in the RECOURSE trial.
Forest plot of hazard ratios for progression or death and 95% CI, stratified based on codon-specific KRAS mutation status. Two-sided Wald test-based P values for interaction (as calculated using Cox regression) indicate if the survival benefit of FTD/TPI treatment versus placebo was significantly different between subgroups, for which pairwise comparisons are indicated by the square brackets. *Unadjusted: stratified for two stratification factors of the trial (time from diagnosis of metastases [<18 mo versus ≥18 mo] and region [Japan versus United States, Europe, and Australia]). **Adjusted: adjusted by the two stratification factors used in unadjusted analysis, plus eight additional baseline characteristics (see methods). NE: not estimable.
Extended Data Fig. 8
Extended Data Fig. 8. Growth rate of patient-derived mCRC organoids versus KRAS-based subgroup or in vitro trifluridine sensitivity.
a The (log2) in vitro growth rate of patient-derived mCRC organoids in the untreated condition is plotted as stratified per KRAS mutation-based subgroup. Box center lines, box ranges, whiskers, and dots indicate medians, quartiles, 1.5 interquartile ranges, and data points of individual organoid lines, respectively. Colors of dots denote the organoid line, as shown in the legend. Two-sided two sample t-test-based P value is shown. b Half maximal inhibitory concentrations (IC50; log2) for trifluridine of KRASWT (black; n = 3) and KRASG12 (red; n = 4) organoid lines (x-axis), is plotted against the (log2) in vitro growth rate of patient-derived mCRC organoids in the untreated condition (y-axis). The linear fit and bootstrapping-obtained 95% confidence interval of the regression estimate is denoted in dark and light blue, respectively. Pearson and Spearman correlation coefficients and corresponding P values are shown.

Comment in

References

    1. Van Cutsem E, et al. ESMO consensus guidelines for the management of patients with metastatic colorectal cancer. Ann. Oncol. 2016;27:1386–1422. doi: 10.1093/annonc/mdw235. - DOI - PubMed
    1. Marcus L, et al. FDA approval summary: TAS-102. Clin. Cancer Res. 2017;23:2924–2927. doi: 10.1158/1078-0432.CCR-16-2157. - DOI - PubMed
    1. Mayer RJ, et al. Randomized trial of TAS-102 for refractory metastatic colorectal cancer. N. Engl. J. Med. 2015;372:1909–1919. doi: 10.1056/NEJMoa1414325. - DOI - PubMed
    1. Van Cutsem E, et al. The subgroups of the phase III RECOURSE trial of trifluridine/tipiracil (TAS-102) versus placebo with best supportive care in patients with metastatic colorectal cancer. Eur. J. Cancer. 2018;90:63–72. doi: 10.1016/j.ejca.2017.10.009. - DOI - PMC - PubMed
    1. Hurwitz H, et al. Bevacizumab plus irinotecan, fluorouracil, and leucovorin for metastatic colorectal cancer. N. Engl. J. Med. 2004;350:2335–2342. doi: 10.1056/NEJMoa032691. - DOI - PubMed

Publication types

MeSH terms