. 2023 Mar 2;24(1):97.
doi: 10.1186/s12864-023-09197-5.

Analysis of structural variation among inbred mouse strains

Affiliations

Analysis of structural variation among inbred mouse strains

Ahmed Arslan et al. BMC Genomics. .

Abstract

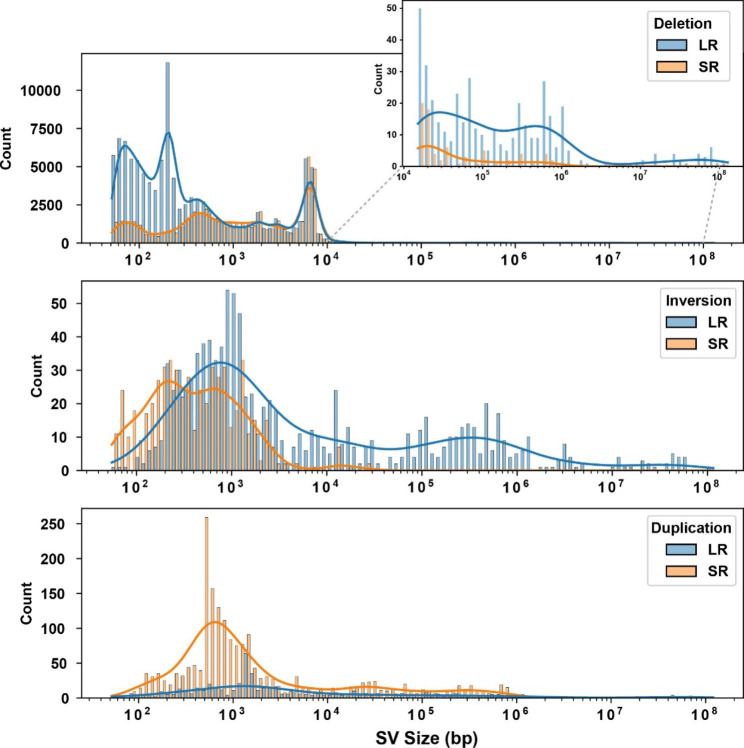
Background: 'Long read' sequencing methods have been used to identify previously uncharacterized structural variants that cause human genetic diseases. Therefore, we investigated whether long read sequencing could facilitate genetic analysis of murine models for human diseases.

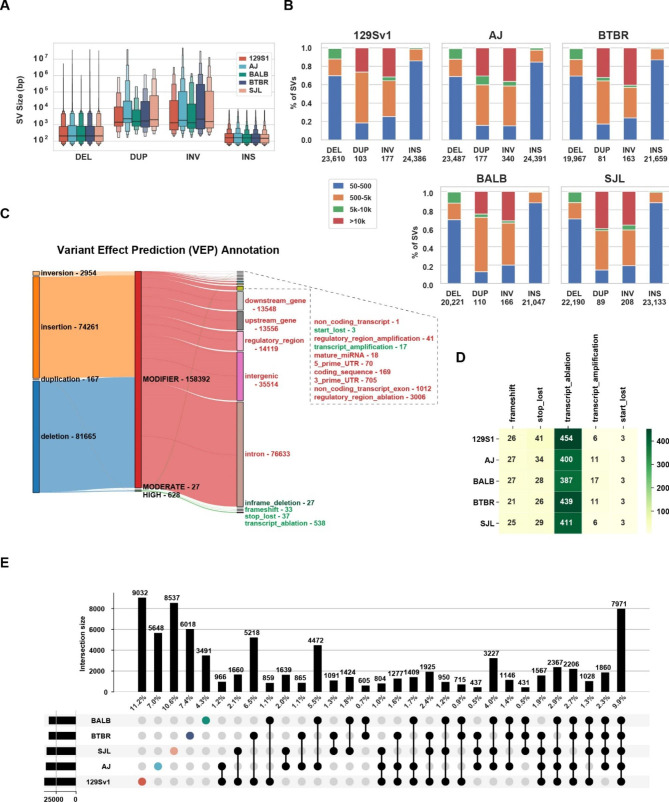
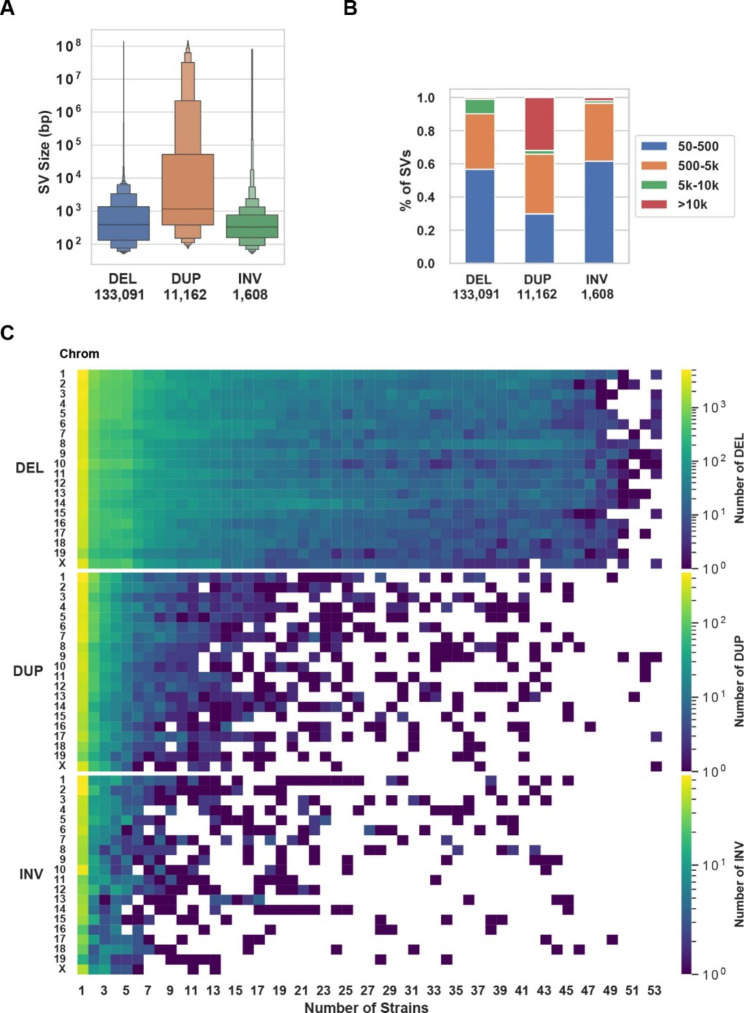
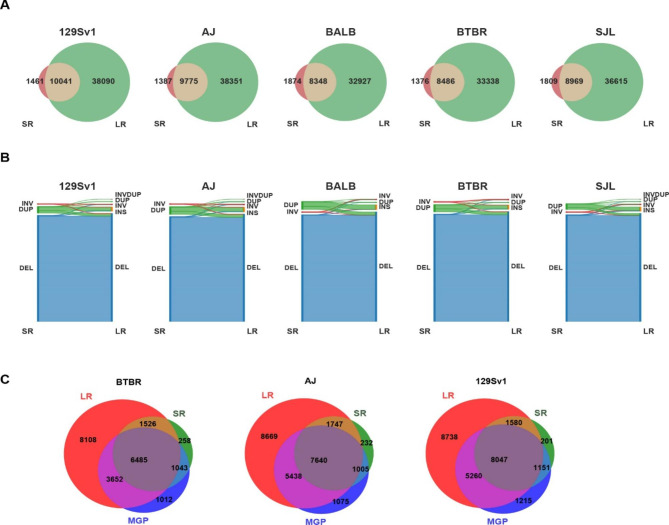
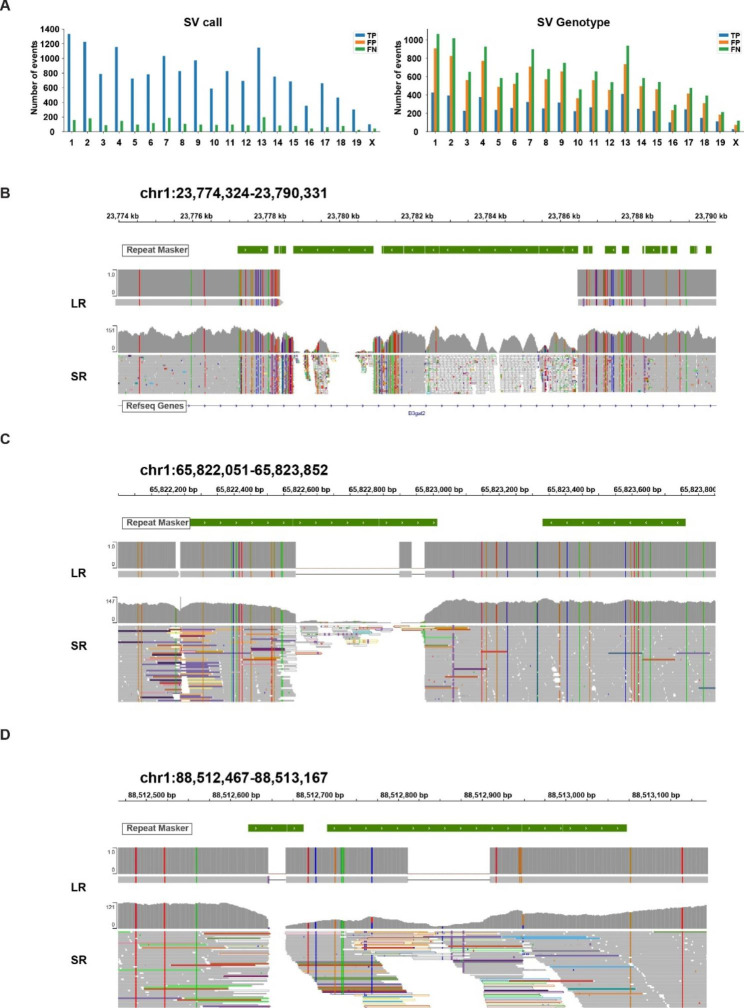
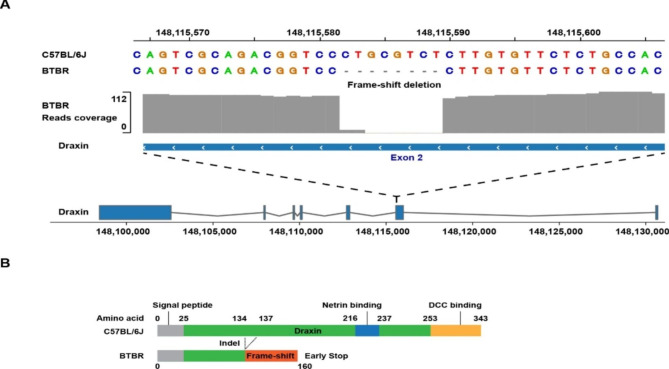
Results: The genomes of six inbred strains (BTBR T + Itpr3tf/J, 129Sv1/J, C57BL/6/J, Balb/c/J, A/J, SJL/J) were analyzed using long read sequencing. Our results revealed that (i) Structural variants are very abundant within the genome of inbred strains (4.8 per gene) and (ii) that we cannot accurately infer whether structural variants are present using conventional short read genomic sequence data, even when nearby SNP alleles are known. The advantage of having a more complete map was demonstrated by analyzing the genomic sequence of BTBR mice. Based upon this analysis, knockin mice were generated and used to characterize a BTBR-unique 8-bp deletion within Draxin that contributes to the BTBR neuroanatomic abnormalities, which resemble human autism spectrum disorder.

Conclusion: A more complete map of the pattern of genetic variation among inbred strains, which is produced by long read genomic sequencing of the genomes of additional inbred strains, could facilitate genetic discovery when murine models of human diseases are analyzed.

Keywords: Genetic analysis; Mouse genetic models; Structural variation.


Conflict of interest statement

The authors declare that they have no competing interests.

Figures

Fig. 1
Fig. 1
Characterization of SVs within the 129Sv1, A/J, SJL, Balb/c and BTBR genomes. (A) The letter-value boxplots [62] show the size distribution of the 4 different types of SVs that are present in the genomes of the 5 strains: DEL, deletions; DUP, duplications; INV, inversions; and INS, insertions. The wide box shows the 25–75% values, while each of the smaller boxes show 12.5% of each data set. (B) Each of the four types of SV are categorized according to their size in each strain, and the total numbers of each type of SV is shown at the bottom. (C) This Sankey diagram shows the predicted functional consequences for the four different types of SV, which are categorized by their estimated severity (MODIFIER, MODERATE, HIGH). Only 628 SV are predicted to have a high functional impact (green), while most SVs are predicted to have a minor impact. The number of SVs with each type of functional annotation are indicated. (D). The number and type of the high impact SVs present in each of the 5 strains are shown. (E) This UpSet plot shows unique and shared SVs for each of the 5 strains. In the top graph, each vertical bar represents the number (and percentage) of SVs present in the strain(s) indicated in the intersection matrix, which is located below the top graph. In the intersection matrix, the total number of SVs in each of the 5 strains is indicated by the horizontal bar on the left; each colored dot indicates a single strain; and bars with 2 or more black dots indicate the number of shared SV among the strains indicated by the black dots
Fig. 2
Fig. 2
SV within the genome of 53 inbred mouse strains. (A) Letter-value boxplots show the size distribution of deletion, duplication and inversion SVs, which have a median length of 337, 680, and 362 bp, respectively. The total number of each type of SV is shown at the bottom. (B) The SVs are categorized into four subgroups according to their size: 50–500 bp, 500 bp-5 kb, 5-10 kb, and > 10 kb. Over 90% of the deletions are < 5 kb, 97% of the inversions are < 5 kb, but 19% of the duplications are > 10 kb. (C) The number of SVs are categorized according to their type and chromosomal location, and by the number of inbred strains with a strain-shared SV. Each box color indicates the number of each type of SV according to the scale shown at the top. A white area indicates that shared SVs were not found for that number of strains. Deletions are the most common type of SV, and the majority are uniquely present in one strain
Fig. 3
Fig. 3
Comparison of SV identified by analysis of SR and LR SV genomic sequence. (A) These Venn diagrams show the overlap of the SVs identified by our analysis of LR or SR sequence for the indicated 5 strains. (B) These Sankey diagrams indicate the number and type of SR-SVs that were confirmed after analysis of the LR sequence for each strain. Overall, the percentage of SR-SVs that were confirmed by the LR analysis are: 99.4% for DEL, 5% for DUP, and 61.3% for INV. Duplications > 10 kB are the major cause of the discordance between the SR and LR results. (C) These Venn diagrams show the overlap of the deletions identified in three inbred strains (BTBR, 129Sv1, and A/J) by our analysis of LR and SR genomic sequence, and with those in the MGP datasets. The number of deletions that were uniquely present in the LR, MGP and SR datasets are indicated in the red, blue, and green areas, respectively. Overall, the LR datasets contain most of deletions found in the SR or MGP datasets, but the LR datasets contain many more deletions than were present in either the SR or MGP datasets
Fig. 4
Fig. 4
Short-read (SR) sequence analysis has a very limited ability to identify SV present in the genome of inbred strains even when the coordinates for the SV are known. SV were identified by de novo assembly of BTBR LR genomic sequence. These results were compared with the SVs that were identified by analysis of SR BTBR genomic sequence. (A) Evaluation of the SVs identified (left panel) and genotyping calls (right panel) by the vg program are displayed by chromosome. For SV calling, 88.3% of known SVs (True Positive, TP) were correctly identified by BTBR SR genomic sequence analysis; there were no False Positive (FP) events; and only 11.6% (False Negatives, FN) of the known SV were missed using the SR sequence. However, only 29% of the known SV were correctly genotyped as homozygous by the SR analysis. (B-D) SR alignments for three heterozygous SV were visualized using the integrative genomics viewer. The deletions shown in these 3 examples are homozygous SVs present in BTBR, which were inferred from the de novo assembly of the LR BTBR genomic sequence. However, there are SR sequence segments that align with sequences within the deleted region. The repeat masker at the top of each image shows the locations of repeats and low complexity sequence regions, which are the sites that improperly align with some SR segments
Fig. 5
Fig. 5
Histograms showing the size distribution of the different types of structural variants (SV) identified by analysis of long read (LR) or short read (SR) genomic sequence data for 5 inbred strains. The lines show the continuous density distribution for each type of SV as determined by Gaussian kernel estimation. Deletions are the most abundant type of SV, and the top graph indicates that many more deletions are identified using LR genomic sequence, especially when the deletion size is either < 1kB or > 10kB. The density lines in the middle graph show that LR sequence analysis also identifies more inversions, especially those with a size > 1kB. In the bottom graph, it appears that more duplications were detected with SR sequence. However, similar to what was observed with deletions (see Fig. 4B-D), the increased number of duplications may result from improper alignment of SR genomic segments, which occurs because of the limitations of SR genomic sequencing technology. Of importance, the small number of very large SVs must be experimentally verified
Fig. 6
Fig. 6
BTBR mice have a non-functional Draxin protein that contributes to the absence of its corpus collosum (CC). A) BTBR has an 8 bp deletion at the 3’ end of exon 2 of Draxin, which is not present in 52 other strains. B) The full length draxin protein has 343 amino acids, but this frameshift deletion generates a termination codon at amino acid 160; this eliminates the Netrin and DCC binding domains from BTBR Draxin that are essential for its neurodevelopmental function. C) The CC is partially restored in BTBR mice with a heterozygous knockin (KI) that reverted the 8 bp Draxin deletion to wild type (BTBRDraxin WT/− KI mice). Coronal (rows 1–2) and horizontal (row 3) images of adult female C57BL/6, BTBR and BTBRDraxin WT/− KI mice obtained with a Bruker 11.7-T MRI. Each row represents aligned brain sections obtained from these mice. The CC is within the areas indicated by the red dotted lines. BTBR mice have a complete agenesis of the CC (as indicated by the disconnection between the left and right hemispheres), the CC of C57BL/6 mice is intact, and the CC in BTBRDraxin WT/− KI mice was partially restored. D) The length of the CC was quantitated along the rostro-caudal axis by analysis of serial aligned coronal sections (n = 3 mice per group). The red dotted lines shown in the top two rows of Fig. 6C outline the CC. The CC length is determined by an automated measurement of the distance between the outer two ends of the CC (excluding gaps) that are shown in the outline. The sites where the BTBR Draxin WT/− KI measurements significantly differ from BTBR (Tukey’s multiple comparison test) are indicated (*, p < 0.05; and **, p < 0.01.The partial correction of the CC in BTBRDraxin WT/− KI mice is indicated by the significantly increased length of the CC relative to that in aligned sections from BTBR mice; however, the inter-hemispheric connections in the more rostral and caudal sections of BTBRDraxin WT/− KI mice are below those in C57BL/6 mice

References

    1. Mantere T, Kersten S, Hoischen A. Long-read sequencing emerging in Medical Genetics. Front Genet. 2019;10:426. doi: 10.3389/fgene.2019.00426. - DOI - PMC - PubMed
    1. van Dijk EL, Jaszczyszyn Y, Naquin D, Thermes C. The third revolution in sequencing technology. Trends Genet. 2018;34(9):666–81. doi: 10.1016/j.tig.2018.05.008. - DOI - PubMed
    1. Logsdon GA, Vollger MR, Eichler EE. Long-read human genome sequencing and its applications. Nat Rev Genet 2020. - PMC - PubMed
    1. Merker JD, Wenger AM, Sneddon T, Grove M, Zappala Z, Fresard L, Waggott D, Utiramerur S, Hou Y, Smith KS, et al. Long-read genome sequencing identifies causal structural variation in a mendelian disease. Genet Med. 2018;20(1):159–63. doi: 10.1038/gim.2017.86. - DOI - PMC - PubMed
    1. Reiner J, Pisani L, Qiao W, Singh R, Yang Y, Shi L, Khan WA, Sebra R, Cohen N, Babu A, et al. Cytogenomic identification and long-read single molecule real-time (SMRT) sequencing of a Bardet-Biedl syndrome 9 (BBS9) deletion. NPJ Genom Med. 2018;3:3. doi: 10.1038/s41525-017-0042-3. - DOI - PMC - PubMed

Substances