. 2023 Apr 11;51(6):2862-2876.
doi: 10.1093/nar/gkad082.

Near-physiological in vitro assembly of 50S ribosomes involves parallel pathways

Affiliations

Near-physiological in vitro assembly of 50S ribosomes involves parallel pathways

Xiyu Dong et al. Nucleic Acids Res. .

Abstract

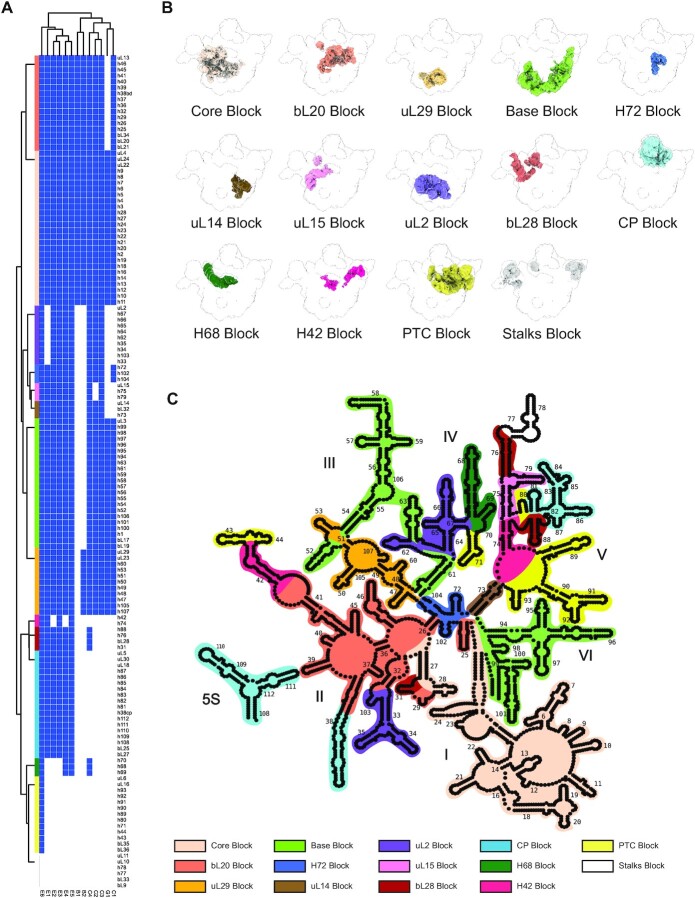
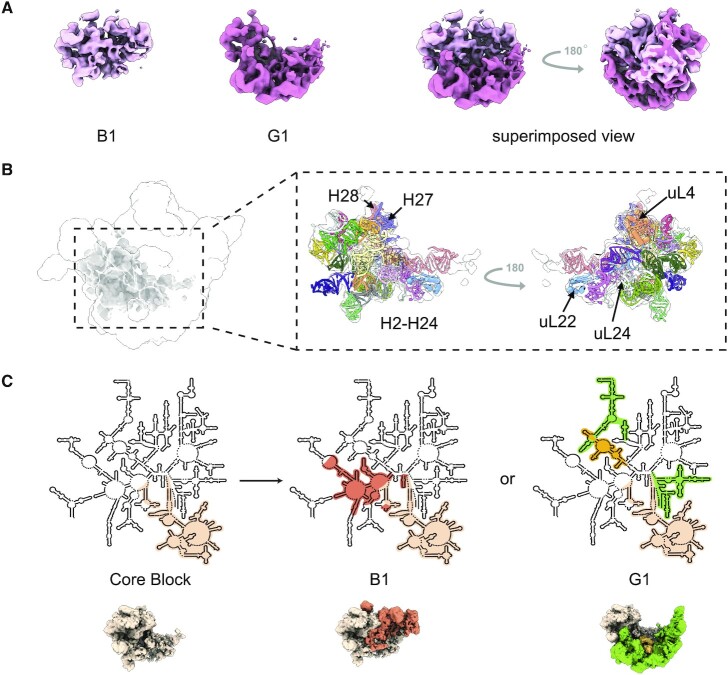
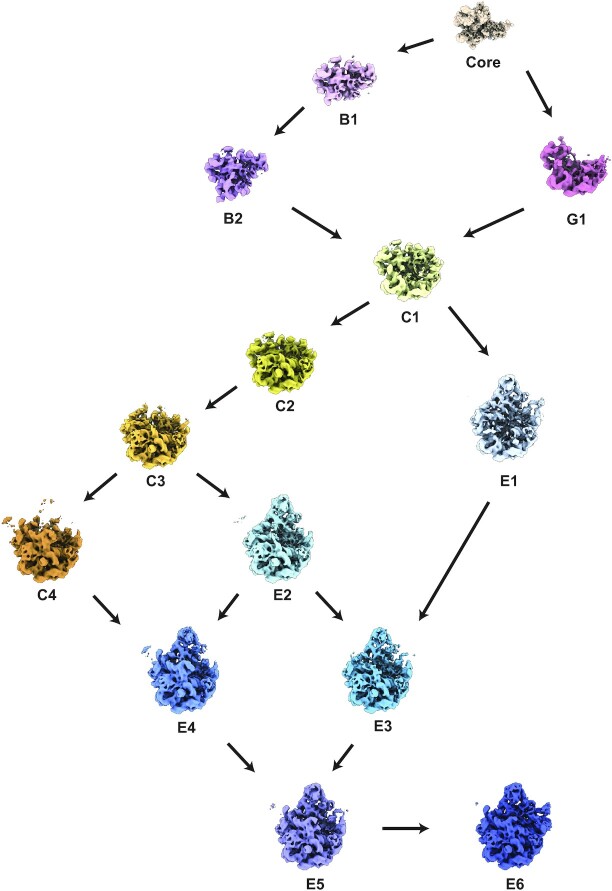
Understanding the assembly principles of biological macromolecular complexes remains a significant challenge, due to the complexity of the systems and the difficulties in developing experimental approaches. As a ribonucleoprotein complex, the ribosome serves as a model system for the profiling of macromolecular complex assembly. In this work, we report an ensemble of large ribosomal subunit intermediate structures that accumulate during synthesis in a near-physiological and co-transcriptional in vitro reconstitution system. Thirteen pre-50S intermediate maps covering the entire assembly process were resolved using cryo-EM single-particle analysis and heterogeneous subclassification. Segmentation of the set of density maps reveals that the 50S ribosome intermediates assemble based on fourteen cooperative assembly blocks, including the smallest assembly core reported to date, which is composed of a 600-nucleotide-long folded rRNA and three ribosomal proteins. The cooperative blocks assemble onto the assembly core following defined dependencies, revealing the parallel pathways at both early and late assembly stages of the 50S subunit.


Figures

Figure 1.
Figure 1.
Time course of the integrated rRNA synthesis, ribosome assembly, and translation (iSAT) reaction. (A) Schematic of the iSAT reaction. In an iSAT reaction, plasmids encoding rRNA and a reporter mRNA are transcribed by T7 polymerase. The rRNA is processed and modified by enzymes in an E. coli cell extract, and ribosomal proteins derived from purified ribosomes bind to complete the ribosomal subunits. Newly assembled ribosomes engage in the translation of the reporter protein (GFP) producing a readout that visualizes the production of functional ribosomes. (B) Fluorescence readout of iSAT. The time course of GFP fluorescence is shown for a standard iSAT reaction (black), compared to a control reaction where intact ribosomes were directly added into the reaction (gray). The delay of fluorescence signal in the iSAT reaction is due to assembly of sufficient ribosomes to produce GFP. (C) Ribosome profile of iSAT time course reactions. Five parallel iSAT reactions were quenched at sequential time points, and the ribosome profiles of the iSAT reactions were analyzed using sucrose density gradient ultracentrifugation. In general, both the size and abundance of ribosome precursors increases over time.
Figure 2.
Figure 2.
Distribution of 50S intermediates in the iSAT reaction time course. (A) Density maps for 50S intermediates. Thirteen 50S intermediates were obtained by heterogeneous subclassification from the iSAT reaction time course, where all timepoints were combined prior to analysis. The thirteen 50S precursors are named according to the major class they belong to, and are generally ordered from immature to mature. The number of particles contributing to each class is given along with the final resolution of the map. (B) Particle class distribution among the 50S intermediates. The particle distribution among 50S precursors was calculated according to the number of particles reconstructing each class (Table S2). (C) Temporal composition of 50S intermediates. The contribution of each timepoint to each 50S intermediates class was calculated and plotted in the bar plot. First, the number of the particles was normalized in each dataset of the five timepoints. Subsequently, the particle contribution of each timepoint to each class was calculated. In general, less mature classes have a higher contribution from the earlier timepoints, and the more mature classes have a higher contribution from the later timepoints. The production of ribosomes is continuous during the iSAT reaction, and it is expected that all classes could be observed at any time point.
Figure 3.
Figure 3.
Occupancy analysis of helices, proteins, and assembly blocks. (A) Occupancy of rRNA helices and ribosomal proteins. The occupancy values were calculated and binarized as described in Methods. The values were used to analyze the correlation of the 139 assembly elements for each of the 13 LSU intermediates density maps. The blue or white squares represent the presence or absence of the segments in the 13 LSU intermediates. The elements correlated to each other were determined using hierarchical clustering, and were defined as an assembly block, labeled with colored bars. The color code is consistent with that in the following figures. (B) Structures of assembly blocks. The theoretical densities of the 14 assembly blocks are colored in the 50S crystal structure (PDB: 4YBB). (C) rRNA composition of the assembly blocks. The rRNA helices in the 23S rRNA secondary structure map are colored according to the assembly blocks.
Figure 4.
Figure 4.
Complete 50S assembly map including RNA and protein elements. The assembly blocks and their downstream dependencies are colored according to Figure 3C. Block dependencies were determined using a quadrant analysis as described in Materials and Methods and are shown as bold colored arrows. The rRNA helices are outlined in black rectangle boxes, while the ribosomal proteins are in the black circles.
Figure 5.
Figure 5.
Updated Nierhaus assembly map including assembly block hierarchy. The original protein dependencies from the Nierhaus assembly map are shown as thick and thin black arrows, for strong and weak dependencies. The 23S rRNA bar is annotated both with the domain designation and colored according to the iSAT assembly blocks. The order of the block dependencies in Figure 4 is shown on the right to indicate early to late progress. The positions of the ribosomal proteins are rearranged horizontally according to the position of the interacting rRNA helices in the same block, and rearranged vertically according to the dependencies of the assembly. The newly observed block dependencies are consistent with the original Nierhaus assembly map and with a 5’ to 3’ co-transcriptional direction of assembly.
Figure 6.
Figure 6.
Evidence for parallel steps early in assembly. (A) The superimposed structures of 50S intermediates B1 (light pink) and G1 (dark pink). The density region in common between the B1 and G1 classes corresponds to the Core Block. (B) The Core Block comprises primarily domain I. The position and structure of the assembly Core Block are displayed. The rRNA helices and ribosomal proteins uL4, uL22 and uL24 are labeled, consistent with formation of domain I as the earliest step in assembly (Figure 5). (C) Parallel pathway early in assembly. Formation of the B1 class and the G1 class occurs by consolidation of either domain II (for B1) or domains III/VI (for G1) to the Core Block, indicating two parallel pathways after the folding of the Core Block. The rRNA secondary structure maps are colored according to the blocks. The theoretical densities of the corresponding blocks are generated from the 50S crystal structure (PDB: 4YBB) and displayed below the secondary structure maps. The color codes are consistent with the previous figures.
Figure 7.
Figure 7.
Organization of 50S intermediates into an assembly pathway. The thirteen reconstructed 50S intermediates from the iSAT reaction are organized according to the dependencies of the assembly blocks. The arrows indicate the minimal folding steps required to connect the set of intermediates. The theoretical density of the Core Block is shown according to the 50S PDB model 4YBB.

Similar articles

Cited by

References

    1. Friesen J.D. Escherichia coli and Salmonella typhimurium: cellular and molecular biology. Science. 1988; 240:1678–1681. - PubMed
    1. Shajani Z., Sykes M.T., Williamson J.R.. Assembly of bacterial ribosomes. Annu. Rev. Biochem. 2011; 80:501–526. - PubMed
    1. Pletnev P., Guseva E., Zanina A., Evfratov S., Dzama M., Treshin V., Pogorel'skaya A., Osterman I., Golovina A., Rubtsova M.et al. .. Comprehensive functional analysis of Escherichia coli ribosomal RNA methyltransferases. Front. Genet. 2020; 11:97. - PMC - PubMed
    1. Wilson D.N., Nierhaus K.H.. The weird and wonderful world of bacterial ribosome regulation. Crit. Rev. Biochem. Mol. Biol. 2007; 42:187–219. - PubMed
    1. Chen S.S., Sperling E., Silverman J.M., Davis J.H., Williamson J.R.. Measuring the dynamics of E. coli ribosome biogenesis using pulse-labeling and quantitative mass spectrometry. Mol. Biosyst. 2012; 8:3325–3334. - PMC - PubMed

Publication types

MeSH terms