. 2023 Apr 24;51(7):3420-3435.
doi: 10.1093/nar/gkad127.

YbiB: a novel interactor of the GTPase ObgE

Affiliations

YbiB: a novel interactor of the GTPase ObgE

Babette Deckers et al. Nucleic Acids Res. .

Abstract

Obg is a widely conserved and essential GTPase in bacteria, which plays a central role in a large range of important cellular processes, such as ribosome biogenesis, DNA replication, cell division and bacterial persistence. Nevertheless, the exact function of Obg in these processes and the interactions it makes within the associated pathways remain largely unknown. Here, we identify the DNA-binding TrpD2 protein YbiB as an interactor of the Escherichia coli Obg (ObgE). We show that both proteins interact with high affinity in a peculiar biphasic fashion, and pinpoint the intrinsically disordered and highly negatively charged C-terminal domain of ObgE as a main driver for this interaction. Molecular docking and X-ray crystallography, together with site-directed mutagenesis, are used to map the binding site of this ObgE C-terminal domain within a highly positively charged groove on the surface of the YbiB homodimer. Correspondingly, ObgE efficiently inhibits the binding of DNA to YbiB, indicating that ObgE competes with DNA for binding in the positive clefts of YbiB. This study thus forms an important step for the further elucidation of the interactome and cellular role of the essential bacterial protein Obg.


Figures

Figure 1.
Figure 1.
YbiB is involved in persistence. (A) Persister fractions after ofloxacin treatment of BW25113 containing either pBAD33Gm or pBAD33Gm-ybiB. Means ± SEM are presented (n = 13). *: P-value < 0.01. (B) Persister fractions after ofloxacin treatment of BW25113 and BW25113 ΔybiB containing either pBAD/HisA or pBAD/HisA-obgE. Means ± SEM are presented (n = 7). *: P-value < 0.01.
Figure 2.
Figure 2.
ObgE and YbiB interact with high affinity. (A) In vitro pull-down assays performed with purified ObgE (C-terminally Twin-Strep-tagged) and YbiB (N-terminally His6-tagged) using Strep-Tactin beads. The Strep-Tactin beads were incubated with ObgE alone, YbiB alone or a mixture of both proteins. Proteins were eluted with buffer containing desthiobiotin. The experiment was performed for different nucleotide states of ObgE (nucleotide free (NF), GDP-bound and GTPγS-bound). M: Molecular mass marker (PageRuler™ Prestained protein ladder, ThermoFischer Scientific). (B) ITC measurement to assess the binding between ObgE and YbiB. The sample cell was filled with 75 μM ObgE while the syringe was loaded with 1 mM YbiB. The measurement was performed in triplicate. The resulting binding isotherms were fitted on a ‘two sets of sites’ model, with the ‘ligand in cell’ function activated, to determine affinities (KD1 and KD2) and stoichiometries (n1 and n2) for both binding events. Based on the three repeats, average KD-values (±SD) of respectively 22 ± 2 nM and 5 ± 2 μM are obtained. (C) Size exclusion chromatography (SEC) coupled to multi-angle light scattering (MALS) of ObgE (orange), YbiB (blue) and a YbiB-ObgE (1:3 molar ratio) mixture (green). The chromatograms display the scaled UV absorption at 280 nm (right y-axis), while the molar masses determined for the corresponding elution peaks (indicated in the same color) can be read from the left y-axis.
Figure 3.
Figure 3.
The ObgE C-terminal domain is important for the interaction with YbiB. (A) ITC measurement between the C-terminally truncated ObgE1–340 construct and YbiB. The sample cell was filled with 75 μM ObgE1-340 while the syringe was loaded with 1 mM YbiB. (B) ITC measurement between a synthesized peptide (peptide1), representing the entire intrinsically disordered C-terminal domain of ObgE, and YbiB. The sample cell was filled with 75 μM peptide1 while the syringe was loaded with 1.2–1.4 mM YbiB. The measurement was performed in triplicate. The resulting binding isotherms were fitted on a ‘two sets of sites’ model, with the ‘ligand in cell’ function activated, to determine affinities (KD1 and KD2) and stoichiometries (n1 and n2) for both binding events. Based on the three repeats, average KD-values (±SD) of respectively 141 ± 30 nM and 6 ± 1 μM are obtained. (C) ITC measurements performed between YbiB and different overlapping peptides of 20 amino acids that each cover a certain region of the intrinsically disordered C-terminal domain of ObgE. The sample cell was filled with 75 μM peptide while the syringe was loaded with around 1.3 mM YbiB. The resulting binding isotherms were fitted on a suitable model to determine affinities (KD) and stoichiometries (n). (D) CD spectra recorded for peptide1 (blue), YbiB (orange) and their complex (green). After subtracting the spectrum obtained for YbiB from the spectrum obtained for the complex, a CD spectrum for the bound C-terminal ObgE peptide is obtained (red). The inset shows a zoomed-in view of the CD spectra obtained for unbound (orange) and bound (red) peptide1.
Figure 4.
Figure 4.
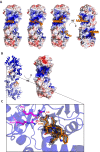
Structural basis of the interaction between YbiB and the ObgE C-terminal domain. (A) Docking models obtained for the YbiB dimer in complex with part of the ObgE C-terminus. Left: Top 10 docking models obtained by docking the ObgE C-terminal peptide 370EDWDDDWDE378 to the YbiB dimer using the motif-based ClusPro-PeptiDock program. Middle: Top 10 docking models obtained by docking the ObgE C-terminal peptide 361LEEIAEEDDEDWDDDWDEDDEE382 to the YbiB dimer using the CABS-dock program. Right: The 5 AlphaFold-Multimer models obtained for the YbiB dimer bound to the ObgE C-terminal peptide with sequence 361LEEIAEEDDEDWDDDWDEDDEE382. The electrostatic potential surface of the published YbiB structure (PDB: 4MUO) is superposed with the obtained models. Note: All docking solutions are shown on the same protomer within the YbiB dimer. (B) Left: Structure of the YbiB dimer in complex with part of the ObgE C-terminal peptide4 (361LEEIAEEDDEDWDDDWDEDD380, residues resolved in the structure are indicated in bold). One protomer of the YbiB dimer is colored blue, while the other protomer is colored in slate. The ObgE C-terminal peptide is shown as orange sticks. Right: Electrostatic potential surface representation of the YbiB dimer. Positively charged regions are colored blue, while negatively charged areas are colored red. The ObgE C-terminal peptide is shown as orange sticks. (C) Zoom-in on the ObgE C-terminal peptide (shown in orange sticks) displayed with its corresponding omit map contoured at 0.7σ (black mesh) bound to YbiB (blue cartoon). The Glu378 residue (E378, orange) seems to interact with Arg92 (R92, magenta sticks) and Arg123 (R123, magenta sticks) of YbiB. Possible interactions are represented by red dashed lines and the corresponding distances are displayed in Å.
Figure 5.
Figure 5.
YbiB does not function as a GAP of ObgE. Steady-state initial rate kinetics (Michaelis–Menten) data obtained for GTP hydrolysis by ObgE in absence (orange) and presence (blue) of YbiB. Measurements were performed in triplicate. Steady-state kinetics parameters, obtained by fitting the curves on the Michaelis-Menten equation, are displayed ± SEM.
Figure 6.
Figure 6.
ObgE inhibits DNA binding to YbiB. Electrophoretic mobility shift assays (EMSAs) performed for YbiB WT in absence (A) and presence (B) of ObgE. (A) A 32P-labeled ssDNA strand of 58 base pairs was incubated with increasing concentrations of YbiB. (B) The same 32P-labeled ssDNA probe was incubated with 2 μM of YbiB and increasing concentrations of ObgE. As a control, the DNA probe was also incubated with the highest concentration of ObgE in absence of YbiB. All samples were analyzed on a 6% polyacrylamide gel.

References

    1. Bourne H.R., Sanders D.A., McCormick F.. The gtpase superfamily: conserved structure and molecular mechanism. Nature. 1991; 349:117–127. - PubMed
    1. Wittinghofer A., Vetter I.R.. Structure-function relationships of the G domain, a canonical switch motif. Annu. Rev. Biochem. 2011; 80:943–971. - PubMed
    1. Leipe D.D., Wolf Y.I., Koonin E.V., Aravind L.. Classification and evolution of P-loop gtpases and related atpases. J. Mol. Biol. 2002; 317:41–72. - PubMed
    1. Bos J.L., Rehmann H., Wittinghofer A.. GEFs and gaps: critical elements in the control of small G proteins. Cell. 2007; 129:865–877. - PubMed
    1. Cherfils J., Zeghouf M.. Regulation of small gtpases by gefs, GAPs, and GDIs. Physiol. Rev. 2013; 93:269–309. - PubMed

Publication types

MeSH terms

LinkOut - more resources