. 2023 Jun 9;51(10):4745-4759.
doi: 10.1093/nar/gkad109.

Endogenous retrovirus-derived enhancers confer the transcriptional regulation of human trophoblast syncytialization

Affiliations

Endogenous retrovirus-derived enhancers confer the transcriptional regulation of human trophoblast syncytialization

Miao Yu et al. Nucleic Acids Res. .

Abstract

Endogenous retroviruses (ERVs) have been proposed as a driving force for the evolution of the mammalian placenta, however, the contribution of ERVs to placental development and the underlying regulatory mechanism remain largely elusive. A key process of placental development is the formation of multinucleated syncytiotrophoblasts (STBs) in direct contact with maternal blood, through which constitutes the maternal-fetal interface critical for nutrient allocation, hormone production and immunological modulation during pregnancy. We delineate that ERVs profoundly rewire the transcriptional program of trophoblast syncytialization. Here, we first determined the dynamic landscape of bivalent ERV-derived enhancers with dual occupancy of H3K27ac and H3K9me3 in human trophoblast stem cells (hTSCs). We further demonstrated that enhancers overlapping several ERV families tend to exhibit increased H3K27ac and reduced H3K9me3 occupancy in STBs relative to hTSCs. Particularly, bivalent enhancers derived from the Simiiformes-specific MER50 transposons were linked to a cluster of genes important for STB formation. Importantly, deletions of MER50 elements adjacent to several STB genes, including MFSD2A and TNFAIP2, significantly attenuated their expression concomitant to compromised syncytium formation. Together, we propose that ERV-derived enhancers, MER50 specifically, fine-tune the transcriptional networks accounting for human trophoblast syncytialization, which sheds light on a novel ERV-mediated regulatory mechanism underlying placental development.


Figures

Figure 1.
Figure 1.
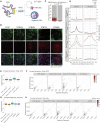
ERV-derived enhancers bear the features of H3K9me3/H3K27ac bivalent histone modifications in human trophoblasts. (A) Schematic representation of hTSC derivation and differentiation. hTSC derived from the first-trimester placental villi were maintained in hTSC medium or subject to 2D (STB, EVT) and 3D (organoid) differentiation. (B) Representative immunostaining of ECAD (green), hCG (red) and DAPI (blue) in hTSC and STB at the indicated timepoints of syncytialization in 2D culture. Scale bar, 50 μm. (C) The relative abundance of annotated enhancers with bivalent marks (H3K27ac and H3K9me3) in hTSC relative to STB. P-value is calculated by using Fisher's exact test. (D) Averaged ChIP intensity plots showing the alteration of H3K27ac and H3K9me3 marks at different groups of annotated enhancers in hTSC and STB. The numbers for the four groups (i.e. hTSC-Specific, Shared (hTSC-Active), Shared (hTSC-Bivalent) and STB-Specific) of enhancers are 48467, 24292, 4881 and 19411, respectively. (E) Boxplots for the enrichment of different ERV families in grouped enhancers for hTSC and STB based on the publicly available epigenomic data. (F) Scatter plots for the enrichment of ERV families in different groups of enhancers. The x- and y-axis represent the expected and observed frequency of different ERV families in enhancers. The color gradient indicates the -log10(p-value) adjusted with Bonferroni correction. (GH) Counterpart data to E and F based on newly generated epigenomic data for hTSC and STB at the indicated differentiation timepoint.
Figure 2.
Figure 2.
Putative bivalent MER50 enhancers are associated with STB gene expression. (A) Venn diagram illustrates 2455 overlapped genes up-regulated in STBs (defined as STB genes) relative to hTSCs based on RNA-Seq data from Okae et al. (2018) and the current study. (B) The bubble diagram shows the ranking of ERV subtypes close to STB genes (ERVs resident within 10 kb centered on the gene body) by the order of STB gene numbers associated with a given ERV. The x-axis represents the numbers for ERV-adjacent genes, and the size of the circle represents the number of ERV-adjacent STB genes. (C) Alteration of H3K27ac and H3K9me3 occupancy between hTSC and STB for the STB enhancers overlapping the top 5 ERV families enriched surrounding STB-specific genes. The averaged curves show the normalized ChIP intensity surrounding ERV elements that overlap STB enhancers. (D) Expression changes of MER50-associated genes in hTSC and STB. Different groups of genes are defined based on the distance of their TSSs to the nearest MER50 elements. (E, F) Enrichment of MER50 within different groups of enhancers annotated for hTSC and STB, using public data (E) and new data (F), respectively. The color gradient indicates the −log10(P-value) adjusted with Bonferroni correction. (G) Heatmaps showing the intensity of various histone modifications flanking different groups of MER50-associated enhancers.
Figure 3.
Figure 3.
MER50 cis-regulatory elements drive the expression of the adjacent STB genes. (A) Schematic of the enhancer and promoter reporter system evaluating the transcriptional regulation activity of the MER50 conserved sequence. miniP, minimal promoter; FLUC, Firefly Luciferase. (B, C) Dual-luciferase reporter assays in HEK293T, hTSC, and STB. Cells were transfected with the indicated enhancer (B) or promoter (C) reporter vectors, and the LTR activity was calculated based on relative fold changes in FLUC activity (FLUC/RLUC). Results represent the mean ± SEM of 3–5 independent experiments. **P < 0.01; ***P< 0.001; ****P< 0.0001, by Mann–Whitney test and one- or two-way ANOVA. (D) Venn diagram depicting the intersection between the coding genes adjacent to MER50 (MER50 resident within 20 kb centered on the gene body) and the STB genes defined in Figure 2A. (E) Heatmap representation of dynamic gene expression (Z-score-transformed FPKM) of 40 genes overlapped in (D) in the process of trophoblast syncytialization. (F, G) Genome browser representation for RNA-Seq, H3K27ac, H3K4me3 (data from this study) and H3K9me3 (data from Okae et al.) ChIP-Seq on the MFSD2A and TACC2 gene in hTSCs and STBs from continuous differentiation timepoints. MER50 ERV loci are highlighted in the box.
Figure 4.
Figure 4.
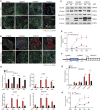
Identification of the MER50 function in regulating MFSD2A expression and STB formation. (A) Schematic diagram illustrating CRISPR knockout strategy of the MER50 sequence close to MFSD2A. (B) qPCR analysis of MFSD2A expression in the WT and ΔMER50-M cells under indicated differentiation status. Results represent the mean ± SEM of three independent experiments. *P< 0.05, **P< 0.01, Multiple unpaired t tests. (C) Representative immunostaining of ECAD (green), SDC1 (red) and DAPI (blue) in hTSC and STB derived from the WT/ΔMER50-M hTSC at 24, 48, 72 h. Scale bar, 50 μm. (D) RT-qPCR analysis of STB markers (ERVW-1, ERVFRD-1, CDH1 and CGB) in the WT/ΔMER50-M hTSC and STB at 24, 48, 72 and 96 h. Error bars represent mean ± SEM. *P< 0.05, **P< 0.01, Multiple unpaired t tests. At least three biological replicates were examined. (E) ELISA detection of hCG concentration in the supernatant from WTs and ΔMER50-M STBs. *P< 0.05, ***P< 0.001; Multiple unpaired t tests. n = 4 for each group. (F) The organoids derived from the WT/ΔMER50-M hTSCs (day 7) were stained for ECAD (green), SDC1 (red) and DAPI (blue). Scale bar, 20 μm.
Figure 5.
Figure 5.
The expression of TNFAIP2 governed by the MER50 enhancer sustains syncytialization extent. (A) Representative immunostaining of ECAD (green) and TP63 (red) shows the stemness of the WT/TNFAIP2 KO hTSCs and STBs. Scale bar, 50 μm. (B) Immunostaining for ECAD (green) and hCG (red) in the WT/TNFAIP2 KO STB at the indicated timepoints of syncytialization. Nuclei were stained with DAPI. Scale bar, 50 μm. (C) Western blots of ECAD, TEAD4, Syncytin-1 and β-hCG in the WT and TNFAIP2 KO cells. β-Actin as loading control. (D) mRNA levels of CDH1, CGB, SDC1 and ERVW-1 in the WT/TNFAIP2 KO STB at 24, 48, 72, 96 h. Results represent the mean ± SEM of at least three independent experiments. *P< 0.05, **P< 0.01, ***P< 0.001, multiple unpaired t tests. (E) ELISA detection of hCG secretion from WT and TNFAIP2 KO STBs at the indicated timepoints. *P< 0.05, **P< 0.01, ***P< 0.001, multiple unpaired t tests. n = 4. (F) Schematic diagram showing CRISPR deletion of the MER50 enhancer element close to TNFAIP2 targeted by the two flanking sgRNAs. The WT control in (E) and (H) refers to the same control cell line. (G) mRNA levels of TNFAIP2 in the WT/ΔMER50-T hTSC and STB at the 24, 48, 72, 96 h timpoints of syncytialization. *P< 0.05, t-test. Results represent the mean ± SEM of at least three independent experiments. (H) ELISA detection of hCG in culture medium from the WT and ΔMER50-T STBs at the indicated timepoints. *P< 0.05, Multiple unpaired t tests. n = 4.

References

    1. Turco M.Y., Moffett A.. Development of the human placenta. Development. 2019; 146:dev163428. - PubMed
    1. Redman C.W., Staff A.C.. Preeclampsia, biomarkers, syncytiotrophoblast stress, and placental capacity. Am. J. Obstet. Gynecol. 2015; 213:S9–S11. - PubMed
    1. Lea R.G., Tulppala M., Critchley H.O.. Deficient syncytiotrophoblast tumour necrosis factor-alpha characterizes failing first trimester pregnancies in a subgroup of recurrent miscarriage patients. Hum. Reprod. 1997; 12:1313–1320. - PubMed
    1. Shao X., Cao G., Chen D., Liu J., Yu B., Liu M., Li Y.X., Cao B., Sadovsky Y., Wang Y.L.. Placental trophoblast syncytialization potentiates macropinocytosis via mTOR signaling to adapt to reduced amino acid supply. Proc. Natl. Acad. Sci. U.S.A. 2021; 118:e2017092118. - PMC - PubMed
    1. Papuchova H., Latos P.A.. Transcription factor networks in trophoblast development. Cell. Mol. Life Sci. 2022; 79:337. - PMC - PubMed

Publication types