[Preprint]. 2023 Feb 22:2023.02.22.529564.
doi: 10.1101/2023.02.22.529564.

SPA-STOCSY: An Automated Tool for Identification of Annotated and Non-Annotated Metabolites in High-Throughput NMR Spectra

Affiliations

SPA-STOCSY: An Automated Tool for Identification of Annotated and Non-Annotated Metabolites in High-Throughput NMR Spectra

Xu Han et al. bioRxiv. .

Update in

Abstract

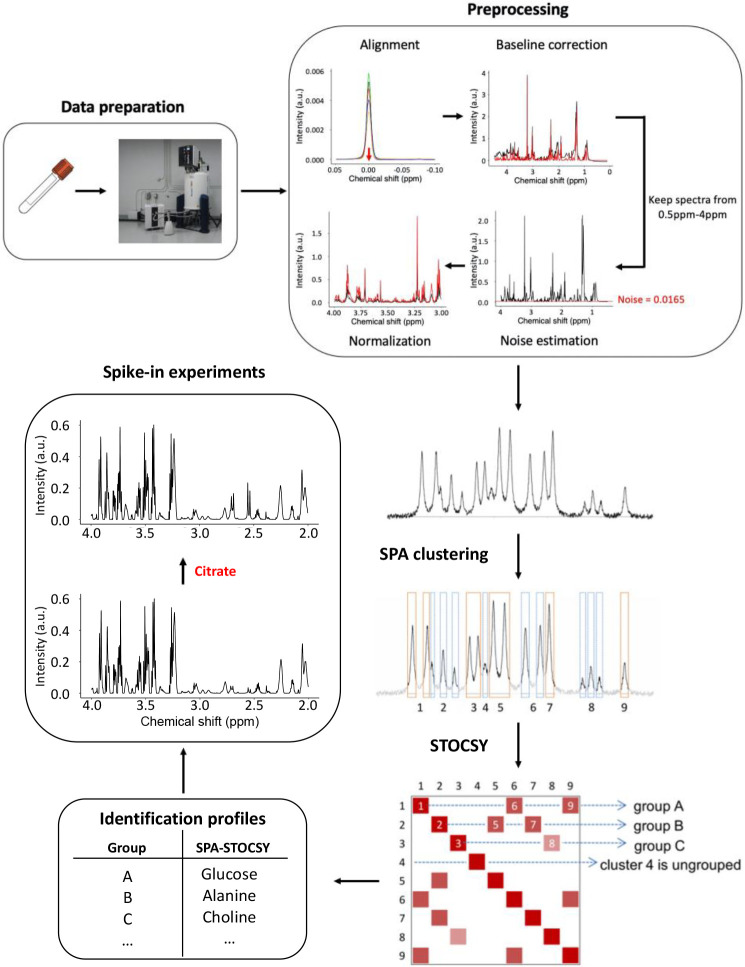
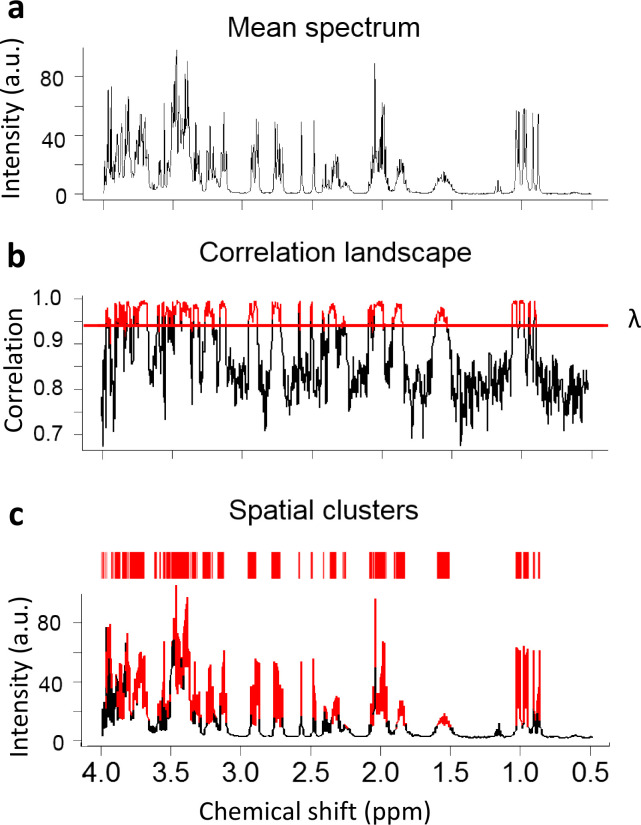
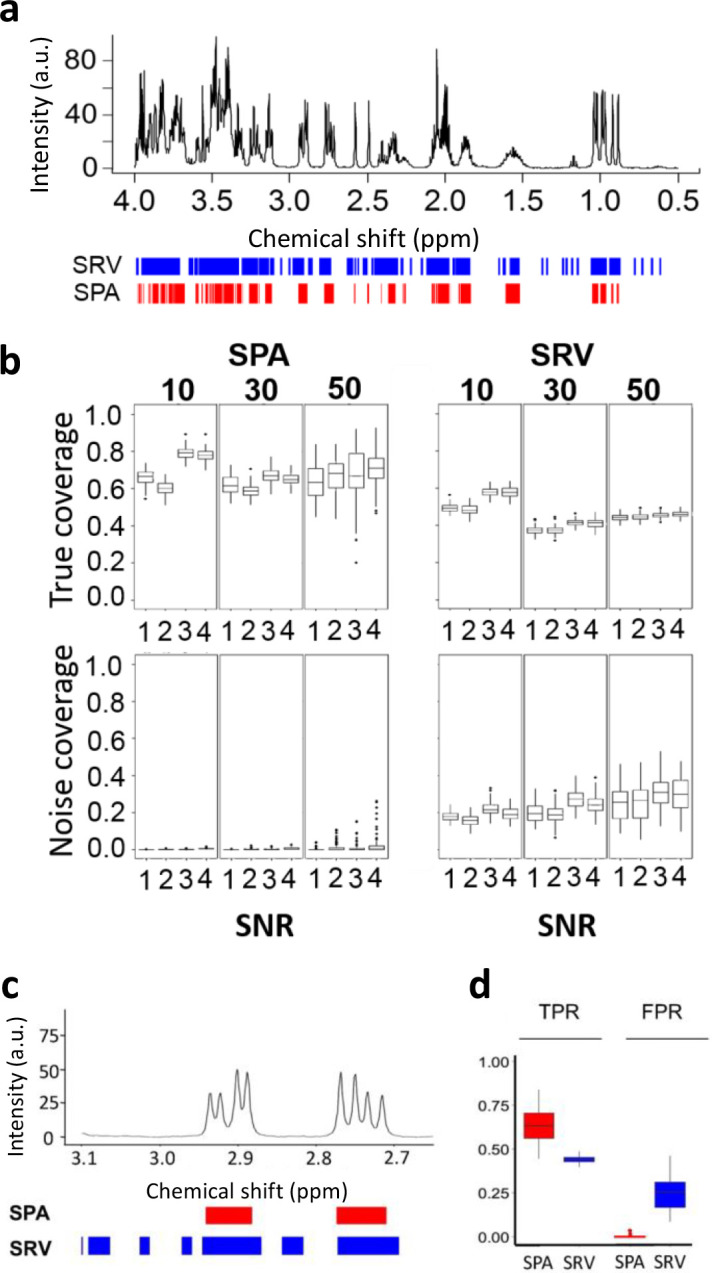
Nuclear Magnetic Resonance (NMR) spectroscopy is widely used to analyze metabolites in biological samples, but the analysis can be cumbersome and inaccurate. Here, we present a powerful automated tool, SPA-STOCSY (Spatial Clustering Algorithm - Statistical Total Correlation Spectroscopy), which overcomes the challenges by identifying metabolites in each sample with high accuracy. As a data-driven method, SPA-STOCSY estimates all parameters from the input dataset, first investigating the covariance pattern and then calculating the optimal threshold with which to cluster data points belonging to the same structural unit, i.e. metabolite. The generated clusters are then automatically linked to a compound library to identify candidates. To assess SPA-STOCSY’s efficiency and accuracy, we applied it to synthesized and real NMR data obtained from Drosophila melanogaster brains and human embryonic stem cells. In the synthesized spectra, SPA outperforms Statistical Recoupling of Variables, an existing method for clustering spectral peaks, by capturing a higher percentage of the signal regions and the close-to-zero noise regions. In the real spectra, SPA-STOCSY performs comparably to operator-based Chenomx analysis but avoids operator bias and performs the analyses in less than seven minutes of total computation time. Overall, SPA-STOCSY is a fast, accurate, and unbiased tool for untargeted analysis of metabolites in the NMR spectra. As such, it might accelerate the utilization of NMR for scientific discoveries, medical diagnostics, and patient-specific decision making.


Conflict of interest statement

Competing interests

The authors declare no competing interests.

Figures

Fig. 1 |
Fig. 1 |. SPA-STOCSY flow chart.
A set of spectra are experimentally acquired by NMR and the raw data are preprocessed. The mean spectrum of preprocessed spectra is shown before and after the SPA clustering. SPA automatically identifies clusters (outlined in orange or blue) that correlate strongly across multiple spectra (N>8). STOCSY of these clusters then automatically generates groups of clusters predicted to be from the same metabolite, i.e. the 1H chemical shifts of the clusters in each SPA-STOCSY group are predicted to be most likely from the same metabolite. Using the Chenomx, Inc. database as a reference library, SPA-STOCSY can generate an identification profile for each metabolite by summarizing the information from each cluster. Finally, to test the authenticity of identified metabolites, spike-in experiments can be performed. SPA=SPatial clustering Algorithm, STOCSY=Statistical Total Correlation Spectroscopy.
Fig. 2 |
Fig. 2 |. SPA Flowchart.
a. The mean spectrum of the simulated NMR spectra of ten metabolites. b. Correlation landscape and the threshold λ. c. Identified SPA clusters putatively belong to the same structural units of a metabolite. Red indicates clustered regions.
Fig. 3 |
Fig. 3 |. Comparison of the SPA and SRV clustering performance.
a. SPA (red) and SRV (blue) clustering on a simulated spectrum containing 10 metabolites. b. The performance of each method was measured. True coverage: Proportion of detected true metabolite regions, measured as the percentage of the metabolite regions detected over the true metabolite resonance regions. Noise coverage: Proportion of detected regions in which no metabolite resonates. This is measured as the number of detected variables located in noise regions, divided by the total number of noisy variables. Boxplots show the true coverage and noise coverage from simulated datasets using SRV and SPA of all the simulation scenarios (Supplementary Table 1). In each scenario, 100 simulations were conducted. c. A synthesized spectrum containing 50 metabolites was analyzed by both methods. SPA discriminates between signals and noise better than SRV, as illustrated on a zoomed region of the spectrum. Boxes indicate assigned clusters (red: SPA; blue: SRV). d. Boxplots show the true positive rate (TPR) and false positive rate (FPR) for SPA and SRV. SRV=Statistical Recoupling of Variables.
Fig. 4 |
Fig. 4 |. SPA coupled with STOCSY identifies connected fragments of molecules in the NMR spectra and thus, metabolites in the samples.
a. STOCSY is performed on spatial clusters obtained from the simulation dataset with 10 metabolites (Fig. 2a). 55 spatial clusters are identified with a threshold of detection 0.8. b. SPA clusters spectra into spectral regions (red) and gaps (blue). The example is given for clusters 3, 11, and 41, identified by SPA-STOCSY as highly correlated and therefore likely to belong to the same metabolite. Indeed, they belong to valine. c. 9 out of 10 metabolites in the simulated dataset are correctly identified by SPA-STOCSY in a single pass. d. Zoomed-in regions from (c). Left: SPA-STOCSY discriminates highly overlapping regions between 3.2 to 4.0 ppm, where the method identifies glucose, dihydroxy-acetone, L-tyrosine, and valine peaks. Right: SPA-STOCSY discriminates highly overlapping regions between 1.95 to 2.10 ppm, where the method identifies L-proline and glucosamine-1-phosphate (a singlet embedded in an unrelated multiplet).
Fig. 5 |
Fig. 5 |. SPA-STOCSY identifies metabolites in the Drosophila melanogaster tissue and human cultured cells.
a. SPA-STOCSY identifies 50 highly correlated clusters at a detection threshold of 0.8 in the Drosophila data. b. SPA clusters the mean spectrum (N=10) into structural units. The spectrum is color-coded by the correlation landscape values (red: strong correlations; blue: weak correlations). Clusters with high correlations are deconstructed into original resonance frequencies and the identities of the corresponding metabolites are obtained. Maltose, alanine, and acetate are given as examples. c. Amplified version for the visualization of highly correlated clusters and the corresponding metabolites from (b). d. SPA-STOCSY identifies 126 highly correlated clusters in human embryonic stem cell (hESC) datasets. e. SPA clusters the mean spectrum (N =22) into structural units. The spectrum is color-coded by the correlation landscape values (red: strong correlations; blue: weak correlations). Clusters with high correlations are deconstructed into original resonance frequencies and the identities of the corresponding metabolites are obtained. Choline, malate, and leucine are given as examples. f. Amplified version for the visualization of highly correlated clusters and the corresponding metabolites from (e). SPA-STOCSY accurately identifies molecules with complex signatures regardless of the overlapping and/or splitting regions.

Similar articles

References

    1. Markley J. L. et al. The future of NMR-based metabolomics. Current Opinion in Biotechnology vol. 43 34–40 Preprint at 10.1016/j.copbio.2016.08.001 (2017). - DOI - PMC - PubMed
    1. Emwas A. H. et al. Nmr spectroscopy for metabolomics research. Metabolites vol. 9 Preprint at 10.3390/metabo9070123 (2019). - DOI - PMC - PubMed
    1. Psychogios N. et al. The Human Serum Metabolome. PLoS One (2011) doi:10.1371/journal. - DOI - PMC - PubMed
    1. Wishart D. S. NMR metabolomics: A look ahead. Journal of Magnetic Resonance vol. 306 155–161 Preprint at 10.1016/j.jmr.2019.07.013 (2019). - DOI - PubMed
    1. Bujak R., Struck-Lewicka W., Markuszewski M. J. & Kaliszan R. Metabolomics for laboratory diagnostics. Journal of Pharmaceutical and Biomedical Analysis vol. 113 108–120 Preprint at 10.1016/j.jpba.2014.12.017 (2015). - DOI - PubMed

Publication types