[Preprint]. 2023 Feb 26:2023.02.26.530068.
doi: 10.1101/2023.02.26.530068.

Active zone protein SYD-2/Liprin- α acts downstream of LRK-1/LRRK2 to regulate polarized trafficking of synaptic vesicle precursors through clathrin adaptor protein complexes

Affiliations

Active zone protein SYD-2/Liprin- α acts downstream of LRK-1/LRRK2 to regulate polarized trafficking of synaptic vesicle precursors through clathrin adaptor protein complexes

Sravanthi S P Nadiminti et al. bioRxiv. .

Update in

Abstract

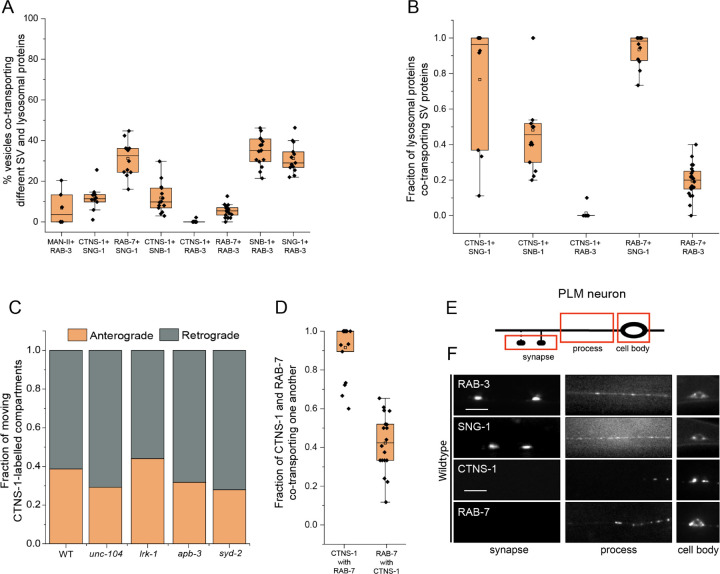
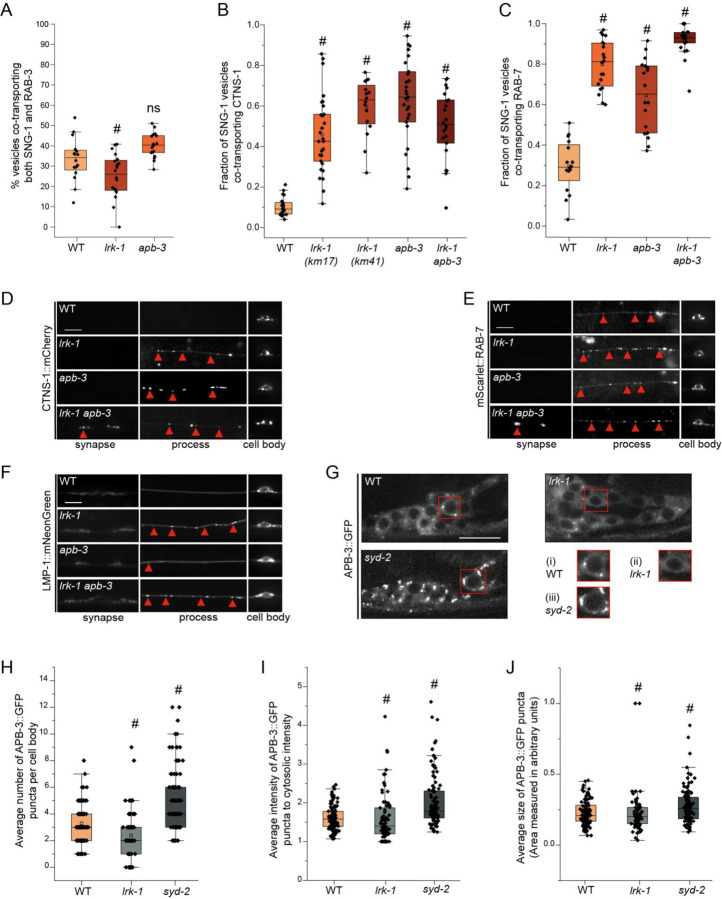
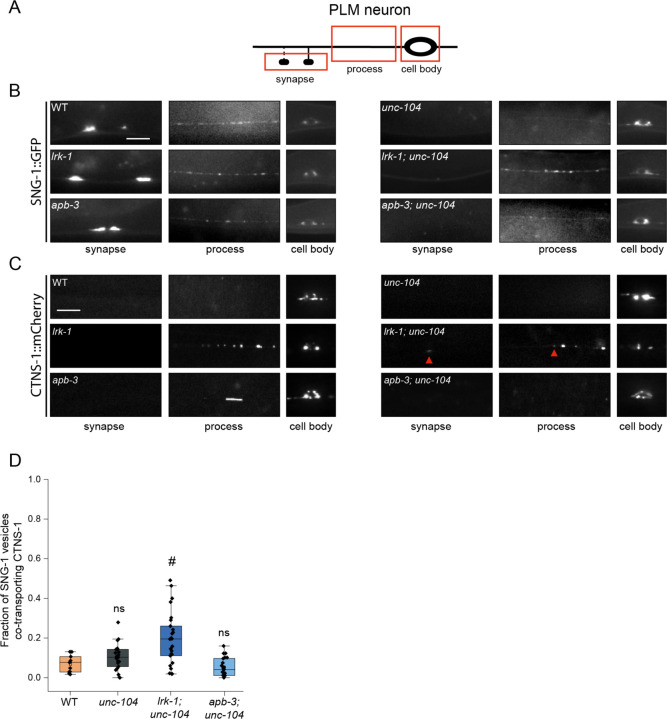
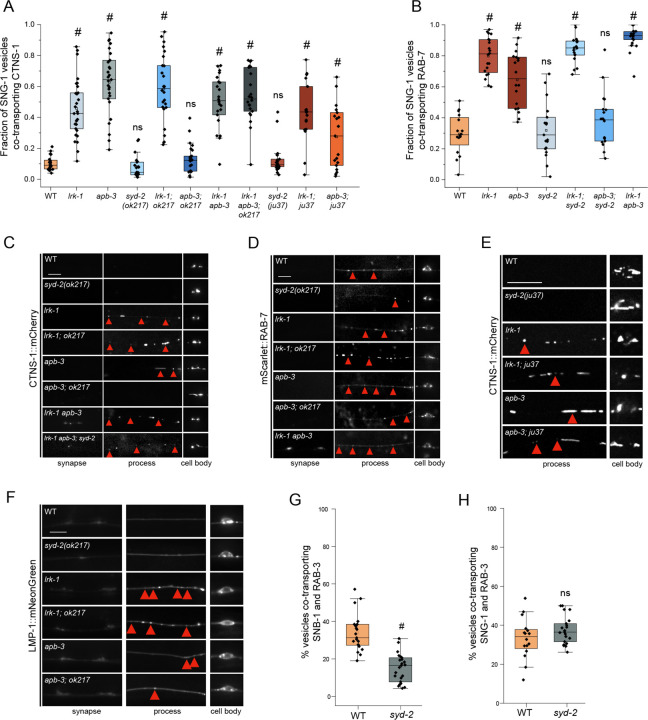
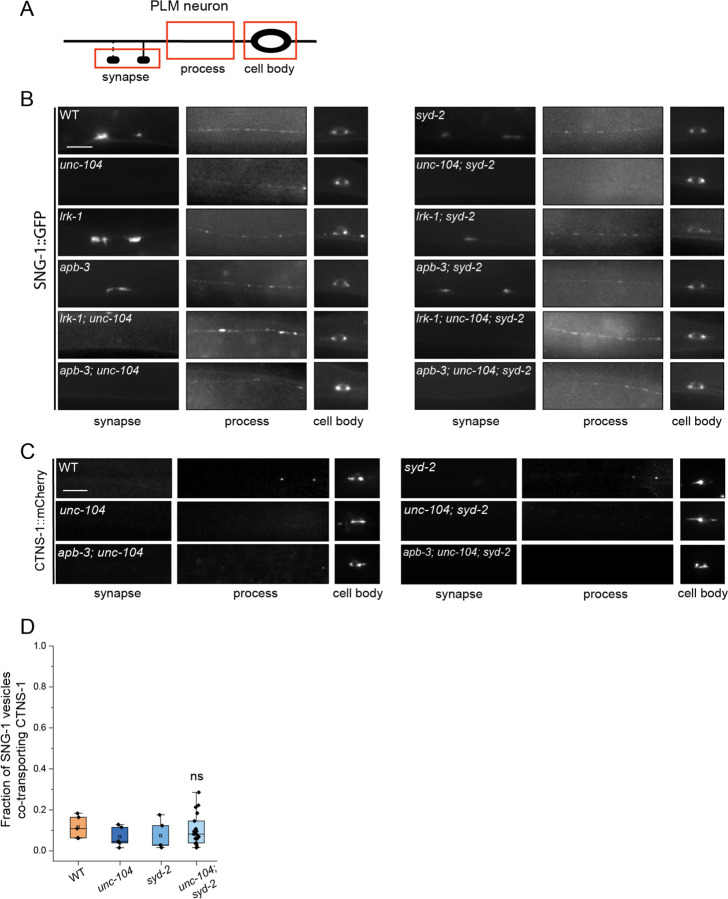
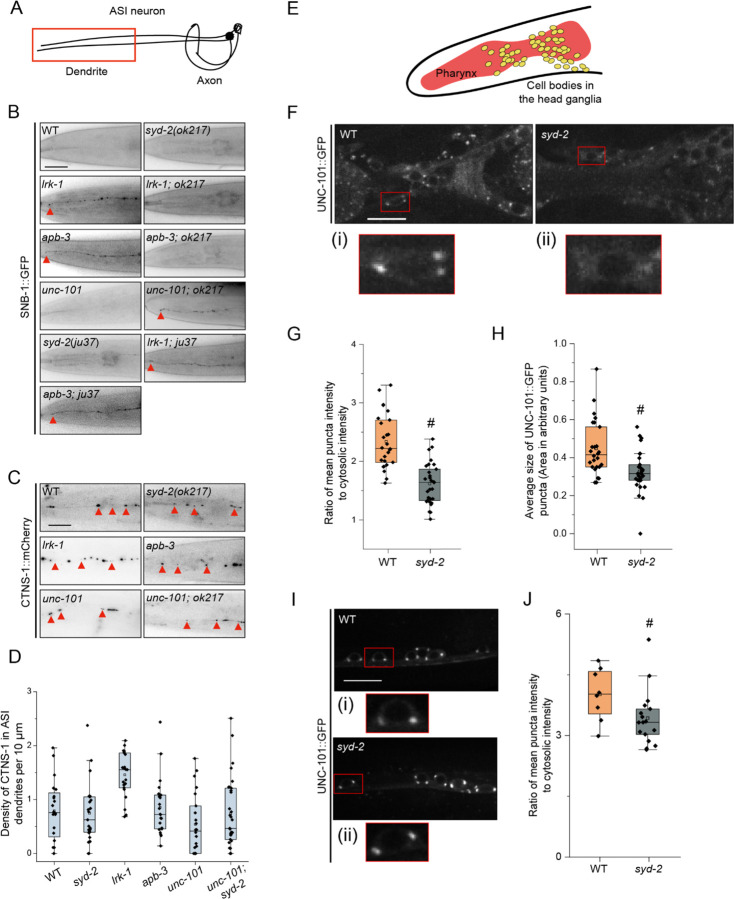
Synaptic vesicle proteins (SVps) are thought to travel in heterogeneous carriers dependent on the motor UNC-104/KIF1A. In C. elegans neurons, we found that some SVps are transported along with lysosomal proteins by the motor UNC-104/KIF1A. LRK-1/LRRK2 and the clathrin adaptor protein complex AP-3 are critical for the separation of lysosomal proteins from SVp transport carriers. In lrk-1 mutants, both SVp carriers and SVp carriers containing lysosomal proteins are independent of UNC-104, suggesting that LRK-1 plays a key role in ensuring UNC-104-dependent transport of SVps. Additionally, LRK-1 likely acts upstream of the AP-3 complex and regulates the membrane localization of AP-3. The action of AP-3 is necessary for the active zone protein SYD-2/Liprin-α to facilitate the transport of SVp carriers. In the absence of the AP-3 complex, SYD-2/Liprin-α acts with UNC-104 to instead facilitate the transport of SVp carriers containing lysosomal proteins. We further show that the mistrafficking of SVps into the dendrite in lrk-1 and apb-3 mutants depends on SYD-2, likely by regulating the recruitment of the AP-1/UNC-101. We propose that SYD-2 acts in concert with both the AP-1 and AP-3 complexes to ensure polarized trafficking of SVps.


Figures

Figure 1:
Figure 1:. Synaptic vesicle proteins travel with lysosomal proteins in heterogenous carriers
(A) Quantitation of co-transport of different combinations of synaptic vesicle proteins and lysosomal proteins from kymograph analysis of dual color imaging. The number of animals per genotype (N) ≥ 10. Number of vesicles analyzed (n) > 600. (B) Quantitation of fraction of different lysosomal proteins co-transporting different synaptic vesicle proteins from kymograph analysis of dual color imaging. N ≥ 10; n > 100. (C) Quantitation of fraction of CTNS-1-labelled compartments moving in the anterograde and retrograde direction in different mutants. N ≥ 9 per genotype; the number of CTNS-1-labelled compartments ≥ 20. (D) Quantitation of co-transport of CTNS-1::mCherry and mNeonGreen::RAB-7 in WT animals from sequential dual color imaging at 1.3 fps. CTNS-1 with RAB-7 indicates the fraction of CTNS-1-labelled compartments co-transporting RAB-7. RAB-7 with CTNS-1 indicates the fraction of RAB-7-labelled compartments co-transporting CTNS-1. N ≥ 15 animals; n > 450. (E) Schematic showing the PLM neuron. Red boxes highlight the regions of imaging. The arrow shows the anterograde direction of vesicle motion. (F) GFP::RAB-3, SNG-1::GFP, CTNS-1::mCherry, and RAB-7::mScarlet in the cell body, process and synapses of wildtype PLM neurons. Scale bar: 10 μm.
Figure 2:
Figure 2:. LRK-1 and AP-3 act in parallel and through SYD-2 to regulate lysosomal protein trafficking.
(A) Quantitation of co-transport of SNG-1::eGFP and mCherry::RAB-3 in WT, lrk-1(km17), and apb-3(ok429) from kymograph analysis of sequential dual color imaging at 1.3 frames per second (fps). # P-value ≤ 0.05 (One-Way ANOVA with Tukey’s post-hoc test, all comparisons to WT); ns: not significant; Number of animals (N) ≥ 15 per genotype; Number of vesicles analyzed per genotype (n) > 800. (B) Quantitation of fraction of SNG-1-carrying vesicles co-transporting CTNS-1 in WT, lrk-1(km17), lrk-1(km41), apb-3(ok429) and lrk-1(km17) apb-3(ok429), from kymograph analysis of sequential dual color imaging at 1.3 fps. # P-value ≤ 0.05 (Mann–Whitney Test); N ≥ 15 per genotype; n > 500. (C) Quantitation of fraction of SNG-1-carrying vesicles co-transporting RAB-7 from WT, lrk-1(km17), apb-3(ok429) and lrk-1(km17) apb-3(ok429), kymograph analysis of dual color imaging. # P-value ≤ 0.05 (One-Way ANOVA with Tukey’s post-hoc test, all comparisons to WT); ns: not significant; N ≥ 20 per genotype; n > 800. (D) CTNS-1::mCherry in the cell body, process, and synapses of PLM neurons of WT, lrk-1(km17), apb-3(ok429), and lrk-1(km17) apb-3(ok429). Scale bar: 10 μm. Red arrows point to some CTNS-1-labelled compartments. (E) mScarlet::RAB-7 in the cell body, process, and synapses of PLM neurons of WT, lrk-1(km17), apb-3(ok429), and lrk-1(km17) apb-3(ok429). Scale bar: 10 μm. Red arrows point to some RAB-7-labelled compartments. (F) LMP-1::mNeonGreen in the cell body, process, and synapses of PLM neurons of WT, lrk-1(km17), apb-3(ok429), and lrk-1(km17) apb-3(ok429). Scale bar: 10 μm. Red arrows point to some RAB-7-labelled compartments. (G) Images showing APB-3::GFP puncta in the head ganglion cell bodies of WT, lrk-1(km17), and syd-2(ok217). Scale bar: 10 μm. Red boxes highlight the regions of insets with cell bodies from images showing APB-3::GFP in (i) WT, (ii) lrk-1, and (iii) syd-2. (H) Quantitation of the number of APB-3::GFP puncta per cell body in WT, lrk-1(km17), and syd-2(ok217). # P-value ≤ 0.05 (Mann–Whitney Test); ns: not significant; N > 10 animals; n > 75 cell bodies. (I) Quantitation of intensity of APB-3::GFP puncta in cell bodies of WT, lrk-1(km17), and syd-2(ok217). The ratio of the intensity of APB-3::GFP puncta to cytosolic intensity in the cell body is plotted. # P-value ≤ 0.05 (Mann–Whitney Test); ns: not significant; N > 10 animals; n > 75 cell bodies. (J) Quantitation of average size of APB-3::GFP puncta per cell body in WT, lrk-1(km17), and syd-2(ok217). # P-value ≤ 0.05 (Mann–Whitney Test); ns: not significant; N > 10 animals; n > 75 cell bodies.
Figure 3:
Figure 3:. SV-lysosomes in lrk-1 and apb-3 mutants are dependent on UNC-104
(A) Schematic showing the PLM neuron. Red boxes highlight the regions of imaging. (B) SNG-1::GFP in the cell body, process, and synapses of PLM neurons showing dependence on UNC-104 in lrk-1(km17) and apb-3(ok429) mutants and their doubles with unc-104(e1265tb120). Scale bar: 10 μm. (C) CTNS-1::mCherry in the cell body, process, and synapses of PLM neurons showing dependence on UNC-104 in lrk-1(km17) and apb-3(ok429) mutants and their doubles with unc-104(e1265tb120). Red arrows highlight fainter CTNS-1 puncta. Scale bar: 10 μm. (D) Quantitation of co-transport of SNG-1 and CTNS-1 in unc-104(e1265tb120), lrk-1(km17); unc-104, and apb-3(ok429); unc-104 from kymograph analysis of sequential dual color imaging done at 1.3 fps. #P-value ≤ 0.05 (Mann–Whitney Test, all comparisons to WT); ns: not significant; Number of animals (N) ≥ 18 per genotype; Number of vesicles (n) > 1200.
Figure 4:
Figure 4:. Distribution of SV-lysosomal compartments depends on UNC-104
(A) Quantitation of co-transport of SNG-1 and CTNS-1 in syd-2 mutants and their doubles with lrk-1(km17) and apb-3(ok429), from kymograph analysis of dual color imaging. ok217 refers to the null allele of syd-2, syd-2(ok217); while ju37 refers to the syd-2(ju37) allele. #P-value ≤ 0.05 (Mann–Whitney Test, all comparisons to WT); ns: not significant; Number of animals (N) ≥ 18 per genotype; Number of vesicles (n) > 750. Values for lrk-1 and apb-3 single mutants are the same as those in Fig. 2B. (B) Quantitation of co-transport of SNG-1 and RAB-7 in syd-2(ok217) and its doubles with lrk-1(km17) and apb-3(ok429), from kymograph analysis of dual color sequential imaging at 1.3 fps. P-value > 0.05 (One-Way ANOVA with Tukey’s post-hoc test); ns: not significant; N ≥ 19 per genotype; n > 700. Values for lrk-1 and apb-3 single mutants are the same as those in Fig. 2C. (C) CTNS-1::mCherry in the cell body, process, and synapses of PLM neurons of syd-2(ok217) mutant and its doubles with lrk-1(km17) and apb-3(ok429). Red arrows highlight some CTNS-1-carrying compartments, some fainter. Scale bar: 10 μm. (D) mScarlet::RAB-7 in the cell body, process, and synapses of PLM neurons of syd-2(ok217) mutant and its doubles with lrk-1(km17) and apb-3(ok429). Red arrows highlight some RAB-7-carrying compartments, some fainter. Scale bar: 10 μm. (E) CTNS-1::mCherry in the cell body, process, and synapses of PLM neurons of syd-2(ju37) mutant and its doubles with lrk-1(km17) and apb-3(ok429). Red arrows highlight some CTNS-1-carrying compartments, some fainter. Scale bar: 10 μm. Imaged at 100×. (F) LMP-1::mNeonGreen in the cell body, process, and synapse of PLM neurons of syd-2(ok217) mutant and its doubles with lrk-1(km17) and apb-3(ok429). Red arrows indicate LMP-1-carrying compartments. Scale bar: 10 μm. (G) Quantitation of co-transport of SNB-1 and RAB-3, in syd-2(ok217), from simultaneous dual color imaging at 3 frames per second (fps). # P-value ≤ 0.05 (One-Way ANOVA with Tukey’s post-hoc test); N > 20. (H) Quantitation of co-transport of SNG-1 and RAB-3, in syd-2(ok217), from sequential dual color imaging at 1.3 fps. P-value > 0.05 (One-Way ANOVA with Tukey’s post-hoc test); ns: not significant; N > 15.
Figure 5:
Figure 5:. SYD-2 is required for UNC-104 dependent of SVp carriers
(A) Schematic of the PLM neuron. The red box highlights the region of imaging. (B) SNG-1::GFP in the cell body, process and synapses of PLM neurons of syd-2(ok217) and unc-104(e1265tb120), and their doubles with lrk-1(km17) and apb-3(ok429). Scale bar: 10 μm. (C) CTNS-1::mCherry in the cell body, process and synapses of PLM neurons of syd-2(ok217) and unc-104(e1265tb120), and their doubles with apb-3(ok429). Scale bar: 10 μm. (D) Quantitation of co-transport of SNG-1 and CTNS-1 in WT, unc-104(e1265tb120), syd-2(ok217), and unc-104; syd-2 from kymograph analysis of sequential dual color imaging at 1.3 fps. P-value > 0.05 (Mann–Whitney Test, all comparisons to WT); ns: not significant; Number of animals (N) > 20 for unc-104; syd-2; Number of vesicles (n) >1000.
Figure 6:
Figure 6:. SYD-2 and the AP-1 complex together regulate the polarized distribution of SVps to axons
(A) Schematic of the ASI chemosensory neuron. Red box highlights the region of imaging. (B) SNB-1::GFP in the dendrite of the ASI neuron of WT and two alleles of syd-2 and their doubles with lrk-1(km17) and apb-3(ok429). ok217 represents syd-2(ok217) allele. ju37 represents syd-2(ju37) allele. unc-101(m1) is a substitution mutation in the μ chain of the AP-1 complex causing a premature stop. Red arrows point to the SNB-1::GFP signal at the dendrite tip. Scale bar: 20 μm. Number of animals (N) > 6 per all single mutant genotypes; N > 20 for all double mutant genotypes. (C) CTNS-1::mCherry in the dendrite of the ASI neurons of WT, syd-2(ok217), lrk-1(km17), apb-3(ok429), unc-101(m1), and unc-101(m1); syd-2(ok217). Red arrows point to CTNS-1 compartments in the dendrite. Scale bar: 20 μm. N > 20 per genotype. (D) Density (number of CTNS-1 puncta per 10 μm in the ASI dendrite) of CTNS-1 in the ASI dendrite. # P-values ≤ 0.05 (Mann–Whitney Test, black comparisons against WT and blue comparisons against lrk-1); N > 20 for each genotype. (E) Schematic of C. elegans head showing the pharynx (red) and the head ganglion cell bodies (yellow). (F) Images showing UNC-101::GFP puncta in the head ganglion cell bodies of WT and syd-2(ok217). Scale bar: 10 μm. The red boxes highlight the regions of insets with cell bodies from images showing UNC-101::GFP in (i) WT and (ii) syd-2. (G) Quantitation of intensity of UNC-101::GFP puncta in the head ganglion cell bodies in WT and syd-2(ok217). The ratio of the intensity of UNC-101::GFP puncta to cytosolic intensity in the cell body is plotted. # P-value ≤ 0.05 (One-Way ANOVA with Tukey’s post-hoc test); N > 5 animals; n > 25 cell bodies. (H) Quantitation of average size of UNC-101::GFP puncta per cell body in WT and syd-2(ok217). # P-value ≤ 0.05 (Mann–Whitney Test); N > 5 animals; n > 25 cell bodies. (I) Images showing UNC-101::GFP puncta in the cell bodies of the ventral nerve cord neurons in WT and syd-2(ok217). Scale bar: 10 μm. The red boxes highlight the regions of insets with cell bodies from images showing UNC-101::GFP in (i) WT and (ii) syd-2. (J) Quantitation of intensity of UNC-101::GFP puncta in the cell bodies of the ventral nerve cord in WT and syd-2(ok217). The ratio of the intensity of UNC-101::GFP puncta to cytosolic intensity in the cell body is plotted. # P-value ≤ 0.05 (Mann–Whitney test); N > 5 animals; n > 10 cell bodies.

References

    1. Aravamudan B., Fergestad T., Davis W. S., Rodesch C. K. and Broadie K. (1999) ‘Drosophila UNC-13 is essential for synaptic transmission’, Nat Neurosci, 2(11), pp. 965–71. - PubMed
    1. Brenner S. (1974) ‘The genetics of Caenorhabditis elegans’, Genetics, 77(1), pp. 71–94. - PMC - PubMed
    1. Brockmann M. M., Zarebidaki F., Camacho M., Grauel M. K., Trimbuch T., Südhof T. C. and Rosenmund C. (2020) ‘A Trio of Active Zone Proteins Comprised of RIM-BPs, RIMs, and Munc13s Governs Neurotransmitter Release’, Cell Rep, 32(5), pp. 107960. - PubMed
    1. Brown H. M., Van Epps H. A., Goncharov A., Grant B. D. and Jin Y. (2009) ‘The JIP3 scaffold protein UNC-16 regulates RAB-5 dependent membrane trafficking at C. elegans synapses’, Dev Neurobiol, 69(2–3), pp. 174–90. - PMC - PubMed
    1. Bury L. A. D. and Sabo S. L. (2011) ‘Coordinated trafficking of synaptic vesicle and active zone proteins prior to synapse formation’, Neural Development, 6(1), pp. 24. - PMC - PubMed

Publication types