[Preprint]. 2023 Feb 23:2023.02.23.529767.
doi: 10.1101/2023.02.23.529767.

Integrating lipid metabolism, pheromone production and perception by Fruitless and Hepatocyte nuclear factor 4

Affiliations

Integrating lipid metabolism, pheromone production and perception by Fruitless and Hepatocyte nuclear factor 4

Jie Sun et al. bioRxiv. .

Update in

Abstract

Sexual attraction and perception, governed by separate genetic circuits in different organs, are crucial for mating and reproductive success, yet the mechanisms of how these two aspects are integrated remain unclear. In Drosophila , the male-specific isoform of Fruitless (Fru), Fru M , is known as a master neuro-regulator of innate courtship behavior to control perception of sex pheromones in sensory neurons. Here we show that the non-sex specific Fru isoform (Fru COM ) is necessary for pheromone biosynthesis in hepatocyte-like oenocytes for sexual attraction. Loss of Fru COM in oenocytes resulted in adults with reduced levels of the cuticular hydrocarbons (CHCs), including sex pheromones, and show altered sexual attraction and reduced cuticular hydrophobicity. We further identify Hepatocyte nuclear factor 4 ( Hnf4 ) as a key target of Fru COM in directing fatty acid conversion to hydrocarbons in adult oenocytes. fru - and Hnf4 -depletion disrupts lipid homeostasis, resulting in a novel sex-dimorphic CHC profile, which differs from doublesex - and transformer -dependent sexual dimorphism of the CHC profile. Thus, Fru couples pheromone perception and production in separate organs for precise coordination of chemosensory communication that ensures efficient mating behavior.

Teaser: Fruitless and lipid metabolism regulator HNF4 integrate pheromone biosynthesis and perception to ensure robust courtship behavior.


Conflict of interest statement

Competing interests: The authors declare that they have no competing interests.

Figures

Fig. 1.
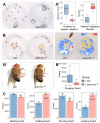
Fig. 1.. Loss of fru function in the nervous system or oenocytes alters male courtship behavior.
(A) Representative movie screenshots of fly groups with indicated genotypes. 13 male adults of the same genotype were collected and placed in one chamber. (B) Event maps generated from representative movies of indicated genotypes (1.5-min movie per map). (C) Polarized bar plots illustrating the ratio of each detected behavior. Each bar plot was generated from 8 independent biological replicates (10-min movie per replicate). (D) Rug plots showing the chaining events detected from 10min movies. X axis refers to the time of movie. Each vertical line with different color stands for the number of chaining events detected in a single frame. The corresponding color to the number of events is illustrated in the legend. The box plots of chaining index are quantitative statistics of 8 independent biological replicates. (E) Representative movie screenshots of pair-housed flies with indicated genotypes (black: active party; red: passive beheaded party; control: oeno-Gal4/+). The trajectory and behavioral classification of the active party are shown in F. The arrow indicates the head orientation of the active party flies. The color of the arrow indicates different behavior status (grey: resting/walking; blue: following; salmon: singing) (1.5-min movie per map). Bar plots with error bar are quantitative statistics of 10 min movies of 8 independent biological replicates in G. Data are represented as mean ± SEM. P values are calculated using one-way ANOVA (D) and two-tailed unpaired t-test (G) followed by Holm-Sidak multiple comparisons. n.s., not significant, *p<0.05, **p<0.01, ***p<0.001, ****p<0.0001.
Fig. 2.
Fig. 2.. Social behavior changes in flies with fru-depletion in oenocytes.
(A) Social space behavior. Left: representative images of an open field assay. Black circles indicate flies staying close together. (A’) Quantification of the distance of each fly to its nearest neighbor and the number of surrounding neighbors of each fly for both control (oeno-Gal4/+) and oeno>fruIR males (n = 8 groups of 13 flies for each genotype) (10-min movie per replicate). (B) Control (oeno-Gal4/+) and oeno>fruIR males were analyzed for total number of social interactions in a ‘competition-for-food’ assay. The heatmap on the right shows the degree to which flies gather in the food area. (B’) Measurement of solid food intake in adult using a dye tracer. (B”) Quantification of the total number of feeding times of the flies for control (oeno-Gal4/+) and oeno>fruIR males (n = 10 groups of 13 flies for each genotype) (10-min movie per replicate). (C) Locomotion activity of control (oeno-Gal4/+) and oeno>fruIR males was monitored. From left to right, bar plots show resting events, walking events, running events and jumping events of flies, respectively (n = 8 independent experiments with 13 flies per genotype). For all paradigms, data are represented as mean ± SEM. P values are calculated using one-way ANOVA followed by Holm-Sidak multiple comparisons. Asterisks illustrate statistically significant differences between conditions. n.s., not significant, *p<0.05, **p<0.01, ***p<0.001, ****p<0.0001.
Fig. 3.
Fig. 3.. Fru is required in the oenocytes for the biosynthesis of cuticular hydrocarbons.
(A) A schematic of cuticular hydrocarbon extraction and GC-MS analysis. (B) CHCs from adult male flies of each genotype were analyzed using GC-MS. Compared with the control and elav>fruIR males, oeno>fruIR males exhibit significantly lower levels of CHCs. (B’) The absolute contents of total hydrocarbons, male key pheromones (7-T and nC23) carried by a single male were calculated by the loading of internal standards. (C) CHCs from females of each genotype were analyzed using GC-MS. Compared to controls and elav>fruIR females, oeno>fruIR females exhibit lower levels of CHCs. (C’) The absolute contents of total hydrocarbons, female key pheromones (7,11-HD and 7,11-ND) carried by a single female were calculated by the loading of internal standards. Data are represented as mean ± SEM. P values are calculated using one-way ANOVA followed by Holm-Sidak multiple comparisons. Asterisks illustrate statistically significant differences between conditions. n.s., not significant, *p<0.05, **p<0.01, ***p<0.001, ****p<0.0001.
Fig. 4.
Fig. 4.. The fru gene locus and its expression in oenocytes.
(A) Schematic representation of the fru gene locus. Locations of four promoters (P1–P4), the exon-intron organization, and the P-element insertion sites of fruP1 and fruNP21 (green triangles) are shown. Filled and open boxes indicate coding and non-coding exons, respectively. A-E denote isoform-specific exons for types A-E. The start and termination codons are also shown. The regions containing epitopes for the anti-Fru antibodies are indicated. fru gRNA and fru dsRNA sites are displayed. (B and C) Anti-Fru antibodies were used to stain oenocytes, from wild-type flies and overexpression of FruM/FruCOM or knockdown of Fru (all isoforms) in oenocytes. (D) Validation of the effectiveness of fru mutant clones by anti-FruCOM staining in oenocytes. (E and F) fru-P1-Gal4 inserted into the first intron and fru-NP21-Gal4 inserted into the second intron of fru, driving UAS-GFP as a reporter to mark the transcriptional level of fru in oenocytes.
Fig. 5.
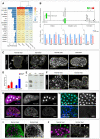
Fig. 5.. Fru controls HNF4 expression in the oenocytes to inhibit steatosis.
(A) Downregulation of VLCFA/hydrocarbon biosynthesis genes in oenocytes with fru-knockdown from two independent replicates. Colors in the heatmap correspond to the scaled FPKM which is shown as a number in each cell. (B) The FA synthesis & elongation pathway from KEGG, with green boxes indicating genes down-regulated in this subset, and RT-qPCR analysis of genes in the VLCFA/hydrocarbon metabolic pathway (controls: blue bars; oeno>fruIR: salmon bars). Transcript levels are normalized to Rp49 mRNA and presented relative to the level of controls. Asterisks illustrate statistically significant differences between conditions. n.s., not significant, *p<0.05, **p<0.01, ***p<0.001. (C) Bodipy stains are depicted for oenocytes dissected from control and oeno>fruIR males raised on standard diet and starved for 7-day after emergence. Oenocytes are outlined with a yellow dotted line. (D) Triglyceride levels were measured in 7-day old control and oeno>fruIR reared on a standard diet after emergence. Metabolite levels are normalized to total protein and presented relative to the amount in control animals. Red indicates that decapitated whole body was used as the sample material, and blue indicates that only adipose tissue (fat body and oenocytes) was used. (E) TLC analysis shows TAG and FFA levels in adipose tissue of control and oeno>fruIR males. (F) NileRed stains are depicted for oenocytes dissected from fru mutant clones and oeno>fruIR+fruOE males cultured on standard diet. (G) fru-knockdown in oenocytes resulted in decreased HNF4 protein levels. Upper panel, Fru (magenta) colocalized with HNF4 (yellow) in control oenocytes. Lower panel, the level of HNF4 was significantly reduced in oenocytes of fru-knockdown. (H) GFP-tagged HNF4 from the endogenous Hnf4 promoter is highly expressed in oenocytes, but the GFP signal is lost in oenocytes with fru-knockdown. (I) Bodipy (green) and anti-HNF4 (magenta) stain are depicted for oenocytes dissected from oeno>Hnf4IR males raised on standard diet. (J) Bodipy stains are depicted for oenocytes of oeno>fruIR+Hnf4OE males cultured on standard diet.
Fig. 6.
Fig. 6.. Fru controls HNF4 expression in the oenocytes to maintain CHC biosynthesis and innate courtship behavior.
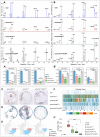
(A) GC-MS analysis of CHCs from male adults in oeno>Hnf4IR and oeno>fruIR+Hnf4OE. (A’) The absolute contents of total hydrocarbons, male key pheromones (7-T and nC23) carried by a single male were calculated by the loading of internal standards. (B) GC-MS analysis of CHCs from female adults of controls (oeno-Gal4/+), oeno>fruIR, oeno>Hnf4IR and oeno>fruIR+Hnf4OE females. (B’) The absolute contents of total hydrocarbons, female key pheromones (7,11-HD and 7,11-ND) carried by a single female were calculated by the loading of internal standards. Data are represented as mean ± SEM. P values are calculated using one-way ANOVA followed by Holm-Sidak multiple comparisons. Asterisks illustrate statistically significant differences between conditions. n.s., not significant, *p<0.05, **p<0.01, ***p<0.001, ****p<0.0001. (C) Representative movie screenshots of fly groups with indicated genotypes. 13 male adults of the same genotype were collected and placed in one chamber. (D) Event maps generated from representative movies of indicated genotypes (1.5-min movie per map). (E) Polarized bar plots illustrating the ratio of each detected behavior. Each bar plot was produced from 8 independent biological replicates (10-min movie per replicate). (F) Rug plots showing the chaining events detected from 10-min movies. X axis refers to the time of movie. Each vertical line with different color indicates the number of chaining events detected in a single frame. The corresponding color to the number of events is illustrated in the legend. (F’) The box plots of chaining index are quantitative statistics of 8 independent biological replicates.
Fig. 7.
Fig. 7.. Fru does not act downstream of Dsx in regulating CHC biosynthesis.
(A) Silencing of of dsx in oenocytes causes male chaining behavior. (B) Immunostaining shows that FruCOM and HNF4 protein levels remain high in oenocytes with dsx-knockdown. (C) CHCs from males of each genotype were analyzed using GC-MS. oeno>fruIR males exhibit significantly lower levels of CHCs in the full spectrum than the controls. The CHCs of oeno>dsxIR males, in contrast, exhibit a mixture of low-levels of characteristic male hydrocarbons (7-T) and high-levels of diene hydrocarbons (7,11-HD and 7,11-ND, characteristic of females). (D) GC-MS analysis of CHCs in female adults shows that oenocyte-specific knockdown (oeno>fruIR) resulted in lower levels of CHCs in the full spectrum than control females. However, knockdown of dsx in female oenocytes (oeno>dsxIR) resulted in lower female pheromones (diene hydrocarbons 7,11-HD and 7,11-ND) but high levels of male pheromone (7-T). Data are represented as mean ± SEM. P values are calculated using one-way ANOVA followed by Holm-Sidak multiple comparisons. Asterisks illustrate statistically significant differences between conditions. n.s., not significant, *p<0.05, **p<0.01, ***p<0.001, ****p<0.0001.
Fig. 8.
Fig. 8.. Model of fruitless regulates pheromone biosynthesis and perception.
A schematic drawing to show that Fru regulates both pheromone production and perception through different isoforms (the male-specific FruM and the non-sex-specific FruCOM) expressed in different organs, thereby promoting the robustness and efficiency of courtship behavior. FruCOM expression in oenocytes regulates HNF4 protein levels for the biosynthesis of sex pheromones, along with other cuticle hydrocarbons required for desiccation resistance.

Similar articles

References

    1. Khallaf M. A. et al., Large-scale characterization of sex pheromone communication systems in Drosophila. Nature Communications 12, (2021). - PMC - PubMed
    1. Wyatt T. D., Pheromones and signature mixtures: defining species-wide signals and variable cues for identity in both invertebrates and vertebrates. Journal of Comparative Physiology A 196, 685–700 (2010). - PubMed
    1. Toolson E. C., Effects of rearing temperature on cuticle permeability and epicuticular lipid composition in Drosophila pseudoobscura. Journal of Experimental Zoology 222, 249–253 (1982).
    1. Lockey K. H., Lipids of the insect cuticle: origin, composition and function. Comparative Biochemistry and Physiology Part B: Comparative Biochemistry 89, 595–645 (1988).
    1. Rouault J.-D., Marican C., Wicker-Thomas C., Jallon J.-M., in Drosophila melanogaster, Drosophila simulans: So Similar, So Different. (Springer, 2004), pp. 195–212. - PubMed

Publication types