[Preprint]. 2024 Sep 20:2023.02.22.23286310.
doi: 10.1101/2023.02.22.23286310.

Exome sequencing of 20,979 individuals with epilepsy reveals shared and distinct ultra-rare genetic risk across disorder subtypes

Siwei Chen  1   2   3 Bassel W Abou-Khalil  4 Zaid Afawi  5 Quratulain Zulfiqar Ali  6 Elisabetta Amadori  7 Alison Anderson  8   9 Joe Anderson  10 Danielle M Andrade  6 Grazia Annesi  11 Mutluay Arslan  12 Pauls Auce  13 Melanie Bahlo  14   15 Mark D Baker  16 Ganna Balagura  17 Simona Balestrini  18   19 Eric Banks  20 Carmen Barba  21 Karen Barboza  6 Fabrice Bartolomei  22 Nick Bass  23 Larry W Baum  24 Tobias H Baumgartner  25 Betül Baykan  26 Nerses Bebek  27   28 Felicitas Becker  29   30 Caitlin A Bennett  31 Ahmad Beydoun  32 Claudia Bianchini  21 Francesca Bisulli  33   34 Douglas Blackwood  35 Ilan Blatt  5   36 Ingo Borggräfe  37 Christian Bosselmann  29 Vera Braatz  18   19 Harrison Brand  2   38   39 Knut Brockmann  40 Russell J Buono  41   42   43 Robyn M Busch  44   45   46 S Hande Caglayan  47 Laura Canafoglia  48 Christina Canavati  49 Barbara Castellotti  50 Gianpiero L Cavalleri  51   52 Felecia Cerrato  1 Francine Chassoux  53 Christina Cherian  54 Stacey S Cherny  55 Ching-Lung Cheung  56 I-Jun Chou  57 Seo-Kyung Chung  16   58   59 Claire Churchhouse  1   2   3 Valentina Ciullo  60   61 Peggy O Clark  62 Andrew J Cole  63 Mahgenn Cosico  41   64 Patrick Cossette  65 Chris Cotsapas  66 Caroline Cusick  1 Mark J Daly  1   2   3   67 Lea K Davis  68   69   70   71 Peter De Jonghe  72   73   74 Norman Delanty  51   52   75 Dieter Dennig  76 Chantal Depondt  77 Philippe Derambure  78 Orrin Devinsky  79 Lidia Di Vito  34 Faith Dickerson  80 Dennis J Dlugos  41   81 Viola Doccini  21 Colin P Doherty  52   82 Hany El-Naggar  52   75 Colin A Ellis  83 Leon Epstein  84 Meghan Evans  85 Annika Faucon  86 Yen-Chen Anne Feng  1   2   87   88   89 Lisa Ferguson  45 Thomas N Ferraro  42   90 Izabela Ferreira Da Silva  91 Lorenzo Ferri  33   34 Martha Feucht  92 Madeline C Fields  93 Mark Fitzgerald  41   64   83 Beata Fonferko-Shadrach  16 Francesco Fortunato  94 Silvana Franceschetti  95 Jacqueline A French  79 Elena Freri  96 Jack M Fu  2   38   39 Stacey Gabriel  2 Monica Gagliardi  11 Antonio Gambardella  94 Laura Gauthier  20 Tania Giangregorio  97 Tommaso Gili  60   98 Tracy A Glauser  62 Ethan Goldberg  41   64 Alica Goldman  99 David B Goldstein  100 Tiziana Granata  96 Riley Grant  2 David A Greenberg  101 Renzo Guerrini  21   102 Aslı Gundogdu-Eken  47 Namrata Gupta  2 Kevin Haas  4 Hakon Hakonarson  41 Garen Haryanyan  26 Martin Häusler  103 Manu Hegde  104 Erin L Heinzen  105 Ingo Helbig  41   64   83   106   107   108 Christian Hengsbach  29 Henrike Heyne  2   109 Shinichi Hirose  110 Edouard Hirsch  111 Chen-Jui Ho  112 Olivia Hoeper  31 Daniel P Howrigan  1   2   3 Donald Hucks  68   71 Po-Chen Hung  57 Michele Iacomino  7 Yushi Inoue  113 Luciana Midori Inuzuka  114   115 Atsushi Ishii  116 Lara Jehi  45   46 Michael R Johnson  117 Mandy Johnstone  35 Reetta Kälviäinen  118   119 Moien Kanaan  49 Bulent Kara  120 Symon M Kariuki  121   122   123 Josua Kegele  29 Yeşim Kesim  26 Nathalie Khoueiry-Zgheib  124 Jean Khoury  45   46 Chontelle King  85 Karl Martin Klein  54   125   126   127   128   129   130 Gerhard Kluger  131   132 Susanne Knake  130   133 Fernando Kok  115   134 Amos D Korczyn  5 Rudolf Korinthenberg  135 Andreas Koupparis  136 Ioanna Kousiappa  136 Roland Krause  91 Martin Krenn  137 Heinz Krestel  66   138 Ilona Krey  139 Wolfram S Kunz  25   140 Gerhard Kurlemann  141 Ruben I Kuzniecky  142 Patrick Kwan  8   9   143 Maite La Vega-Talbott  93 Angelo Labate  144 Austin Lacey  51   52 Dennis Lal  44   45 Petra Laššuthová  145 Stephan Lauxmann  29 Charlotte Lawthom  10   16 Stephanie L Leech  31 Anna-Elina Lehesjoki  146   147 Johannes R Lemke  139 Holger Lerche  29 Gaetan Lesca  148 Costin Leu  18   44 Naomi Lewin  41   64 David Lewis-Smith  41   108   149   150 Gloria Hoi-Yee Li  151 Calwing Liao  1   2   3   38 Laura Licchetta  34 Chih-Hsiang Lin  112 Kuang-Lin Lin  57 Tarja Linnankivi  152   153   154 Warren Lo  155 Daniel H Lowenstein  104 Chelsea Lowther  2   38   39 Laura Lubbers  156 Colin H T Lui  157 Lucia Inês Macedo-Souza  158 Rene Madeleyn  159 Francesca Madia  7 Stefania Magri  160 Louis Maillard  161 Lara Marcuse  93 Paula Marques  6 Anthony G Marson  162 Abigail G Matthews  163 Patrick May  91 Thomas Mayer  164 Wendy McArdle  165 Steven M McCarroll  1   2   166 Patricia McGoldrick  93   167 Christopher M McGraw  63 Andrew McIntosh  35 Andrew McQuillan  23 Kimford J Meador  168 Davide Mei  21 Véronique Michel  169 John J Millichap  170 Raffaella Minardi  34 Martino Montomoli  21 Barbara Mostacci  34 Lorenzo Muccioli  33 Hiltrud Muhle  106 Karen Müller-Schlüter  171 Imad M Najm  45   46 Wassim Nasreddine  32 Samuel Neaves  165   172 Bernd A Neubauer  173 Charles R J C Newton  121   122   123   174 Jeffrey L Noebels  99 Kate Northstone  165 Sam Novod  20 Terence J O'Brien  8   9 Seth Owusu-Agyei  175   176 Çiğdem Özkara  177 Aarno Palotie  1   3   63   87   178 Savvas S Papacostas  136 Elena Parrini  21   102 Carlos Pato  179   180 Michele Pato  179   180 Manuela Pendziwiat  106   107 Page B Pennell  181 Slavé Petrovski  8   182 William O Pickrell  16   183 Rebecca Pinsky  184 Dalila Pinto  185   186 Tommaso Pippucci  97 Fabrizio Piras  60 Federica Piras  60 Annapurna Poduri  184 Federica Pondrelli  33 Danielle Posthuma  187 Robert H W Powell  16   183 Michael Privitera  188 Annika Rademacher  106 Francesca Ragona  96 Byron Ramirez-Hamouz  185   186 Sarah Rau  29 Hillary R Raynes  93 Mark I Rees  16   59 Brigid M Regan  31 Andreas Reif  189   190 Eva Reinthaler  137 Sylvain Rheims  191   192 Susan M Ring  165   172 Antonella Riva  7   17 Enrique Rojas  84 Felix Rosenow  129   130   133 Philippe Ryvlin  193 Anni Saarela  118   119 Lynette G Sadleir  85 Barış Salman  28 Andrea Salmon  54 Vincenzo Salpietro  7 Ilaria Sammarra  11 Marcello Scala  7   17 Steven Schachter  194 André Schaller  195 Christoph J Schankin  138   196 Ingrid E Scheffer  31   197   198 Natascha Schneider  18   19 Susanne Schubert-Bast  129   130   199 Andreas Schulze-Bonhage  200 Paolo Scudieri  7   17 Lucie Sedláčková  145 Catherine Shain  184 Pak C Sham  24 Beth R Shiedley  184 S Anthony Siena  201 Graeme J Sills  202 Sanjay M Sisodiya  18   19 Jordan W Smoller  203   204 Matthew Solomonson  2   88 Gianfranco Spalletta  60   205 Kathryn R Sparks  84 Michael R Sperling  206 Hannah Stamberger  72   73   74 Bernhard J Steinhoff  207 Ulrich Stephani  106 Katalin Štěrbová  145 William C Stewart  101 Carlotta Stipa  34 Pasquale Striano  7   17 Adam Strzelczyk  129   130   133 Rainer Surges  25 Toshimitsu Suzuki  208   209 Mariagrazia Talarico  11 Michael E Talkowski  2   38   39 Randip S Taneja  4 George A Tanteles  136 Oskari Timonen  119 Nicholas John Timpson  165   172 Paolo Tinuper  33   34 Marian Todaro  8   9 Pınar Topaloglu  27 Meng-Han Tsai  112 Birute Tumiene  210   211 Dilsad Turkdogan  212 Sibel Uğur-İşeri  28 Algirdas Utkus  210   211 Priya Vaidiswaran  41   64 Luc Valton  213 Andreas van Baalen  106 Maria Stella Vari  7 Annalisa Vetro  21 Markéta Vlčková  145 Sophie von Brauchitsch  129   130   133 Sarah von Spiczak  106   214 Ryan G Wagner  215   216   217 Nick Watts  2   88 Yvonne G Weber  29   218 Sarah Weckhuysen  72   73   74 Peter Widdess-Walsh  51   52   75 Samuel Wiebe  54   125   127   219   220 Steven M Wolf  93   167 Markus Wolff  221 Stefan Wolking  29   218 Isaac Wong  2   38 Randi von Wrede  25 David Wu  86 Kazuhiro Yamakawa  208   209 Zuhal Yapıcı  27 Uluc Yis  222 Robert Yolken  223 Emrah Yücesan  224 Sara Zagaglia  18   19 Felix Zahnert  130   133 Federico Zara  7   17 Fritz Zimprich  137 Milena Zizovic  91 Gábor Zsurka  25   140 Benjamin M Neale  1   2   3 Samuel F Berkovic  31
Affiliations

Exome sequencing of 20,979 individuals with epilepsy reveals shared and distinct ultra-rare genetic risk across disorder subtypes

Siwei Chen et al. medRxiv. .

Update in

Abstract

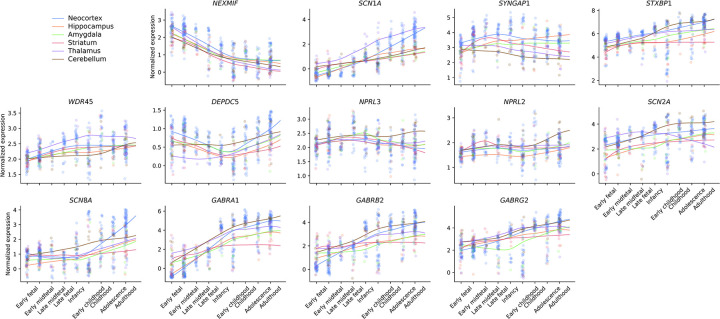
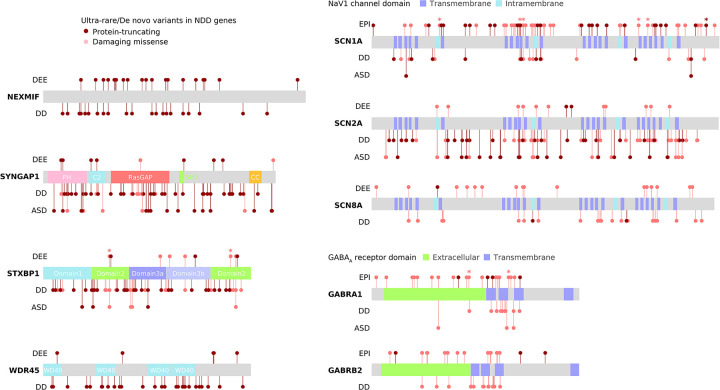
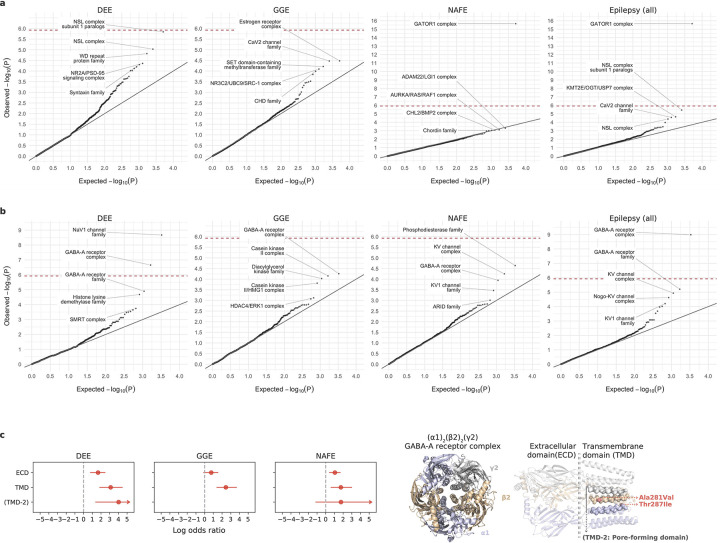
Identifying genetic risk factors for highly heterogeneous disorders like epilepsy remains challenging. Here, we present the largest whole-exome sequencing study of epilepsy to date, with >54,000 human exomes, comprising 20,979 deeply phenotyped patients from multiple genetic ancestry groups with diverse epilepsy subtypes and 33,444 controls, to investigate rare variants that confer disease risk. These analyses implicate seven individual genes, three gene sets, and four copy number variants at exome-wide significance. Genes encoding ion channels show strong association with multiple epilepsy subtypes, including epileptic encephalopathies, generalized and focal epilepsies, while most other gene discoveries are subtype-specific, highlighting distinct genetic contributions to different epilepsies. Combining results from rare single nucleotide/short indel-, copy number-, and common variants, we offer an expanded view of the genetic architecture of epilepsy, with growing evidence of convergence among different genetic risk loci on the same genes. Top candidate genes are enriched for roles in synaptic transmission and neuronal excitability, particularly postnatally and in the neocortex. We also identify shared rare variant risk between epilepsy and other neurodevelopmental disorders. Our data can be accessed via an interactive browser, hopefully facilitating diagnostic efforts and accelerating the development of follow-up studies.


Conflict of interest statement

Competing Interests B.M.N is a member of the scientific advisory board at Deep Genomics and Neumora. No other authors have competing interests to declare

Figures

Extended Data Fig. 1:
Results from burden analysis of synonymous URVs. a,b, Burden of synonymous URVs at the individual-gene (a) and the gene-set (b) level. The observed −log10-transformed P values are plotted against the expectation given a uniform distribution. Burden analyses are performed across four epilepsy groups – 1,938 DEEs, 5,499 GGE, 9,219 NAFE, and 20,979 epilepsy-affected individuals combined – versus 33,444 controls. P values are computed using a Firth logistic regression model testing the association between the case-control status and the number of URVs (two-sided); the red dashed line indicates exome-wide significance P=3.4×10⁻⁷ after Bonferroni correction (see Methods).
Extended Data Fig. 2:
Spatiotemporal expression of 13 exome-wide significant genes in the human brain. Expression values (log2[TPM+1]) are normalized to the mean for each BrainSpan sample; each dot represents the expression value of a particular gene in a sample collected in a particular brain region and developmental time (from early fetal to adulthood: N=47/5/5/9/5/4, 69/6/6/7/5/4, 19/2/1/2/1/2, 27/2/2/2/2/3, 30/2/3/2/3/3, 41/3/4/3/4/5, 30/3/3/1/1/3, 36/3/3/2/2/4, and 63/6/6/6/6/6 neocortex/hippocampus/amygdala/striatum/thalamus/cerebellum samples, respectively). LOESS smooth curves are plotted for each brain region across developmental time.
Extended Data Fig. 3:
Distributions of URVs from this study and de novo variants from other NDD studies on the same genes. Schematic protein plots of nine genes that are significant in both our epilepsy cohort (DEE: developmental and epileptic encephalopathy; EPI: all-epilepsy combined) and previous large-scale WES studies of severe developmental disorders (DD) and/or autism spectrum disorder (ASD) are shown. Asterisk indicates recurring URVs in epilepsy; recurring de novo variants in DD/ASD as well as detailed variant information are provided in Supplementary Data 13.
Extended Data Fig. 4:
Results from genetic ancestry- and sex-specific burden analyses. a, The numbers of epilepsy cases (orange) and controls (blue) by genetic ancestry. b, Comparison of protein-truncating (left) and damaging missense (right) URV burden in the top ten genes from the primary analysis (“All”) across genetic ancestry subgroups. Red color indicates enrichment in cases (log[OR]>1), with an asterisk indicating nominal significance (P≤0.05; see Supplementary Data 14 for exact P values). P values are computed using a Firth logistic regression model testing the association between the case-control status and the number of URVs (two-sided). c, Genetic ancestry-specific burden of URVs in established epilepsy genes (N=171 curated by the Genetic Epilepsy Syndromes [GMS] panel with a known monogenic/X-linked cause), constrained genes (N=1,917 scored by the loss-of-function observed/expected upper bound fraction [LOEUF] metric as the most constrained 10% genes), and constrained genes excluding established epilepsy genes (N=1,813). Overall, different ancestral groups show at least partially shared burden of deleterious URVs in these gene sets. In a-c, NFE: Non-Finnish European (Ncase=16,040, Ncontrol=25,641), AFR: African (Ncase=1,598, Ncontrol=2,592), AMR: Ad Mixed American (Ncase=480, Ncontrol=3,106), EAS: East Asian (Ncase=1,698, Ncontrol=1,215), FIN: Finnish (Ncase=926, Ncontrol=537), SAS: South Asian (Ncase=237, Ncontrol=353). d, Sex-specific burden of URVs in established epilepsy genes. Burden analyses are performed for three gene sets described in c, with an additional set of 37 X-linked GMS epilepsy genes, across four epilepsy groups (female: NDEE=811, NGGE=4,807, NNAFE=3,511, NEPI(all)=11,372, Ncontrol=18,144; male: NDEE=997, NGGE=2,579, NNAFE=4,395, NEPI(all)=10,397, Ncontrol=15,302). There is an overall trend of shared URV burden between female and male subgroups in these gene sets. In c and d, the dot represents the log odds ratio and the error bars represent the 95% confidence intervals of the point estimates. For presentation purposes, error bars that exceed a large log odds ratio value are capped, indicated by arrows at the end of the error bars (see Supplementary Data 14 and 15 for exact values). e, Comparison of sex-specific burden of protein-truncating URVs at level of the individual genes. For each gene, the −log10-transformed P value from the female subgroup analysis (y-axis) is plotted against that from the male subgroup analysis (x-axis). Top ten genes with URV burden in epilepsy are labeled for each subgroup, with genes on the sex chromosomes colored in blue. The red dashed line indicates exome-wide significance P=3.4×10⁻⁷ after Bonferroni correction.
Extended Data Fig. 5:
Results from burden analysis of protein-truncating and damaging missense URVs combined. a, Joint burden of protein-truncating and damaging missense URVs at the individual-gene level. The observed −log10-transformed P values are plotted against the expectation given a uniform distribution. Burden analyses are performed across four epilepsy groups – 1,938 DEEs, 5,499 GGE, 9,219 NAFE, and 20,979 epilepsy-affected individuals combined – versus 33,444 controls. P values are computed using a Firth logistic regression model testing the association between the case-control status and the number of URVs (two-sided); the red dashed line indicates exome-wide significance P=3.4×10⁻⁷ after Bonferroni correction (see Methods). b, Comparison of the joint burden in a with the burden of protein-truncating URVs. The odds ratio (OR) of protein-truncating plus damaging missense URVs (y-axis) and that of protein-truncating URVs alone (x-axis) are compared. Each dot represents a gene with significant enrichment (OR>0 and P≤0.05) of either protein-truncating URVs or the two variant classes combined.
Extended Data Fig. 6:
URV discovery and burden results across Epi25 data collection. a, Increase in the number of protein-truncating and damaging missense URVs discovered in epilepsy genes with a known monogenic cause. b, Increase in the number of monogenic epilepsy genes identified with a protein-truncating or damaging missense URV. In a and b, variant/gene count is plotted against the year of Epi25 data collection; the total number of epilepsy cases analyzed in each year is indicated in parenthesis. c, URV burden of previously top-ranked genes in this study. The odds ratio of protein-truncating URVs in genes from this study (y-axis) and the prior Epi25 publication (x-axis) are compared. Each dot represents one of the top ten genes implicated by our previous burden analysis (across three epilepsy subtypes). Genes with a known monogenic/X-linked cause are labeled and colored in purple. d, Increase in the total, non-European ancestry, and effective sample size in this study over our previous publications. The effective sample size is computed as 4/(1/Ncase+1/Ncontrol). e,f, The sample size required for well-powered gene burden testing. The percentage of genes powered to detect significant URV burden (Fisher’s exact P ≤0.05) at different effect sizes (e) and case:control ratios (f) is shown as a function of log-scaled sample size of epilepsy cases. Lighter color indicates smaller effect size (weaker burden), which requires a larger sample size to detect. The gray vertical line indicates the current sample size of 20,979 cases. In e, horizontal lines indicate 80% and 50% detection power, and vertical dashed lines indicate the estimated number of cases required to achieve 80% at the benchmarked effective sizes. In f, dashed and dotted curves indicate power estimation with increased control:case ratios from 1.6 (in this study) to 3.2 and 6.4, respectively; horizontal lines indicate the estimated power achieved by doubling and quadrupling the number of controls at the current sample size of cases. g, Epilepsy subtype-specific burden of URVs in established epilepsy genes (N=171 curated by the Genetic Epilepsy Syndromes [GMS] panel with a known monogenic/X-linked cause), constrained genes (N=1,917 scored by the loss-of-function observed/expected upper bound fraction [LOEUF] metric as the most constrained 10% genes), and constrained genes excluding established epilepsy genes (N=1,813). Burden analyses are performed across three epilepsy subtypes – 1,938 DEEs, 5,499 GGE, and 9,219 NAFE – versus 33,444 controls. Protein-truncating and damaging missense URVs from DEEs exhibit the strongest enrichment in epilepsy panel genes, while all epilepsy subtypes show significant enrichment in constrained genes even after excluding the panel genes. No enrichment is observed for synonymous URVs. The dot represents the log odds ratio and the error bars represent the 95% confidence intervals of the point estimates.
Fig. 1:
Fig. 1:
Results from gene-based burden analysis of URVs. a,b, Burden of protein-truncating (a) and damaging missense (b) URVs in each protein-coding gene with at least one epilepsy or control carrier. The observed −log10-transformed P values are plotted against the expectation given a uniform distribution. For each variant class, burden analyses are performed across four epilepsy groups – 1,938 DEEs, 5,499 GGE, 9,219 NAFE, and 20,979 epilepsy-affected individuals combined – versus 33,444 controls. P values are computed using a Firth logistic regression model testing the association between the case-control status and the number of URVs (two-sided); the red dashed line indicates exome-wide significance P=3.4×10⁻⁷ after Bonferroni correction (see Methods). Top ten genes with URV burden in epilepsy are labeled.
Fig. 2:
Fig. 2:
Results from gene-set-based burden analysis of URVs. a,b, Burden of protein-truncating (a) and damaging missense (b) URVs in each gene set (gene family/protein complex) with at least one epilepsy or control carrier. The observed −log10-transformed P values are plotted against the expectation given a uniform distribution. For each variant class, burden analyses are performed across four epilepsy groups – 1,938 DEEs, 5,499 GGE, 9,219 NAFE, and 20,979 epilepsy-affected individuals combined – versus 33,444 controls. P values are computed using a Firth logistic regression model testing the association between the case-control status and the number of URVs (two-sided); the red dashed line indicates exome-wide significance P=1.2×10⁻⁶ after Bonferroni correction (see Methods). Top five gene sets with URV burden in epilepsy are labeled. c, Burden of damaging missense URVs in the (α1)2(β2)2(γ2) GABAA receptor complex with respect to its structural domain. Left, forest plots showing the stronger enrichment of damaging missense URVs in the transmembrane domain (TMD) than the extracellular domain (ECD), and the unique signal from DEEs in the second TMD (TMD-2) that forms the ion channel pore. The dot represents the log odds ratio and the error bars represent the 95% confidence intervals of the point estimates. For presentation purposes, error bars that exceed a log odds ratio of 5 are capped, indicated by arrows at the end of the error bars (see Supplementary Data 6 for exact values). Right, a co-crystal structure (PDB ID: 6X3Z) showing the pentameric subunits of the receptor and highlighting the two protein-truncating URVs from DEEs located in the pore-forming domain.
Fig. 3:
Fig. 3:
Protein structural analysis of missense URVs in ion channel genes. a, Correlation between ddG and MPC in measuring the deleteriousness of missense URVs. A higher absolute ddG value suggests a more deleterious effect on protein stability; positive (orange) and negative (blue) values suggest destabilizing and stabilizing effects, respectively. Box plots show the distribution of ddG values across different MPC ranges (blue boxes: N=232, 272, and 242 for MPC<1, 1≤MPC<2, and MPC≥2, respectively; orange boxes: N=327, 397, and 342 or MPC<1, 1≤MPC<2, and MPC≥2, respectively). The center line represents the median (50th percentile) and the bounds of the box indicate the 25th and 75th percentiles, with the whiskers extending to the minimum and maximum values within 1.5 times the interquartile range from the lower and upper quartiles, respectively. b, Burden of damaging missense URVs stratified by ddG. Stronger enrichment is observed when applying |ddG|≥1 to further prioritize damaging missense URVs with MPC≥2. c, Burden and distribution of destabilizing (ddG≥1) and stabilizing (ddG≤−1) missense URVs on the (α1)2(β2)2(γ2) GABAA receptor complex with respect to its structural domain. Top, forest plots showing the stronger enrichment of destabilizing missense URVs (orange) in the extracellular domain (ECD) and stabilizing missense URVs (blue) in the transmembrane domain (TMD). Bottom, schematic plots displaying the distribution of destabilizing and stabilizing missense URVs on GABAA receptor proteins. URVs found in epilepsy cases are plotted above the protein and those from controls are plotted below the protein. The number of epilepsy and control carriers are listed in the table above. In b and c, burden analyses are performed across four epilepsy groups – 1,938 DEEs, 5,499 GGE, 9,219 NAFE, and 20,979 epilepsy-affected individuals combined – versus 33,444 controls. The dot represents the log odds ratio and the error bars represent the 95% confidence intervals of the point estimates.
Fig. 4:
Fig. 4:
Convergence of CNV deletions and protein-truncating URVs in gene-based burden. a, Joint burden of CNV deletions and protein-truncating URVs in each protein-coding gene with at least one epilepsy or control carrier. The observed −log10-transformed P values are plotted against the expectation given a uniform distribution. Joint burden analyses are performed on the subset of samples that passed CNV calling QC (see Methods), across four epilepsy groups – 1,743 DEEs, 4,980 GGE, 8,425 NAFE, and 18,963 epilepsy-affected individuals combined – versus 29,804controls; for genes that do not have a CNV deletion called, results from the burden analysis of protein-truncating URVs on the full sample set are shown. P values are computed using a Firth logistic regression model testing the association between the case-control status and the number of URVs (two-sided); the red dashed line indicates exome-wide significance P=3.4×10⁻⁷ after Bonferroni correction (see Methods). Top ten genes with variant burden in epilepsy are labeled. b, Joint burden of CNV deletions and protein-truncating URVs in the top ten genes ranked by protein-truncating URV burden. Only genes affected by both variant types with enrichment in epilepsy (log[OR]>0) are show. For comparison, the burden of protein-truncating URVs (SNVs/indels; red), CNV deletions (gray), and the joint (purple) are analyzed on the same sample subset as described in a. The dot represents the log odds ratio and the error bars represent the 95% confidence intervals of the point estimates. For presentation purposes, error bars that exceed a log odds ratio of 5 are capped, indicated by arrows at the end of the error bars (see Supplementary Data 10 for exact values). c, Genomic location and distribution of CNV deletions and protein-truncating URVs with respect to the NPRL3 and DEPDC5 genes. Variants found in epilepsy cases (red) are plotted above the schematic gene plots and those from controls (gray) are plotted below the gene. The number of epilepsy and control carriers are listed in the table above. P values are computed using a Firth logistic regression model testing the association between the case-control status and the number of URVs (two-sided).
Fig. 5:
Fig. 5:
Epilepsy genetic architecture from large-scale genetic association studies. a, An allelic spectrum of epilepsy genetic risk loci. Significant risk loci identified by large-scale WES and GWA studies are shown. The odds ratio of each risk loci (y-axis) is plotted against the minor allele frequency in the general population (gnomAD non-neuro subset, x-axis); for individual genes, the cumulative allele frequency (CAF) is computed, and for gene sets, the CAF is averaged over gene members. The color and size of each dot represent the variant class and effect size (odds ratio) of the genetic association. Bold indicates convergent findings between different variant classes. The shaded area represents the upper and lower 95% confidence intervals of the point estimates, fitted by exponential curves. b, Burden of URVs in genes implicated by GWAS loci. Significant enrichment is observed for URVs from epilepsy-affected individuals in 29 GWAS genes (upper: 20,979 cases versus 33,444 controls), URVs from GGE in the 23 GGE-specific GWAS genes (middle: 5,499 GGE versus 33,444 controls), but not for URVs from NAFE in GGE GWAS genes (bottom: 9,219 NAFE versus 33,444 controls); and significance was only seen for protein-truncating (red) and damaging missense (orange) URVs but not for synonymous URVs (gray). The dot represents the log odds ratio and the error bars represent the 95% confidence intervals of the point estimates.
Fig. 6:
Fig. 6:
Functional analysis of candidate epilepsy genes. a,b, Spatiotemporal brain transcriptome analysis of exome/genome-wide significant genes identified in this WES study (N=13) or our recent GWA study (N=29) (a) and the top 20 genes enriched for deleterious URVs in each subtype of epilepsy (b). Candidate genes show the highest expression in the neocortex during postnatal periods. The expression values (log2[TPM+1]) are normalized to the mean for each BrainSpan sample and then averaged by each candidate gene set. Significance was evaluated by Wilcoxon signed rank test (N=162/200, 15/17, 14/19, 20/14, 13/16, and 13/21 for prenatal/postnatal neocortex, hippocampus, amygdala, striatum, thalamus, and cerebellum samples, respectively). Box plots indicate median, interquartile range (IQR) with whiskers adding IQR to the first and third quartiles. c, Gene Ontology terms enriched for candidate epilepsy genes with a prenatal- or postnatal- expression bias (N=43 and 50, respectively). Vertical dashed line indicates false discovery rate (FDR)=0.05; the full list of enriched terms is provided in Supplementary Data 12. d, A schematic diagram showing the distribution and function of 34 postnatally-biased genes on neuron structures. SV: synaptic vesicle, PSD: post-synaptic density, ER: endoplasmic reticulum.
Fig. 7:
Fig. 7:
Shared rare variant risk between epilepsy and other NDDs. a, Burden of URVs in genes implicated by WES of severe developmental disorders (DD; N=285), autism spectrum disorder (ASD; N=185), and schizophrenia (SCZ; N=32). Burden analyses are performed across four variant classes and four epilepsy groups – 1,938 DEEs, 5,499 GGE, 9,219 NAFE, and 20,979 epilepsy-affected individuals combined – versus 33,444 controls. Overall, DD/ASD-associated genes show stronger enrichment of epilepsy URVs than SCZ. The dot represents the log odds ratio and the error bars represent the 95% confidence intervals of the point estimates. b, Distribution of rare variants from GGE and other NDDs on the KDM6B protein. Top, a schematic protein plot displaying the distribution of protein-truncating (darker red) and damaging missense (lighter red) variants on KDM6B. Bottom, a schematic protein plot displaying the distribution of damaging missense variants with a likely destabilizing (ddG>0; orange) and stabilizing (ddG<0; blue) effect on KDM6B. In both plots, variants found in GGE are plotted above the protein and those from other NDDs are plotted below the protein (in the order of DD, ASD, and SCZ as labeled); the number of variant carriers are listed accordingly on the right.

References

    1. Fisher R. S. et al. ILAE official report: a practical clinical definition of epilepsy. Epilepsia 55, 475–482, doi:10.1111/epi.12550 (2014). - DOI - PubMed
    1. World Health Organization. Epilepsy: a public health imperative., (2022).
    1. Annegers J. F., Hauser W. A., Anderson V. E. & Kurland L. T. The risks of seizure disorders among relatives of patients with childhood onset epilepsy. Neurology 32, 174–179, doi:10.1212/wnl.32.2.174 (1982). - DOI - PubMed
    1. Berkovic S. F., Howell R. A., Hay D. A. & Hopper J. L. Epilepsies in twins: genetics of the major epilepsy syndromes. Ann Neurol 43, 435–445, doi:10.1002/ana.410430405 (1998). - DOI - PubMed
    1. Oliver K. L. et al. Genes4Epilepsy: An epilepsy gene resource. Epilepsia 64, 1368–1375, doi:10.1111/epi.17547 (2023). - DOI - PMC - PubMed

Methods-only references

    1. Harris P. A. et al. Research electronic data capture (REDCap)--a metadata-driven methodology and workflow process for providing translational research informatics support. J Biomed Inform 42, 377–381, doi:10.1016/j.jbi.2008.08.010 (2009). - DOI - PMC - PubMed
    1. Collaborative EPGP. The epilepsy phenome/genome project. Clin Trials 10, 568–586, doi:10.1177/1740774513484392 (2013). - DOI - PMC - PubMed
    1. Van der Auwera G. A. et al. From FastQ data to high confidence variant calls: the Genome Analysis Toolkit best practices pipeline. Curr Protoc Bioinformatics 43, 11 10 11–11 10 33, doi:10.1002/0471250953.bi1110s43 (2013). - DOI - PMC - PubMed
    1. McLaren W. et al. The Ensembl Variant Effect Predictor. Genome Biol 17, 122, doi:10.1186/s13059-016-0974-4 (2016). - DOI - PMC - PubMed
    1. Karczewski K. J. et al. The mutational constraint spectrum quantified from variation in 141,456 humans. Nature 581, 434–443, doi:10.1038/s41586-020-2308-7 (2020). - DOI - PMC - PubMed

Publication types