[Preprint]. 2023 Feb 21:2023.02.20.529031.
doi: 10.1101/2023.02.20.529031.

Community composition and the environment modulate the population dynamics of type VI secretion in human gut bacteria

Affiliations

Community composition and the environment modulate the population dynamics of type VI secretion in human gut bacteria

Sophie Robitaille et al. bioRxiv. .

Update in

Abstract

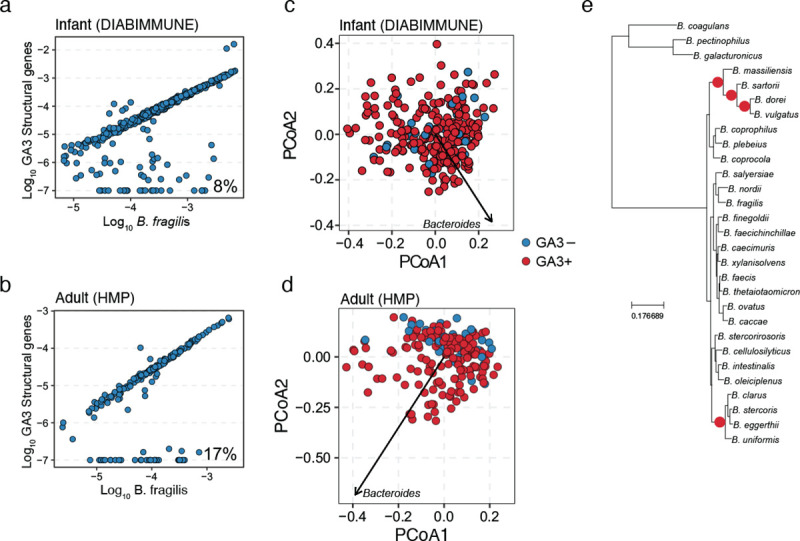
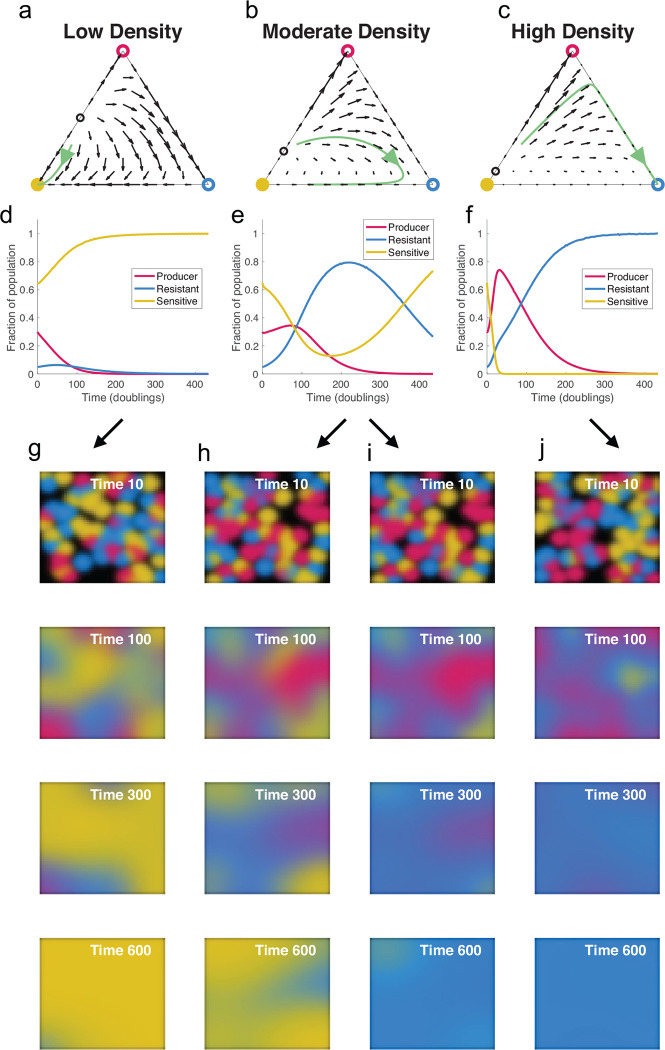
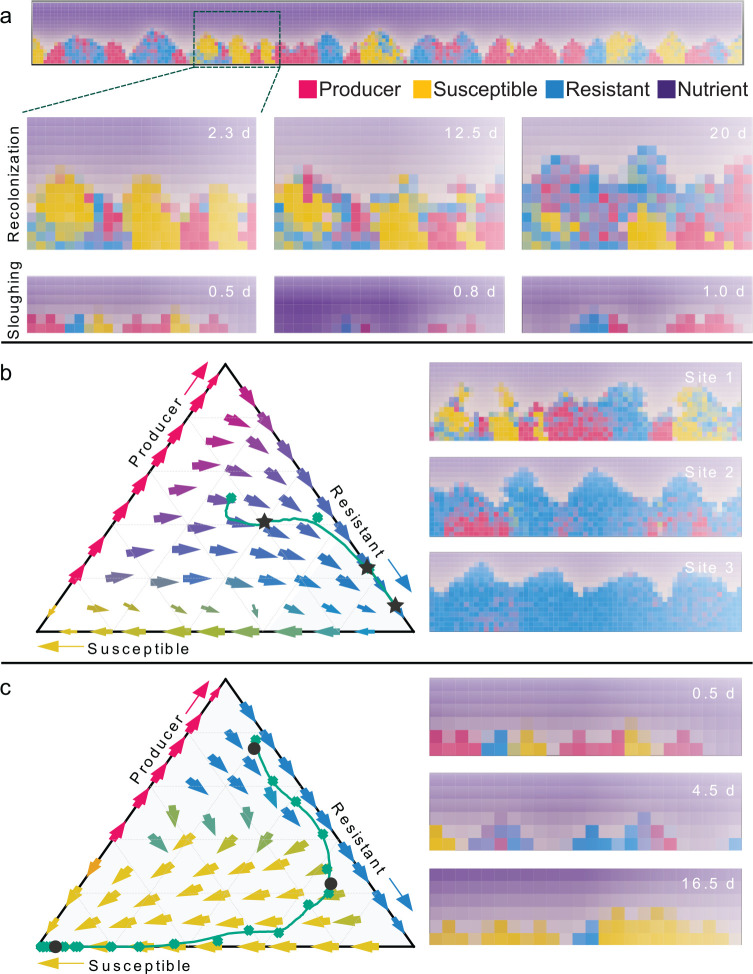
Understanding the relationship between the composition of the human gut microbiota and the ecological forces shaping it is of high importance as progress towards therapeutic modulation of the microbiota advances. However, given the inaccessibility of the gastrointestinal tract, our knowledge of the biogeographical and ecological relationships between physically interacting taxa has been limited to date. It has been suggested that interbacterial antagonism plays an important role in gut community dynamics, but in practice the conditions under which antagonistic behavior is favored or disfavored by selection in the gut environment are not well known. Here, using phylogenomics of bacterial isolate genomes and analysis of infant and adult fecal metagenomes, we show that the contact-dependent type VI secretion system (T6SS) is repeatedly lost from the genomes of Bacteroides fragilis in adults compare to infants. Although this result implies a significant fitness cost to the T6SS, but we could not identify in vitro conditions under which such a cost manifests. Strikingly, however, experiments in mice illustrated that the B. fragilis T6SS can be favored or disfavored in the gut environment, depending on the strains and species in the surrounding community and their susceptibility to T6SS antagonism. We use a variety of ecological modeling techniques to explore the possible local community structuring conditions that could underlie the results of our larger scale phylogenomic and mouse gut experimental approaches. The models illustrate robustly that the pattern of local community structuring in space can modulate the extent of interactions between T6SS-producing, sensitive, and resistant bacteria, which in turn control the balance of fitness costs and benefits of performing contact-dependent antagonistic behavior. Taken together, our genomic analyses, in vivo studies, and ecological theory point toward new integrative models for interrogating the evolutionary dynamics of type VI secretion and other predominant modes of antagonistic interaction in diverse microbiomes.


Figures

Extended Data Fig. 1.
Extended Data Fig. 1.. Abrogation of T6SS activity does not provide a fitness benefit to B. fragilis under laboratory conditions growing on mono and di-saccharide as carbon source.
Growth curves and solid growth in mono and co-culture for the Producer and Resistant strains subjected to growth on different sole carbon sources (mono and di-saccharide) in defined minimal broth or solid agar media, including D-glucose (a), D-fructose (b), D-galactose (c), D-xylose (d), and sucrose (e). For solid agar growth co-culture, producer and resistant strains were mixed at a 1:1 ratio by OD600, inoculated in high-density spots before being harvested for enumeration of colony forming units by plating on BHIS supplemented with either erythromycin or tetracycline. Mann-Whitney tests at each timepoint indicated no significant difference between strains. For liquid experiments, the results are from three biological replicates that each represent the mean of eight technical replicates. For solid growth, results are from six biological replicates from two independent experiments. Data shown represent mean values ±SD.
Extended Data Fig. 2.
Extended Data Fig. 2.. Abrogation of T6SS activity does not provide a fitness benefit to B. fragilis under laboratory conditions growing on polysaccharides as carbon source
The growth of the Producer and Resistant strains in defined minimal media with different carbon sources (polysaccharide) is shown in liquid and solid (mono and co-culture) growth in the different panels. For solid growth, B. fragilis Producer strain with ErmR and Resistant strain with TetR were grown on defined minimal media with different carbon sources separately (monoculture) and together in a 1:1 ratio (co-culture). Each strain was quantified via calculating colony-forming units on BHIS agar plates supplemented with erythromycin or tetracycline. The bacteria grew in defined minimal media supplemented with starch potato (a), glycogen (b), ©Synergy Inulin (c), and mucin (d). Mann-Whitney test showed no difference between the different strains at each timepoint. For liquid experiments, the results are from three biological replicates that each represent the mean of eight technical replicates. For solid growth, results are from six biological replicates from two independent experiments. Data shown represent mean values ±SD.
Fig. 1.
Fig. 1.. The GA3 T6SS is associated with altered composition of the human gut microbiota.
Comparison of abundance of B. fragilis-specific GA3 structural genes with B. fragilis marker genes in microbiome samples from (a) 6-to-18 month-old infants (DIABIMMUNE, N=416) and (b) adults (Human Microbiome Project, N=440). Scatter plots depict the relationship between the log10 abundance of B. fragilis and the log10 abundance of GA3 for samples in which at least 100 reads map to B. fragilis marker genes. GA3 abundance in each sample was adjusted with a pseudo count of 1e-7 and thus samples without detectable GA3 are present at −7. The percentage of B. fragilis-containing samples lacking GA3 is indicated at lower right in each plot. (c-d) PcoA plots depicting B. fragilis-positive shotgun metagenomic samples from (c) 6-to-18 month old infants from the DIABIMMUNE cohort and (d) adult HMP cohort. Samples are colored by the presence (red) or absence (blue) of the GA3 T6SS. Distances between samples were calculated using unweighted unifrac with genus-level relative abundance values and a phylogenetic tree of bacterial genera. A single loading vector is shown for Bacteroides and the separation between GA3+ and GA3− was assessed in each plot using PERMANOVA tests (DIABIMMUNE p > 0.05, HMP p < 0.01). © A phylogenetic tree of Bacteroides species that highlights significant PhILR nodes in red. We used the PhILR algorithm with Bonferroni correction for multiple tests to identify significant nodes on the MetaPhlAn3 phylogenetic tree using species relative abundance values.
Fig. 2.
Fig. 2.. Recurrent evolutionary loss of the GA3 T6SS from B. fragilis.
(a) Schematic comparing intact and degenerated GA3 loci (red genes) from syntenic regions of select B. fragilis genomes. Homology is indicated by shaded regions linking genes between genomes of different strains. (b) Maximum likelihood phylogenetic tree of B. fragilis strains based on single nucleotide polymorphisms in aligned B. fragilis MetaPhlAn3 marker genes. GA3 presence and absence are indicated by closed and open circles (respectively) at branch tips. Inferred unique loss (red) and gain (green) events during B. fragilis diversification are indicated by stars, based on ancestral state reconstruction.
Fig. 3.
Fig. 3.. A Resistant strain outcompetes a Producer strain during co-colonization of mice.
(a) Schematic representing the B. fragilis NCTC 9343 GA3 T6SS operon, comparing the “Producer” T6SS-active strain (magenta) to the “Resistant” T6SS-inactive strain (blue). The in-frame 3-gene deletion mutation (ΔtssBC-clpV) in the resistant strain is indicated by lack of shading. Strains were inoculated via oral gavage of a 1:1 mixture into antibiotic-treated SPF mice. Strain relative abundance (normalized to 100%) was tracked via barcode-specific quantitative PCR performed on DNA isolated from fecal pellets at indicated days post gavage. (b) Quantification of the percent relative abundance of Producer strain compared to the total quantity of gDNA detect for both Producer and Resistant strains (n=8 mice). Box plots indicate the mean and interquartile range. One-way ANOVA test was used to compare abundance between sampling at day 1 (one day after gavage) and all subsequent sampling (***P<0.001, ****P<0.00001). (c) Percent abundance of producer strain in each of 8 mice in compared to the total quantity of gDNA detect for both Producer and Resistant strains (b).
Fig. 4.
Fig. 4.. Co-colonization with a Sensitive strain alters Producer-Resistant strain dynamics in mice.
(a) Schematic representing the B. fragilis NCTC 9343 GA3 T6SS operon from the Sensitive strain. The in-frame deletion mutations (ΔE-IΔtssBC-clpV) are indicated by lack of shading. Producer, Resistant, and Sensitive strains were inoculated in a 1:1:1 ratio and the gDNA quantity of each strain was tracked for 88 days via qPCR on genomic DNA isolated from fecal pellets. Percentages of Producer (b), Resistant (c), and Sensitive (d) strains are shown as the mean of eight mice for each sampling from days 1 to 88. Significance between mean detected abundance for each strain comparing between day 1 after gavage and all subsequent samplings was assessed by Kruskal-Wallis test (*P<0.05 **P<0.01 ***P<0.001 ****P<0.0001). The percentage of detected Producer (e), Resistant (f), and Sensitive (g) gDNA is shown for each mouse individually over time. Results are representative of two independent colonization experiments, each with N = 8.
Fig. 5.
Fig. 5.. Reaction-diffusion model reveals local and spatial dynamics of T6SS Producer, Resistant and Sensitive genotypes.
(a-c) Ternary plots showing vector fields and sample trajectories for different values of the density parameter g (low density: g = 0.1, moderate density: g = 0.2, and high density: g = 0.5). Each point in the triangle represents a different community composition, with the distance to each edge representing the proportion of each genotype in the population. Open and closed circles at the vertices denote the unstable and stable steady states, respectively. (d-f) Progression of community composition for the trajectories shown in (a-c). At moderate and high densities, there is alternation of the dominant genotype. (g-j) Simulation of the system including spatial structure, where cells can move throughout a 2D surface. For moderate densities, in (h-i), the dominant genotype at the end of the simulation depends heavily on the initial distribution of the genotypes across the surface.
Fig. 6.
Fig. 6.. Individual-based biofilm simulations suggest dispersal-recolonization regimes can dictate selective loss of T6SS.
(a) An example of the biofilm simulation space containing cell groups of T6SS Producer (red), Sensitive (yellow/orange), and Resistant cells (blue). Below the full simulation space, partial frames are shown for the recolonization regime in which cells dispersed from the biofilm surface upstream can re-attach to the biofilm surface downstream, promoting admixture between different strains/species. We also implemented a sloughing regime in which the full biofilm system was periodically cleared and the surface instantaneously recolonized with a sub-sample of the population at the time point just prior to disturbance. (b) In the recolonization regime, simulations tended toward mixed regimes containing mostly T6SS Resistant cells, which most closely resembled the mouse experimental outcomes. We note that the pure-Resistant population state is predicted to be invadable in the long term by T6SS Sensitive cells if the Producer strain has been eliminated. (c) The sloughing regime, in which biofilm clearance was stronger, tended to generate isolated clonal clusters of cells of each strain along the basal surface. This regime tended more strongly to favor T6SS Sensitive cells, because they remained out of contact with T6SS Producers and had the highest growth rate of the three strain types.

References

    1. Young V.B. The role of the microbiome in human health and disease: an introduction for clinicians. BMJ 356, j831 (2017). - PubMed
    1. Zmora N., Suez J. & Elinav E. You are what you eat: diet, health and the gut microbiota. Nat Rev Gastroenterol Hepatol 16, 35–56 (2019). - PubMed
    1. Dominguez-Bello M.G., Godoy-Vitorino F., Knight R. & Blaser M.J. Role of the microbiome in human development. Gut 68, 1108–1114 (2019). - PMC - PubMed
    1. Yatsunenko T. et al. Human gut microbiome viewed across age and geography. Nature 486, 222–7 (2012). - PMC - PubMed
    1. Falony G. et al. Population-level analysis of gut microbiome variation. Science 352, 560–4 (2016). - PubMed

Publication types