[Preprint]. 2023 Feb 25:2023.02.24.529970.
doi: 10.1101/2023.02.24.529970.

Human APOBEC3B promotes tumor heterogeneity in vivo including signature mutations and metastases

Affiliations

Human APOBEC3B promotes tumor heterogeneity in vivo including signature mutations and metastases

Cameron Durfee et al. bioRxiv. .

Update in

Abstract

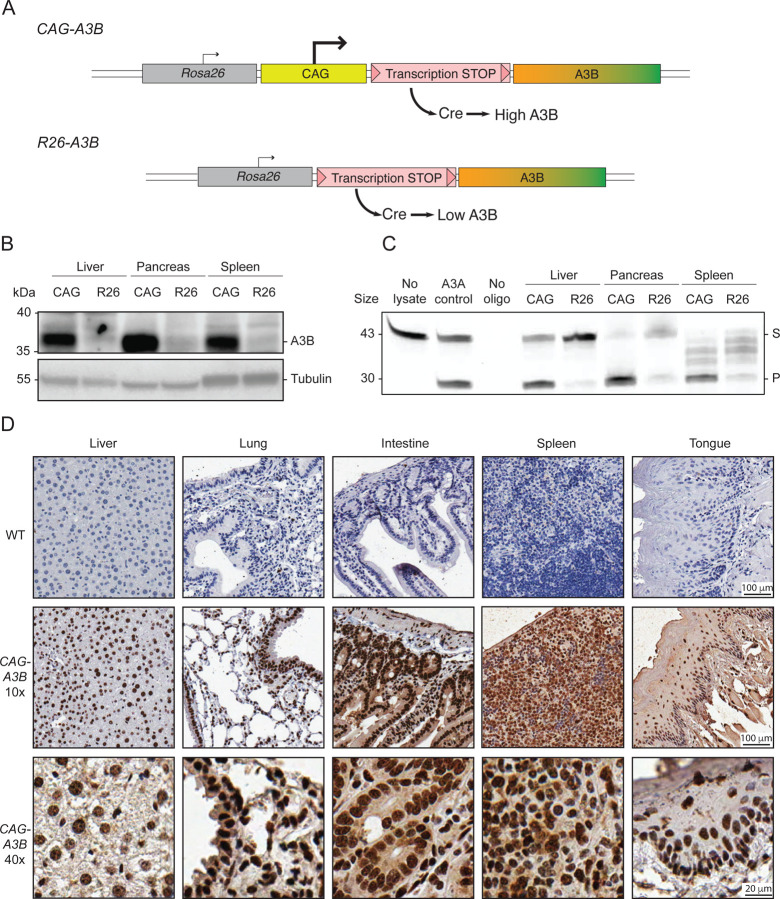
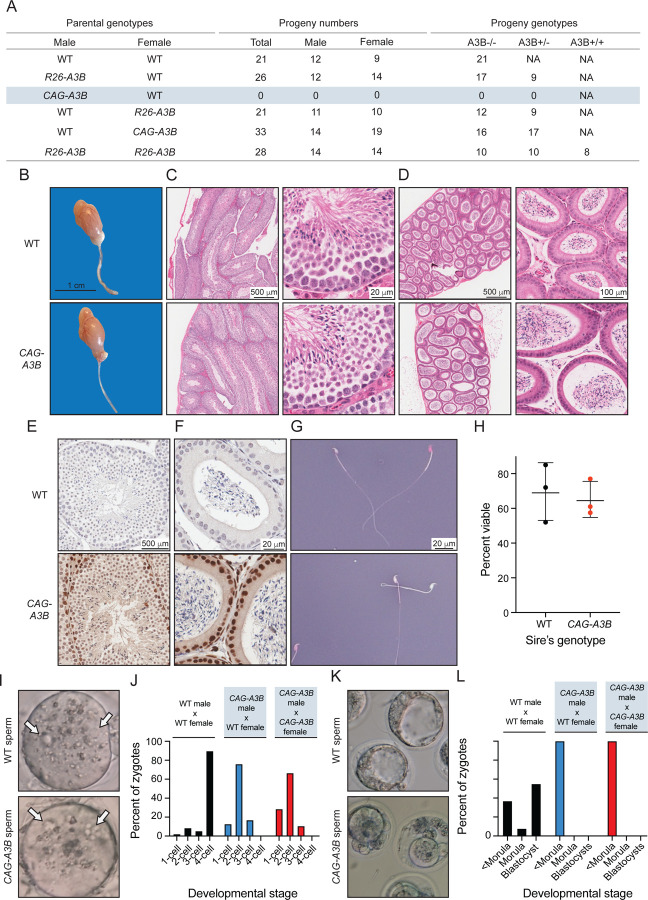
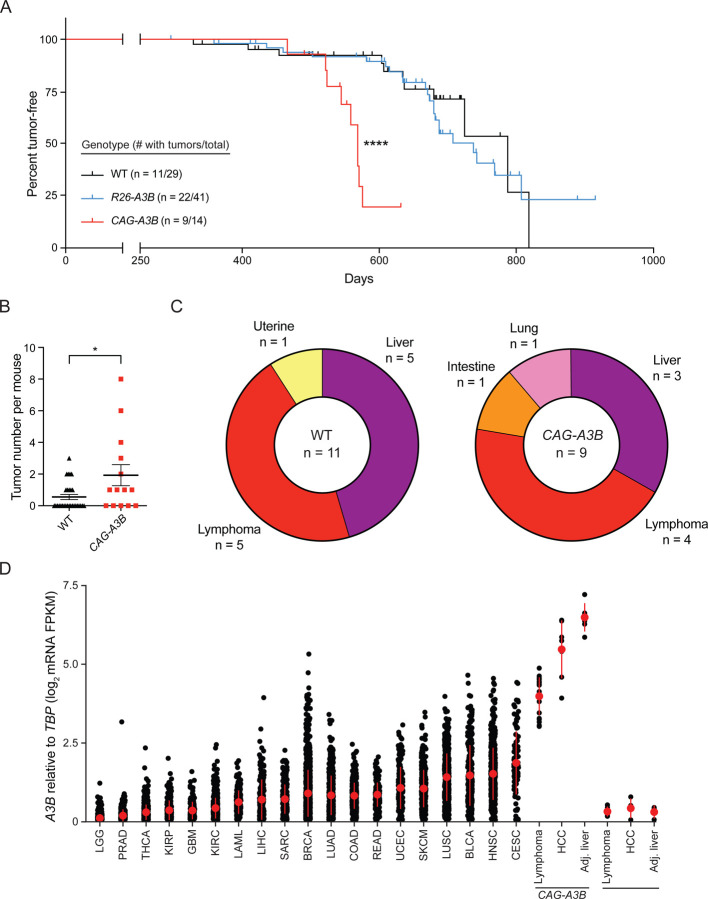
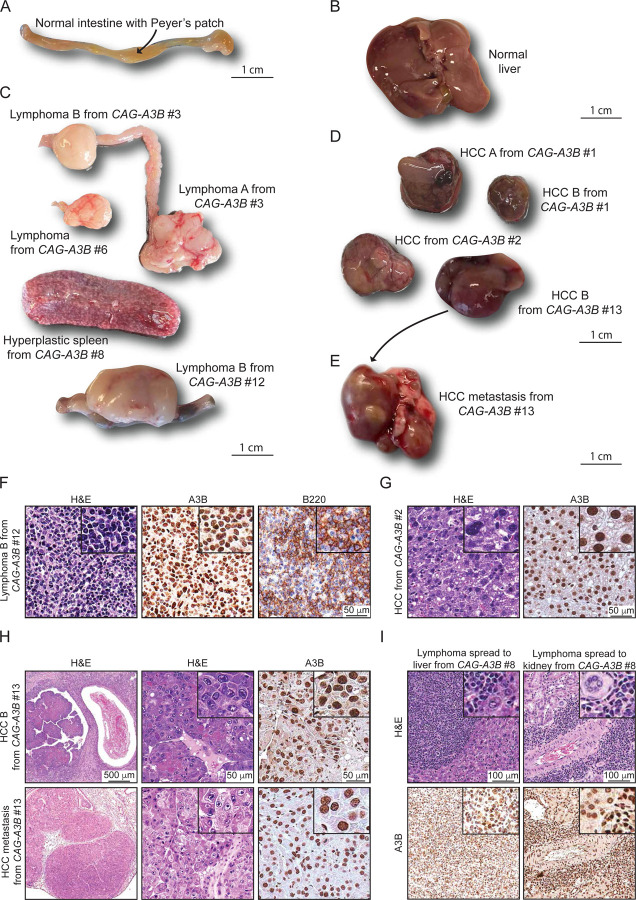
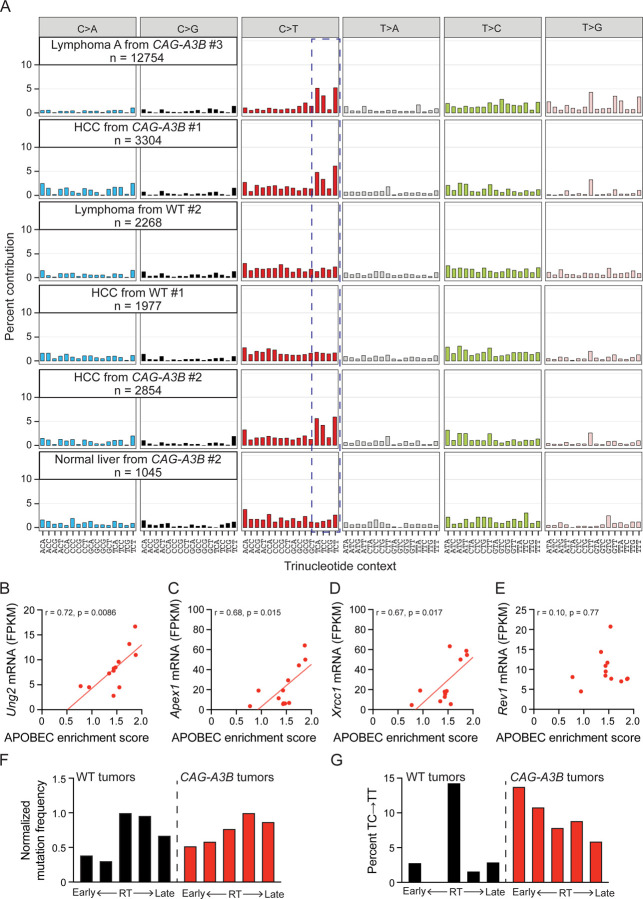
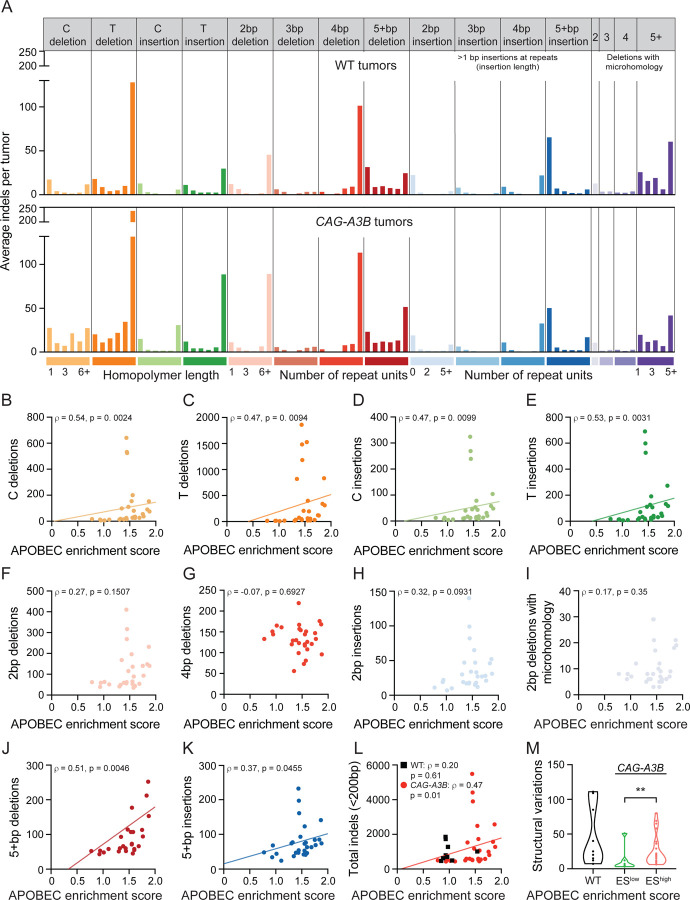
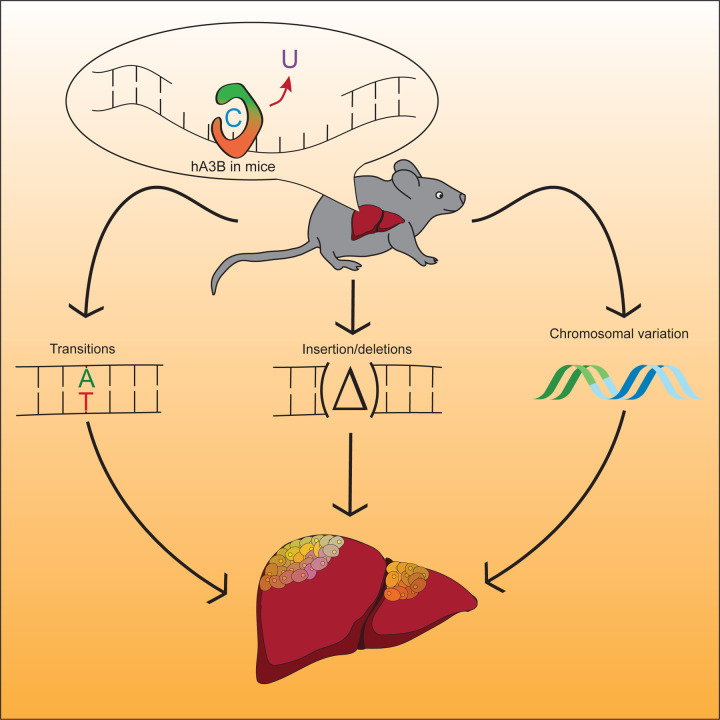
The antiviral DNA cytosine deaminase APOBEC3B has been implicated as a source of mutation in many different cancers. Despite over 10 years of work, a causal relationship has yet to be established between APOBEC3B and any stage of carcinogenesis. Here we report a murine model that expresses tumor-like levels of human APOBEC3B after Cre-mediated recombination. Animals appear to develop normally with full-body expression of APOBEC3B. However, adult males manifest infertility and older animals of both sexes show accelerated rates of tumorigenesis (mostly lymphomas or hepatocellular carcinomas). Interestingly, primary tumors also show overt heterogeneity, and a subset spreads to secondary sites. Both primary and metastatic tumors exhibit increased frequencies of C-to-T mutations in TC dinucleotide motifs consistent with the established biochemical activity of APOBEC3B. Elevated levels of structural variation and insertion-deletion mutations also accumulate in these tumors. Together, these studies provide the first cause-and-effect demonstration that human APOBEC3B is an oncoprotein capable of causing a wide range of genetic changes and driving tumor formation in vivo .


Conflict of interest statement

DECLARATION OF INTERESTS

The authors declare no competing interests.

Figures

Figure 1.
Figure 1.. Murine models for inducible expression of low or high levels of human A3B
(A) Schematics of CAG-A3B and R26-A3B knock-in alleles. Human A3B expression at high and low levels, respectively, only occurs after Cre-mediated excision of the STOP cassette. (B-C) Immunoblot and ssDNA deaminase activity of human A3B protein expressed in the indicated tissues from CAG-A3B and R26-A3B animals. Tubulin provides a loading control, and recombinant A3A is a positive control for activity, respectively (S, substrate; P, product). (D) Anti-A3B IHC staining of representative tissues from WT and CAG-A3B mice (40x magnifications are enlargements of regions of the corresponding 10x images). See also Figure S1.
Figure 2.
Figure 2.. High A3B levels cause male-specific infertility
(A) Progeny numbers and genotypes for the indicated crosses (n=3 litters per cross). (B) Images of a representative testicle and epididymis from WT and CAG-A3B animals. (C-D) H&E-stained sections of WT (top) and CAG-A3B (bottom) testicle and epididymis, respectively. (E-F) Anti-A3B IHC staining of the seminiferous tubule and epididymal lumen from WT and CAG-A3B males, respectively. (G-H) Representative images and quantification of spermatozoa from WT and CAG-A3B males, stained with eosin and nigrosin to distinguish live (white) and dead (pink) cells, respectively (mean +/− SD of n=200 sperm from 3 independent males). (I) Images of zygotes 7 hours post-fertilization of a WT ovum with spermatozoa from the indicated male genotypes. Arrows point to pronuclei, indicating fertilization. (J) Proportion of embryos at the indicated developmental stage 24 hours post-fertilization in vitro (n>50 zygotes analyzed per condition). (K) Images of developing embryos 96 hours post-fertilization in vitro. (L) Proportion of embryos at the indicated developmental stage 96 hours post-fertilization in vitro (n>50 zygotes analyzed per condition; continuation of experiment reported in panel J).
Figure 3.
Figure 3.. CAG-A3B mice exhibit accelerated rates of tumor progression and elevated tumor numbers
(A) Kaplan-Meier curves comparing tumor-free survival of WT (n=29), R26-A3B (n=41), and CAG-A3B (n=14) mice (****, p<0.0001 by log-rank Mantel-Cox test). The number of animals with tumors is shown over the total number of animals in each group. (B) Dot plot of the number of tumors per mouse in each respective genotype (mean +/− SEM; *, p=0.0387 by Mann-Whitney U test). (C) Pie chart summarizing primary tumor locations in WT and CAG-A3B mice. (D) A3B mRNA expression levels relative to those of the housekeeping gene TBP for the indicated specimens (single data points show individual values and the median +/− SD is indicated in red for each group). Human tumor RNA-seq data sets are from TCGA, and WT and CAG-A3B data sets are from the indicated tumor and matched normal liver tissues described here (WT lymphoma n=4, HCC n=4, and normal liver n=4; CAG-A3B lymphoma n=18, HCC n=7, and normal liver n=6). See also Figures S2, S3, S4, and Table S1.
Figure 4.
Figure 4.. Heterogeneity and evidence for metastasis in tumors from CAG-A3B animals
(A-B) Representative normal intestine with Peyer’s patch (arrow) and normal liver tissues, respectively, from CAG-A3B mice. (C-D) Macroscopic pictures of a heterogeneous assortment lymphomas and hepatocellular carcinomas, respectively, from CAG-A3B mice. (E) Representative image of a primary hepatocellular carcinoma that metastasized to the lung (HCC B from CAG-A3B #13 in panel D). (F) H&E, anti-A3B, and anti-B220 IHC of lymphoma B from CAG-A3B #12. Inset boxes show the same tumors at 4x additional magnification. (G) H&E and anti-A3B IHC of HCC from CAG-A3B #2. Inset boxes show the same tumors at 4x additional magnification. (H) H&E and anti-A3B IHC staining of a primary hepatocellular carcinoma (top) and its metastatic dissemination to the lung (bottom) from CAG-A3B #13. Inset boxes show the same tumors at 4x additional magnification. (I) H&E and anti-A3B IHC staining of a diffuse large B-cell lymphoma in the liver (left) and kidney (right). Inset boxes show the same tumors at 4x additional magnification. See also Figures S5 and S6.
Figure 5:
Figure 5:. CAG-A3B tumors exhibit APOBEC signature mutations
(A) Representative SBS mutation profiles for the indicated tumors from WT or CAG-A3B animals (mutation numbers shown). The dashed box highlights APOBEC preferred TC motifs characteristic of SBS2. (B-E) Scatterplots of APOBEC enrichment score from CAG-A3B lymphomas (n=12) compared to the mRNA levels of Ung2, Apex1, Xrcc1, and Rev1, respectively, from the same tumors (Pearson correlation coefficients and corresponding p-values indicated). (F) Bar plots showing the proportion of mutations in WT and CAG-A3B tumors according to early-to late-replicating regions (mutation numbers normalized to the largest quintile in each group). (G) Bar plots showing the percent of TC-to-TT mutations as a percent of all mutations in each quintile in panel F. See also Figures S7, S8, S9, S10, and S11.
Figure 6.
Figure 6.. Hypermutated CAG-A3B tumors also exhibit higher frequencies of a range of structural variations
(A) Composite spectrum of the average number of small insertion/deletion mutations in tumors from WT (n=9) and CAG-A3B (n=29) animals. (B-K) Scatterplots showing relationships between APOBEC enrichment scores from CAG-A3B tumors and the indicated indel types (Spearman’s rank correlation coefficients and corresponding p-values indicated). (L) Scatterplots showing the relationship between APOBEC enrichment scores from WT (black) and CAG-A3B (red) tumors and the total number of indels <200bp in each tumor (Spearman’s rank correlation coefficients and corresponding p-values indicated). (M) Violin plots of the total number of structural variations in tumors from WT mice in comparison to tumors from CAG-A3B animals with low or high APOBEC enrichment scores (ES; p=0.0087 for EShigh vs ESlow groups by Mann-Whitney U test). See also Figures S7, S10, and S12.
Figure 7.
Figure 7.. Working model for mutation and carcinogenesis by human A3B
Human A3B catalyzes ssDNA C-to-U deamination events that lead to signature SBS events, as well as small-scale insertion/deletion mutations and larger-scale structural variations. These different mutational events combine to initiate primary tumor development, cause the observed heterogeneity, and fuel additional tumor evolution including metastases.

References

    1. Hanhan D. (2022). Hallmarks of cancer: new dimensions. Cancer Discov. 12, 31–46. 10.1158/2159-8290.CD-21-1059. - DOI - PubMed
    1. Persi E., Wolf Y.I., Horn D., Ruppin E., Demichelis F., Gatenby R.A., Gillies R.J., and Koonin E.V. (2021). Mutation–selection balance and compensatory mechanisms in tumour evolution. Nat. Rev. Genet. 22, 251–262. 10.1038/s41576-020-00299-4. - DOI - PubMed
    1. Reiter J.G., Baretti M., Gerold J.M., Makohon-Moore A.P., Daud A., Iacobuzio-Donahue C.A., Azad N.S., Kinzler K.W., Nowak M.A., and Vogelstein B. (2019). An analysis of genetic heterogeneity in untreated cancers. Nat. Rev. Cancer 19, 639–650. 10.1038/s41568-019-0185-x. - DOI - PMC - PubMed
    1. Koh G., Degasperi A., Zou X., Momen S., and Nik-Zainal S. (2021). Mutational signatures: emerging concepts, caveats and clinical applications. Nat. Rev. Cancer 21, 619–637. 10.1038/s41568-021-00377-7. - DOI - PubMed
    1. PCAWG Mutational Signatures Working Group, PCAWG Consortium, Alexandrov L.B., Kim J., Haradhvala N.J., Huang M.N., Tian Ng A.W., Wu Y., Boot A., Covington K.R., et al. (2020). The repertoire of mutational signatures in human cancer. Nature 578, 94–101. 10.1038/s41586-020-1943-3. - DOI - PMC - PubMed

Publication types