[Preprint]. 2023 Feb 21:2023.02.20.529270.
doi: 10.1101/2023.02.20.529270.

Hypoxia-inducible factor 2 is a key determinant of manganese excess and polycythemia in SLC30A10 deficiency

Affiliations

Hypoxia-inducible factor 2 is a key determinant of manganese excess and polycythemia in SLC30A10 deficiency

Milankumar Prajapati et al. bioRxiv. .

Update in

Abstract

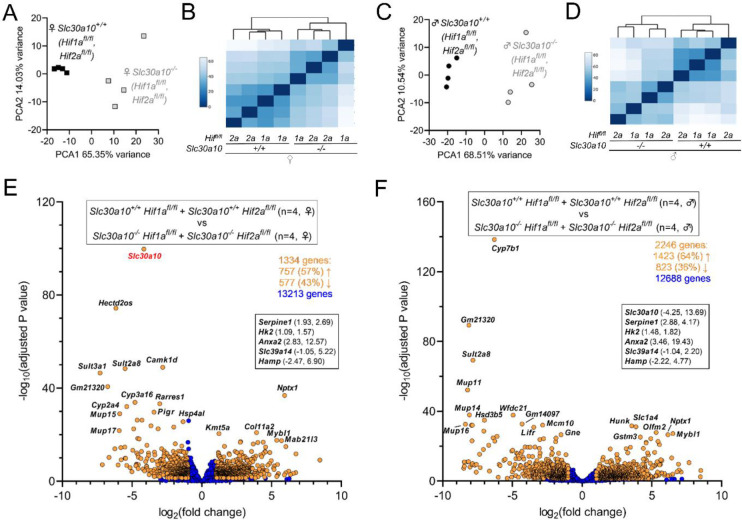
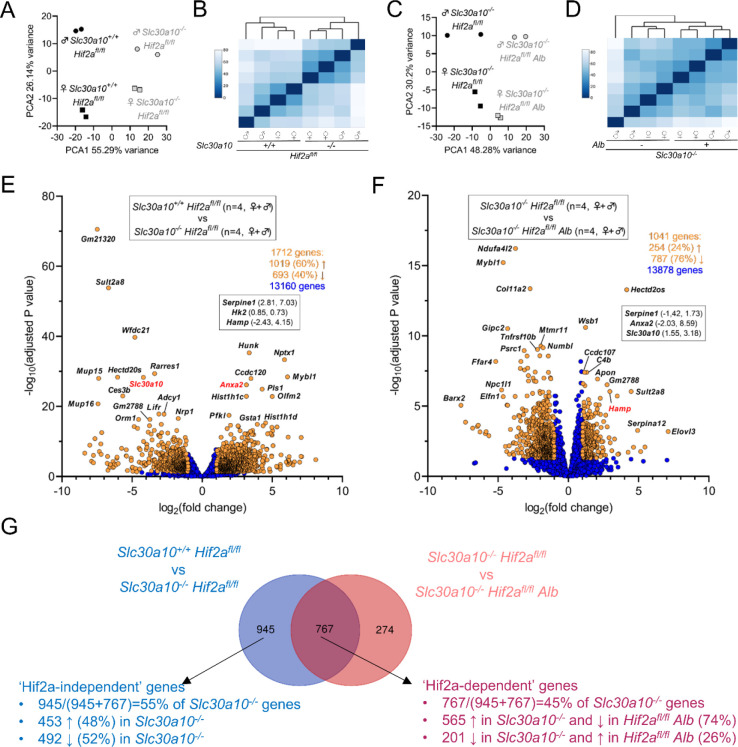
Manganese is an essential yet potentially toxic metal. Initially reported in 2012, mutations in SLC30A10 are the first known inherited cause of manganese excess. SLC30A10 is an apical membrane transport protein that exports manganese from hepatocytes into bile and from enterocytes into the lumen of the gastrointestinal tract. SLC30A10 deficiency results in impaired gastrointestinal manganese excretion, leading to severe manganese excess, neurologic deficits, liver cirrhosis, polycythemia, and erythropoietin excess. Neurologic and liver disease are attributed to manganese toxicity. Polycythemia is attributed to erythropoietin excess, but the basis of erythropoietin excess in SLC30A10 deficiency has yet to be established. Here we demonstrate that erythropoietin expression is increased in liver but decreased in kidneys in Slc30a10-deficient mice. Using pharmacologic and genetic approaches, we show that liver expression of hypoxia-inducible factor 2 (Hif2), a transcription factor that mediates the cellular response to hypoxia, is essential for erythropoietin excess and polycythemia in Slc30a10-deficient mice, while hypoxia-inducible factor 1 (HIF1) plays no discernible role. RNA-seq analysis determined that Slc30a10-deficient livers exhibit aberrant expression of a large number of genes, most of which align with cell cycle and metabolic processes, while hepatic Hif2 deficiency attenuates differential expression of half of these genes in mutant mice. One such gene downregulated in Slc30a10-deficient mice in a Hif2-dependent manner is hepcidin, a hormonal inhibitor of dietary iron absorption. Our analyses indicate that hepcidin downregulation serves to increase iron absorption to meet the demands of erythropoiesis driven by erythropoietin excess. Finally, we also observed that hepatic Hif2 deficiency attenuates tissue manganese excess, although the underlying cause of this observation is not clear at this time. Overall, our results indicate that HIF2 is a key determinant of pathophysiology in SLC30A10 deficiency.


Conflict of interest statement

The authors have declared that no conflict of interest exists.

Figures

Fig. 1:
Fig. 1:. Slc30a10−/− mice develop Mn-dependent Epo excess and polycythemia.
(A, B) Two-month-old Slc30a10+/+ and Slc30a10−/− mice were analyzed for serum Epo levels by ELISA (A) and kidney and liver Epo RNA levels by qPCR (B). (C-E) Livers from two-month-old Slc30a10+/+ and Slc30a10−/− mice were analyzed by PCR array for hypoxia-regulated genes up- (blue) or down- (red) regulated at least two-fold (C, D), followed by qPCR validation of top three differentially regulated genes after Epo (E). (F) Two-month-old Slc30a10+/+ and Slc30a10−/− mice were analyzed for liver cobalt levels by GFAAS. (G-I) Slc30a10+/+ and Slc30a10−/− mice were weaned onto Mn-sufficient (100 ppm) or –deficient (1 ppm) diets, then analyzed at six weeks for liver Mn levels by ICPES (G), RBC counts by complete blood counts (H), and liver Epo RNA levels by qPCR (I). Data are represented as means +/− standard deviation, with at least four animals per group, except for (C, D) where three mice were used. In this figure and all other figures, data were tested for normal distribution by Shapiro-Wilk test; if not normally distributed, data were log transformed. Two groups were compared by unpaired, two-tailed t test. Three or more groups (within each sex) were compared by one-way ANOVA with Tukey’s multiple comparisons test. (ns P=>0.05, * P<0.05, ** P<0.01, *** P<0.001, **** P<0.0001)
Fig. 2:
Fig. 2:. Slc39a14 deficiency corrects liver Epo excess and polycythemia in Slc30a10−/− mice.
Five-week-old Slc30a10 Slc39a14 mice were analyzed for: liver Slc30a10 (A) and Slc39a14 (B) RNA levels by qPCR; liver Mn levels by ICPES (C); liver Epo (D), Serpine1 (E), Hk2 (F), and Anxa2 (G) RNA levels by qPCR; RBC counts (H), hemoglobin levels (I), and hematocrits (J) by complete blood counts; kidney Epo RNA levels by qPCR (K); kidney Mn levels by ICPES (L); blood Mn levels by GFAAS (M); pancreas (N), bone (O), brain (P), heart (Q), small intestine (R), and large intestine (S) Mn levels by ICPES. Data are represented and statistics performed and annotated as in Fig. 1.
Fig. 3:
Fig. 3:. Hif2a ASOs decrease liver Epo RNA levels in Slc30a10−/− mice.
Weanling Slc30a10+/+ mice were treated with saline and Slc30a10−/− mice with GalNAc-conjugated control, Hif1a, or Hif2a ASOs twice a week for three weeks. Mice were then analyzed for: liver Slc30a10 RNA levels (A), liver Hif1a (B) and Hif2a (C) RNA levels, kidney Hif1a (D) and Hif2a (E) RNA levels, and liver (F) and kidney (G) Epo RNA levels by qPCR; RBC counts (H), hemoglobin levels (I), and hematocrits (J) by complete blood counts; body mass (K); bile flow rates (L); bile Mn levels by GFAAS (M); and liver Mn levels by ICPES (N). Data are represented and statistics performed and annotated as in Fig. 1.
Fig. 4:
Fig. 4:. Hepatocyte Hif1a deficiency does not impact Epo levels or polycythemia in Slc30a10−/− mice.
Two-month-old Slc30a10 Hif1afl/fl +/−Alb mice were analyzed for: liver Slc30a10 (A), Hif1a (B), and Hif2a (C) RNA levels, kidney Hif1a (D) and Hif2a (E) RNA levels, and liver (F) and kidney (G) Epo RNA levels by qPCR; body mass (H); RBC counts (I), hemoglobin levels (J), and hematocrits (K) by complete blood counts; bile flow rates (L); bile Mn levels by GFAAS (M); liver Mn levels by ICPES (N); blood Mn levels by GFAAS (O). Data are represented and statistics performed and annotated as in Fig. 1.
Fig. 5:
Fig. 5:. Hepatocyte Hif2a deficiency corrects Epo excess and polycythemia and decreases Mn levels in Slc30a10−/− mice.
Two-month-old Slc30a10 Hif2afl/fl +/−Alb mice were analyzed for: liver Slc30a10 (A), Hif2a (B), and Hif1a (C) RNA levels, kidney Hif2a (D) and Hif1a (E) RNA levels, and liver (F) and kidney (G) Epo RNA levels by qPCR; body mass (H); RBC counts (I), hemoglobin levels (J), and hematocrits (K) by complete blood counts; bile flow rates (L); bile Mn levels by GFAAS (M); liver (N), bone (O), brain (P), pancreas (Q), and kidney (R) Mn levels by ICPES; blood Mn levels by GFAAS (S). Data are represented and statistics performed and annotated as in Fig. 1.
Fig. 6:
Fig. 6:. Slc30a10 deficiency prominently impacts hepatic gene expression.
Principal component (A, B) and similarity analysis (C, D) of samples and volcano plots (E, F) of genes differentially expressed between Slc30a10+/+ Hif1afl/fl or Hif2afl/fl mice and Slc30a10−/− Hif1afl/fl or Hif2afl/fl mice; female (A, B, E) and male (C, D, F). In volcano plots, differentially expressed genes (adjusted P value<0.05 and absolute value of log2(fold change)>1) are shown as light orange points with gene names shown adjacent as space permitted; non-differentially expressed genes are shown as blue points; x-y coordinates of additional genes of interest shown in smaller box. Genes with log2(fold change)<0 are more abundantly expressed in first group listed in box at top of plot; genes with log2(fold change)>0 are more abundantly expressed in second group listed.
Fig. 7:
Fig. 7:. Hepatic Hif1a deficiency has minimal impact on hepatic gene expression in Slc30a10−/− mice.
Principal component (A, B) and similarity analysis (C, D) of samples and volcano plots (E, F) of genes differentially expressed between Slc30a10+/+ Hif1afl/fl and Slc30a10−/− Hif1afl/fl mice (A-C) and between Slc30a10−/− Hif1afl/fl and Slc30a10−/− Hif1afl/fl Alb mice (D-F). Volcano plots represented as described in Fig. 6.
Fig. 8:
Fig. 8:. Hepatic Hif2a deficiency has a prominent impact on hepatic gene expression in Slc30a10−/− mice.
Principal component (A, B) and similarity analysis (C, D) of samples and volcano plots (E, F) of genes differentially expressed between Slc30a10+/+ Hif2afl/fl and Slc30a10−/− Hif2afl/fl mice (A-C) and between Slc30a10−/− Hif2afl/fl and Slc30a10−/− Hif2afl/fl Alb mice (D-F). Volcano plots are represented as described in Fig. 6. (G) Venn diagram of differentially expressed genes from (E, F).
Fig. 9:
Fig. 9:. Hepatic genes differentially expressed between Slc30a10−/− Hif1afl/fl Alb and Slc30a10−/− Hif2afl/fl Alb mice align largely with cell cycle and metabolism pathways.
(A-C) Principal component (A) and similarity analysis (B) of samples and volcano plot (C) of genes differentially expressed between Slc30a10−/− Hif1afl/fl Alb and Slc30a10−/− Hif2afl/fl Alb mice. Volcano plot is represented as in Fig. 6. (D-E) Gene enrichment analysis. (F) Heat map of gene expression for genes aligned with pathways encircled by dashed shape in (E).
Fig. 10:
Fig. 10:. Hepatic Hif2a deficiency impacts iron (Fe) homeostasis in Slc30a10−/− mice.
(A-D) Mice from Fig. 1A–F were analyzed for: (A) liver hepcidin (Hamp) RNA levels by qPCR; (B) serum Epo levels by ELISA; (C) 59Fe absorption by gastric gavage; (D) total Fe levels in spleen by ICPES; (E) non-heme Fe levels in spleen by bathophenanthroline-based assay. (F-H) Mice from Fig. 2–4 were analyzed for liver Hamp RNA levels by qPCR. Data are represented and statistics performed and annotated as in Fig. 1.

Similar articles

References

    1. Chen P, Bornhorst J, Aschner M. Manganese metabolism in humans. Front. Biosci. Landmark Ed. 2018;23:1655–1679. - PubMed
    1. Erikson KM, Aschner M. Manganese: Its Role in Disease and Health. Met. Ions Life Sci. 2019;19. doi:10.1515/9783110527872-016 - DOI - PubMed
    1. Anagianni S, Tuschl K. Genetic Disorders of Manganese Metabolism. Curr. Neurol. Neurosci. Rep. 2019;19(6):33. - PMC - PubMed
    1. Leyva-Illades D et al. SLC30A10 is a cell surface-localized manganese efflux transporter, and parkinsonism-causing mutations block its intracellular trafficking and efflux activity. J. Neurosci. 2014;34(42):14079–14095. - PMC - PubMed
    1. Taylor CA et al. SLC30A10 transporter in the digestive system regulates brain manganese under basal conditions while brain SLC30A10 protects against neurotoxicity. J. Biol. Chem. 2019;294(6):1860–1876. - PMC - PubMed

Publication types