[Preprint]. 2023 Feb 20:2023.02.19.529127.
doi: 10.1101/2023.02.19.529127.

FALCON systematically interrogates free fatty acid biology and identifies a novel mediator of lipotoxicity

Affiliations

FALCON systematically interrogates free fatty acid biology and identifies a novel mediator of lipotoxicity

Nicolas Wieder et al. bioRxiv. .

Update in

  • FALCON systematically interrogates free fatty acid biology and identifies a novel mediator of lipotoxicity.
    Wieder N, Fried JC, Kim C, Sidhom EH, Brown MR, Marshall JL, Arevalo C, Dvela-Levitt M, Kost-Alimova M, Sieber J, Gabriel KR, Pacheco J, Clish C, Abbasi HS, Singh S, Rutter JC, Therrien M, Yoon H, Lai ZW, Baublis A, Subramanian R, Devkota R, Small J, Sreekanth V, Han M, Lim D, Carpenter AE, Flannick J, Finucane H, Haigis MC, Claussnitzer M, Sheu E, Stevens B, Wagner BK, Choudhary A, Shaw JL, Pablo JL, Greka A. Wieder N, et al. Cell Metab. 2023 May 2;35(5):887-905.e11. doi: 10.1016/j.cmet.2023.03.018. Epub 2023 Apr 18. Cell Metab. 2023. PMID: 37075753 Free PMC article.

Abstract

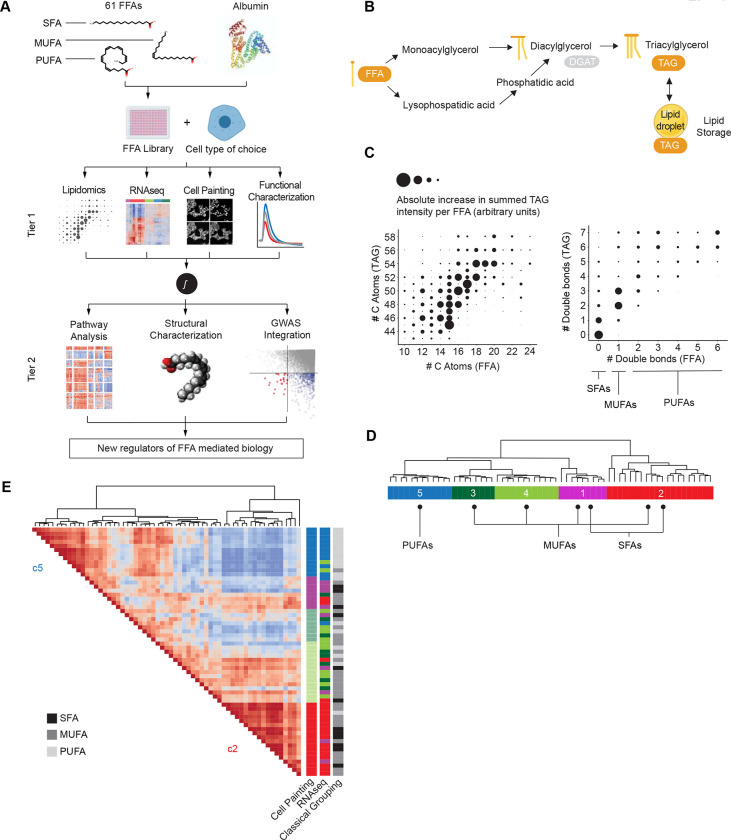
Cellular exposure to free fatty acids (FFA) is implicated in the pathogenesis of obesity-associated diseases. However, studies to date have assumed that a few select FFAs are representative of broad structural categories, and there are no scalable approaches to comprehensively assess the biological processes induced by exposure to diverse FFAs circulating in human plasma. Furthermore, assessing how these FFA- mediated processes interact with genetic risk for disease remains elusive. Here we report the design and implementation of FALCON (Fatty Acid Library for Comprehensive ONtologies) as an unbiased, scalable and multimodal interrogation of 61 structurally diverse FFAs. We identified a subset of lipotoxic monounsaturated fatty acids (MUFAs) with a distinct lipidomic profile associated with decreased membrane fluidity. Furthermore, we developed a new approach to prioritize genes that reflect the combined effects of exposure to harmful FFAs and genetic risk for type 2 diabetes (T2D). Importantly, we found that c-MAF inducing protein (CMIP) protects cells from exposure to FFAs by modulating Akt signaling and we validated the role of CMIP in human pancreatic beta cells. In sum, FALCON empowers the study of fundamental FFA biology and offers an integrative approach to identify much needed targets for diverse diseases associated with disordered FFA metabolism.

Highlights: FALCON (Fatty Acid Library for Comprehensive ONtologies) enables multimodal profiling of 61 free fatty acids (FFAs) to reveal 5 FFA clusters with distinct biological effectsFALCON is applicable to many and diverse cell typesA subset of monounsaturated FAs (MUFAs) equally or more toxic than canonical lipotoxic saturated FAs (SFAs) leads to decreased membrane fluidityNew approach prioritizes genes that represent the combined effects of environmental (FFA) exposure and genetic risk for diseaseC-Maf inducing protein (CMIP) is identified as a suppressor of FFA-induced lipotoxicity via Akt-mediated signaling.


Conflict of interest statement

Competing Interests

NW, JCF and AG are co-inventors of a patent on the composition, method and use for FFA screening, application No.: 52199-550P01US. A.G. serves as a founding advisor to a new company launched by Atlas Ventures, an agreement reviewed and managed by Brigham and Women’s Hospital, Mass General Brigham, and the Broad Institute of MIT and Harvard in accordance with their conflict of interest policies.

Figures

Fig. 1.
Fig. 1.. FALCON, a multiplexed platform for the systematic interrogation of structurally diverse FFAs defines 5 FFA clusters.
(A) Analysis workflow for FALCON. SFA, saturated fatty acid; MUFA, monounsaturated fatty acid; PUFA, polyunsaturated fatty acid. In Tier 1, we use several methods, as listed, to characterize the cellular effects of each of 61 FFAs. In Tier 2, the Tier 1 datasets are integrated to reveal mechanistic insights. (B) Schematic of triacylglyceride (TAG) synthesis from FFAs. Shown here are the monoacylglycerol (top) and the glycerol-3-phosphate pathway (bottom). For simplicity, the acylation of dihydroxyacetone phosphate is not shown. (C) Qualitative correlation of structural features (number of C atoms, number of double bonds) of externally applied FFAs from the library (x-axis) versus structural features of endogenous TAGs (y-axis) measured by lipidomics. Distinct TAG profiles detected in cells treated with SFAs, MUFAs or PUFAs. (D) Five FFA clusters (c1-c5) were identified after hierarchical clustering of transcriptomic profiles derived from exposure to each of 61 FFAs (methods). (E) Cell Painting analysis of immunofluorescence images from cells exposed to each of 61 FFAs (methods) independently clustered together the FFAs transcriptomically assigned to c2 and separately the FFAs assigned to c5.
Fig. 2.
Fig. 2.. Transcriptomic analysis identifies key biological responses to FFAs, and functional assays validate novel FFA clustering.
(A) Hierarchical clustering of a gene set enrichment matrix (based on normalized enrichment scores of gene sets, NES) revealed gene set modules of interest. Representative leading edge genes from each module are listed on the right. (B, C) Scatter plots of two independent replicates of cell viability (B) and ER Ca2+ level measurements (C)(n=5–7 replicates / FFA / screen). Closed dots represent FFAs that showed significant difference (p < 0.05, Bonferroni) from controls in both replicates, open dots represent non-significant FFAs in at least one replicate. Colors indicate corresponding FFA cluster membership (Fig. 1D). (D) Summary of functional assays. Top bar represents FFA clusters derived from transcriptomic analysis. Second color bar represents clusters derived from Cell Painting (cellular morphology) analysis (methods). Bar in grayscale indicates classical grouping of FFAs based on saturation level. The next two bars are heat maps displaying log2 fold changes of ER Ca2+ levels and cell viability, respectively. X-axis labels show FFA structure (in Simplified Molecular Input Line Entry System, SMILES). The box highlights the 20 FFAs in cluster 2 (c2) identified as the lipotoxicity cluster. Highlighted FFAs were chosen as cluster representatives for further downstream studies. PA, palmitic acid; EA, erucic acid; PSA, petroselenic acid; OA, oleic acid; AA, arachidonic acid; GLA: gamma-linoleic acid.
Fig. 3.
Fig. 3.. FALCON is applicable at scale to different cell types.
(A) Heatmap showing comparison of viability changes across 3 different cell types: MIN6 pancreatic beta cells, human iPSC-derived microglia and human kidney tubular epithelial cells. c2 FFAs are toxic for all three cell types studied. (B) Representative images from all 3 cell types highlighting the toxicity of c2 FFAs including erucic acid (EA). EA induces cell death in beta cells (green, Hoescht), in microglia (green, GFP) and in kidney tubular epithelial cells (red, propidium iodide). Scale bars: 100 μm. (C-E) Bar plots indicate change in cell viability relative to BSA induced by OA, PA, or EA in each cell type after exposure to FFAs at 500 μM for 72 h (MIN6) (C), 500 μM for 15 h (epithelial cells) (D), or 250 μM for 24 h (microglia) (E). PA and EA consistently induce cell death across all three cell types as assessed by 1-way ANOVA followed by Dunnett’s test (*p < 0.05, ****p < 0.0001). Data are mean ± SD.
Fig. 4.
Fig. 4.. Cell biological hallmarks of lipotoxicity characterize the c2 FFA cluster.
(A) Quantification of fluorescence imaging of cells treated with representative FFAs for 48 h. Apoptotic cells (positive y-axis) are measured by caspase activity. Dead cells are measured by propidium iodide positive nuclei (n = 5 wells). Reduction in cell viability (negative y-axis) is defined as the fraction of caspase positive and propidium iodide positive cells. Data are mean ± SD. Student’s t-test (two-sided) ****p < 0.0001, corrected for multiple testing (Bonferroni). (B) Dose-response curve of live cell numbers after 65 h of EA or OA treatment compared to BSA. Live cell number is assessed by total number of Hoechst-positive nuclei that were negative for propidium iodide and for cleaved caspase 3/7. EA is toxic in a concentration dependent manner; OA is not toxic. (C) Western blots show ATF4 and CHOP induction by PA and EA (lipotoxic c2 FFAs). CPT1A induction is a control for intracellular FFA delivery. BSA, negative control. (D) Quantification of peak amplitude as readout for ER Ca2+ levels, relative to negative control (BSA). Data are mean ± SD. Student’s t-test (two-sided) *p < 0.05, ****p < 0.0001, corrected for multiple testing (Benjamini-Hochberg, entire FFA library). (E) Quantification of RELA translocation as percentage of total number of cells (t = 18 h, n = 5 replicates). Data are mean ± SD. Student’s t-test (two-sided) ****p < 0.0001, corrected for multiple testing (Bonferroni). (F) Glucose stimulated insulin secretion (GSIS) after FFA exposure ([FFA] = 500 μM, t = 24 h, n = 6 wells) was measured by ELISA. (G) Autophagosome formation was assessed by imaging LC3B puncta normalized to the number of total cells (t = 48 h, n = 4 wells). Data are mean ± SD. One-way ANOVA followed by Dunnett’s test. For A, D, E, G and H: bar color represents cluster identity (green, c3; red, c2; blue, c5; Fig. 1D). (H) Representative images of LC3B immunofluorescence (gray) in MIN6 cells treated with FFAs, BSA as negative control, or autophagy modulating drugs. Nuclei were detected by Hoechst (blue). c2 FFAs induce autophagosomes. Scale bars: 25 μm. (I) Number of iPSC-derived beta cells after exposure to EA or OA for 24, 48, or 72 h at 250 μM, 500 μM, or 750 μM. Only EA decreased cell count in a dose and time dependent manner. All EA conditions are significant per two-way ANOVA (p < 0.0001); all OA conditions are not significant. Data are mean ± SD, n = 4–6 wells/timepoint/FFA. (J) Representative images of iPSC-derived beta cells after treatment with BSA, EA, or OA for 48 h at 500 μM. Nuclei are marked by Hoechst and beta cell identity is marked by C-peptide staining (orange). Scale bars: 100 μm. (K) Quantification of C-peptide positive cells human beta cells dissociated from cadaveric primary islets normalized to the BSA control after exposure to each of 10 FFAs at 3 different concentrations (t = 5 days, n = 6 wells). c2 cluster MUFAs decreased human beta cell viability in a dose-dependent manner. Data are mean ± SD. Multiple t-test with Bonferroni correction (gold: p<0.05, blue: p<0.01, green: p<0.001, red: p<0.0001). (L) Representative images of human islets after treatment with BSA, EA, or OA. Nuclei are marked by Hoechst, and beta cell identity is marked by C-peptide staining (orange). Scale bars: 100 μm. PA, palmitic acid; EA, erucic acid; PSA, petroselenic acid; OA, oleic acid; AA, arachidonic acid; GLA: gamma-linoleic acid.
Fig. 5.
Fig. 5.. Long single bond chain in MUFA (EA) induces a distinct lipidomic profile that is associated with increased membrane rigidity.
(A) Selected features from the decision tree analysis based on meta-features of highest importance (Mean Decrease Accuracy; methods). The longest single bond chain is the meta-feature that predicts the inclusion of 13(Z), 16(Z), 19(Z)-docosatrienoic acid as the only PUFA in the c2 cluster, and distinguishes between toxic EA and non-toxic OA. (B) Accumulation of longer unsaturated acyl chains found by lipidomic analysis of MIN6 cells treated for 24 h with 500 μM EA (left). A network analysis of the biochemical relationship (lines) between significantly enriched lipid species in the EA-induced lipidome highlighted the accumulation of EA (22:1)-containing triglyceride (TAG) species (right). (C) Membrane rigidity as measured by the GP index of Laurdan dye in INS1E beta cells after 12 h treatment with 3–6 different concentrations of BSA, PA, EA, or OA. PA increases membrane rigidity proportionally to its concentration; EA decreases membrane rigidity at low concentration similar to OA, but at higher, toxic levels, EA increases membrane rigidity similar to PA. Data are mean ± SEM; n=6 wells.
Fig 6.
Fig 6.. Integration of lipotoxicity transcriptomic signature with T2D GWAS dataset identifies CMIP as mediator of genetic and environmental risk for disease.
(A) Gene set analysis (GSA) results based on the c2 lipotoxicity signature. T2D GWAS genes were ranked based on MAGMA score. A T1D and a schizophrenia GWAS dataset served as negative controls. Lipotoxicity gene sets are defined as top DE genes (1, 5, 10%) in transcriptomic profiles from the c2 cluster ranked by p-value and log2 fold change (LFC). GSA showed significant enrichment (FDR<0.05) for the top 5% (boxed) and 10% lipotoxicity gene sets. (B) Enrichment analysis for all FFA clusters (top 5% gene set) revealed that the c2 cluster gene set is uniquely enriched in the T2D GWAS dataset. (C) Scatter plot of genes based on T2D MAGMA rank (x-axis) and lipotoxicity rank (y-axis). Horizontal boundary defines top 5% lipotoxicity signature genes, vertical boundary defines top 600 MAGMA ranked T2D genes. As demonstrated in the schematic (top), genes located in the left (blue) quadrants are associated with T2D genetic risk, genes located in the bottom (yellow) quadrants are associated with lipotoxicity environmental risk, and genes located in the bottom left (green) quadrant are associated with both genetic and environmental risk. Genes of interest (red) drove the enrichment of the lipotoxicity signature in the GWAS dataset. (D) Expression pattern for the top 25 overlapping T2D-lipotoxicity genes across all FFA clusters. Size of dots represents the percentage of FFAs/cluster that induce significant differential expression of corresponding gene (p<0.05, Benjamini-Hochberg), colors represent strength and directionality of transcriptional changes (log2 fold change). (E) Venn diagram comparing the results of the analysis using the PA-induced signature alone compared with using the c2 lipotoxicity signature derived from all 20 lipotoxic FFAs. 19/25 genes, including GLP1R and CMIP, would have been missed if the analysis was limited to the PA-induced signature alone.
Fig 7.
Fig 7.. CMIP deletion sensitizes beta cells to FFA-mediated injury and cell death.
(A) CMIP deletion does not affect cell proliferation. No difference in the doubling rate between WT and CMIP KO cells (Two-sided t-test, n=19 splits). (B) After exposure to lipotoxic PA or EA, cell death is increased in CMIP KO compared to WT cells. Non-toxic OA and PSA are rendered toxic in CMIP KO cells. Cell death was measured as number of viable (caspase 3/7 and propidium iodide negative) cells compared to the non-treated control for WT and CMIP KO cells after 72 h exposure to FFAs (500 μM, n=21 wells). Data are mean ± SD. Two-way ANOVA with multiple comparisons (Šídák correction,****p < 0.0001). (C) Representative images of the cell death assay showing increased susceptibility to EA in CMIP-deleted cells. Nuclei were marked by Hoechst and apoptosis was measured by a caspase 3/7 dye (green). Dead cells were stained with propidium iodide (red). Scale bars: 100 μm. (D) Percentage of cells with RELA nuclear translocation after exposure to EA or BSA (500 μM) at 3 h intervals from 0 to 21 h after subtraction of baseline signal from non-treated cells. Data are mean ± SD, n = 7 wells. Two-way ANOVA with multiple comparisons (Šídák correction,****p < 0.0001). (E) Percentage of cells with RELA nuclear translocation after 3 h exposure to FFAs (500 μM) or TNFα (50 ng/ml; positive control) after subtraction of baseline signal from non-treated cells. CMIP KO increased the percentage of RELA translocation after PA or EA treatment. Data are mean ± SD. Two-way ANOVA with multiple comparisons (Šídák correction, ****p < 0.0001). (F) Insulin secretion at baseline normalized to BSA control after 24 h treatment with FFA (500 μM). Insulin secretion was reduced in CMIP deleted cells upon exposure to lipotoxic FFAs. Data are mean ± SD. Two-way ANOVA with multiple comparisons (Holm-Šídák correction, *p < 0.05). PA, palmitic acid; EA, erucic acid; PSA, petroselenic acid; OA, oleic acid.
Fig 8.
Fig 8.. CMIP protects beta cells from FFAs by regulating Akt activity, and human beta cells lacking CMIP are vulnerable to FFA-induced cell death.
(A) Reintroduction of CMIP in CMIP deleted cells (CMIP rescue) attenuates the toxic effects of EA. Percentage of cell death as measured by decreases in MIN6 viable cells compared to the non-treated control after 24 h exposure to FFAs (250 μM, n=9 wells). Data are mean ± SD. Two-way ANOVA with multiple comparisons (Tukey correction,****p < 0.0001). (B) CMIP rescue attenuates inflammatory NFkB signaling. Percentage of cells with RELA nuclear translocation upon treatment with EA (500 μM) for the indicated times after subtraction of baseline signal from non-treated cells. Data are mean ± SD, n = 6–9 wells. (C) CMIP rescue partially restores insulin secretion in cells exposed to c2 FFAs. Insulin secretion upon glucose stimulation normalized to BSA control for WT and CMIP KO cells after 24 h treatment with FFA (500 μM). Data are mean ± SD. Two way ANOVA with Šídák multiple comparison test (*p < 0.05, n=3 wells). (D) PI3K p85 immunoprecipitates with CMIP in beta cells. Western blot displaying lysate input (left) or co-IP with a CMIP or IgG control antibody (right) stained for CMIP (top) or PI3K (bottom) (n=3 blots). (E) Phosphorylated Akt (pAkt) abundance is increased in CMIP KO cells compared to WT controls. EA exposure increases pAkt in WT cells, but not in CMIP KO cells indicating that CMIP deletion maximizes pAkt levels at baseline. Western blot for pAkt and total Akt after 24 h treatment with 500 μM FFAs (GAPDH, loading control; n=3 blots). (F) In human iPSC-derived beta cells, CMIP deletion promotes cell death, in agreement with experiments in MIN6 beta cells (Fig. 7B). Cell death in human iPSC-derived beta cells as measured by decreases in cell count compared to BSA-treated control. Cells were treated with BSA, EA, or OA at 500 μM for 24 h (n=24 wells). (****p<0.0001, two-way ANOVA with Bonferroni multiple comparison test). (G) Representative images of cell death assay in human iPSC-derived beta cells as measured by number of nuclei (Hoechst). Scale bars: 100 μm. PA, palmitic acid; EA, erucic acid; OA, oleic acid.

References

    1. Abdelmagid Salma A., Clarke Shannon E., Nielsen Daiva E., Badawi Alaa, El-Sohemy Ahmed, Mutch David M., and Ma David W. L.. 2015. “Comprehensive Profiling of Plasma Fatty Acid Concentrations in Young Healthy Canadian Adults.” PLOS ONE. 10.1371/journal.pone.0116195. - DOI - PMC - PubMed
    1. Abifadel Marianne, Varret Mathilde, Rabès Jean-Pierre, Allard Delphine, Ouguerram Khadija, Devillers Martine, Cruaud Corinne, et al. 2003. “Mutations in PCSK9 Cause Autosomal Dominant Hypercholesterolemia.” Nature Genetics 34 (2): 154–56. - PubMed
    1. Abud Edsel M., Ramirez Ricardo N., Martinez Eric S., Healy Luke M., Nguyen Cecilia H. H., Newman Sean A., Yeromin Andriy V., et al. 2017. “iPSC-Derived Human Microglia-like Cells to Study Neurological Diseases.” Neuron 94 (2): 278–93.e9. - PMC - PubMed
    1. Al-Sulaiti Haya, Diboun Ilhame, Banu Sameem, Al-Emadi Mohamed, Amani Parvaneh, Harvey Thomas M., Dömling Alex S., Latiff Aishah, and Elrayess Mohamed A.. 2018. “Triglyceride Profiling in Adipose Tissues from Obese Insulin Sensitive, Insulin Resistant and Type 2 Diabetes Mellitus Individuals.” Journal of Translational Medicine 16 (1): 175. - PMC - PubMed
    1. Anders Simon, Pyl Paul Theodor, and Huber Wolfgang. 2015. “HTSeq--a Python Framework to Work with High-Throughput Sequencing Data.” Bioinformatics 31 (2): 166–69. - PMC - PubMed

Publication types